U.S. Department of Transportation
Federal Highway Administration
1200 New Jersey Avenue, SE
Washington, DC 20590
202-366-4000


Skip to content
Facebook iconYouTube iconTwitter iconFlickr iconLinkedInInstagram

Federal Highway Administration Research and Technology
Coordinating, Developing, and Delivering Highway Transportation Innovations

 
REPORT
This report is an archived publication and may contain dated technical, contact, and link information
Back to Publication List        
Publication Number:  FHWA-HRT-14-070    Date:  September 2014
Publication Number: FHWA-HRT-14-070
Date: September 2014


Wind Tunnel Investigations of An Inclined Stay Cable With A Helical Fillet

APPENDIX B. SUMMARY OF RESULTS

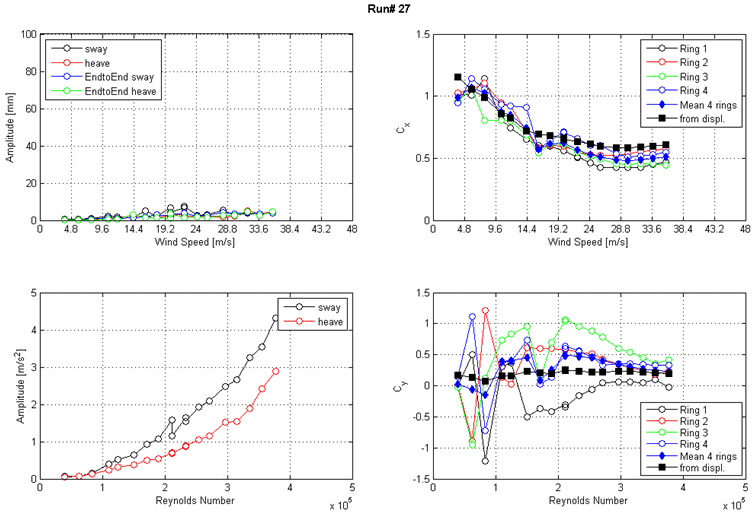
These four graphs show the run 27 response of the cable as a function of wind speed or Reynolds number as measured by the lasers, accelerometers, and surface pressures. The top left graph shows the displacement amplitude on the y-axis from 0 to 100 mm and wind speed on the x-axis from 0 to 48 m/s. Four lines are shown: sway, heave, end-to-end sway, and end-to-end heave. The top right graph shows the along-wind force coefficient (Cx) on the y-axis from 0 to 1.5 and wind speed on the x-axis from 0 to 48 m/s. The four rings of pressure taps, the mean of four rings, and the coefficient derived from displacement are plotted as separate curves.The bottom left graph shows the acceleration amplitude on the y-axis from 0 to 5 m/s2 and Reynolds number on the x-axis from 0 to 5x10(to the 5th). Two lines are shown: sway and heave. The bottom right graph shows the across-wind force coefficient (Cy) on the y-axis from -1.5 to 1.5 and Reynolds number on the x-axis from 0 to 5x10(to the 5th). The four rings of pressure taps, the mean of four rings, and the coefficient derived from displacement are plotted as separate curves.
Figure 59. Graph. Response of the cable as a function of wind speed or Reynolds number as measured by the lasers, accelerometers, and surface pressures for run 27.


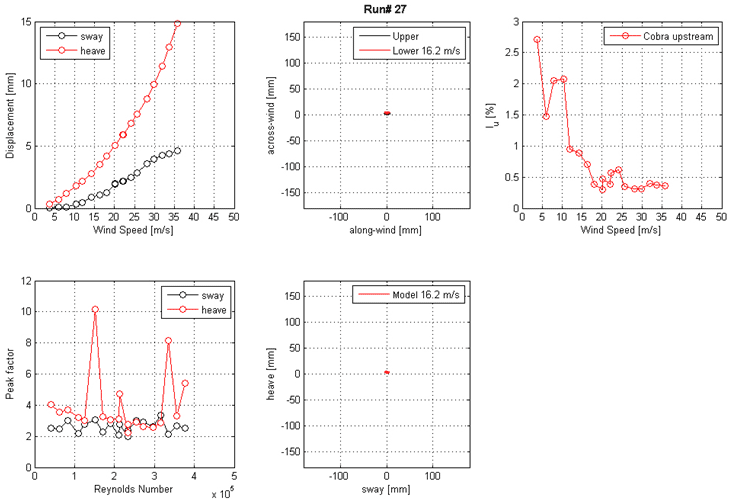
These five graphs show the run 27 mean displacement and peak factor from the laser, motion path at one wind speed, and intensity of turbulence measured at the entrance of the test section. The top left graph shows displacement on the y-axis from 0 to 15 and wind speed on the x-axis from 0 to 50 m/s for sway and heave. The top middle graph shows across-wind on the y-axis from -150 to 150 mm and along-wind on the x-axis from -100 to 100 mm for the top and bottom ends of the cable model at a specific wind speed. The top right graph shows the turbulence intensity in the along-wind direction on the y-axis from 0 to 3 percent and the wind speed on the x-axis from 0 to 50 m/s measured by a Cobra Probe upstream of the cable model. The bottom left graph shows the peak factor on the y-axis from 0 to 12 and Reynolds number on the x-axis from 0 to 5x10(to the 5th) for sway and heave. The bottom middle graph shows the motion path of heave on the y-axis from -150 to 150 mm and sway on the x-axis from -100 to 100 mm of the top and bottom ends of the cable model at a specific wind speed.
Figure 60. Graph. Mean displacement and peak factor from the laser, motion path at one wind speed, and intensity of turbulence measured at the entrance of the test section for run 27.


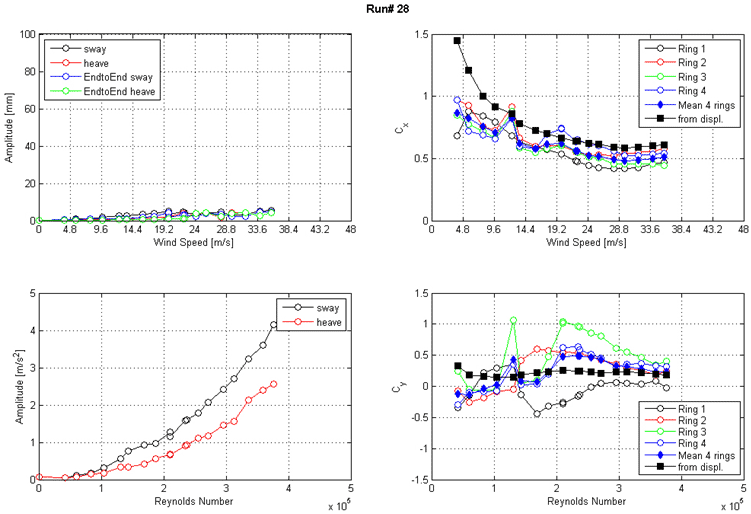
These four graphs show the run 28 response of the cable as a function of wind speed or Reynolds number as measured by the lasers, accelerometers, and surface pressures. The top left graph shows the displacement amplitude on the y-axis from 0 to 100 mm and wind speed on the x-axis from 0 to 48 m/s. Four lines are shown: sway, heave, end-to-end sway, and end-to-end heave. The top right graph shows the along-wind force coefficient (Cx) on the y-axis from 0 to 1.5 and wind speed on the x-axis from 0 to 48 m/s. The four rings of pressure taps, the mean of four rings, and the coefficient derived from displacement are plotted as separate curves. The bottom left graph shows the acceleration amplitude on the y-axis from 0 to 5 m/s2 and Reynolds number on the x-axis from 0 to 5x10(to the 5th). Two lines are shown: sway and heave. The bottom right graph shows the across-wind force coefficient (Cy) on the y-axis from -1.5 to 1.5 and Reynolds number on the x-axis from 0 to 5x10(to the 5th). The four rings of pressure taps, the mean of four rings, and the coefficient derived from displacement are plotted as separate curves.
Figure 61. Graph. Response of the cable as a function of wind speed or Reynolds number as measured by the lasers, accelerometers, and surface pressures for run 28.


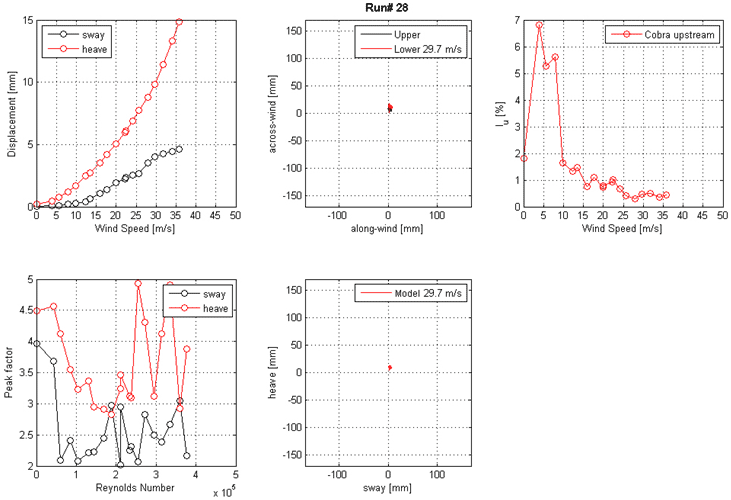
These five graphs show the run 28 mean displacement and peak factor from the laser, motion path at one wind speed, and intensity of turbulence measured at the entrance of the test section. The top left graph shows displacement on the y-axis from 0 to 15 mm and wind speed on the x-axis from 0 to 50 m/s for sway and heave. The top middle graph shows the motion path in along-wind direction on the x-axis from -100 to 100 mm and across-wind direction on the y-axis from -150 to 150 mm of the top end and bottom end of the cable model at a specific wind speed. The top right graph shows the turbulence intensity in the along-wind direction on the y-axis from 0 to 7 percent measured by the Cobra Probe upstream of the cable model and wind speed on the x-axis from 0 to 50 m/s.The bottom left graph shows the peak factor on the y-axis from 2 to 5 and Reynolds number on the x-axis from 0 to 5x10(to the 5th) for sway and heave. The bottom middle graph shows the motion path for heave on the y-axis from -150 to 150 mm and sway from -100 to 100 mm of the top end and bottom ends of the cable model at a specific wind speed.
Figure 62. Graph. Mean displacement and peak factor from the laser, motion path at one wind speed, and intensity of turbulence measured at the entrance of the test section for run 28.


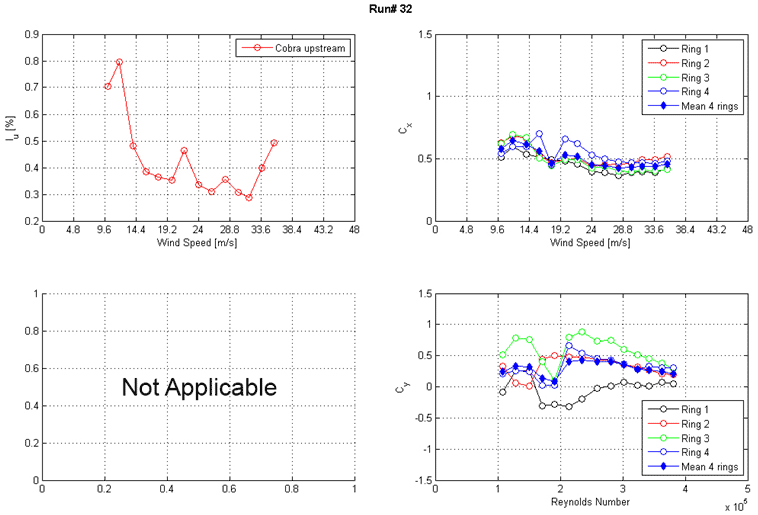
These three graphs show the run 32 intensity of turbulence measured at the entrance of the test section and along-wind and across-wind mean force coefficients (Cx and Cy) calculated from surface pressure measurements as a function of Reynolds number and wind speed. The top left graph shows the turbulence intensity in the along-wind direction measured at the entrance of the test section for a Cobra Probe in the upstream direction. Turbulence intensity is on the y-axis from 0.2 to 0.9 percent, and wind speed is on the x-axis from 0 to 48 m/s. The top right graph shows Cx on the y-axis from 0 to 1.5 and wind speed on the x-axis from 0 to 48 m/s. Results from the four rings of pressure taps and the mean of four rings are plotted as separate curves. The bottom right graph shows Cy on the y-axis from -1.5 to 1.5 and Reynolds number on the x-axis from 0 to 5x10(to the 5th). Results from the four rings of pressure taps and the mean of four rings are plotted as separate curves.
Figure 63. Graph. Intensity of turbulence measured at the entrance of the test section and Cx and Cy calculated from surface pressure measurements as a function of Reynolds number and wind speed for run 32.


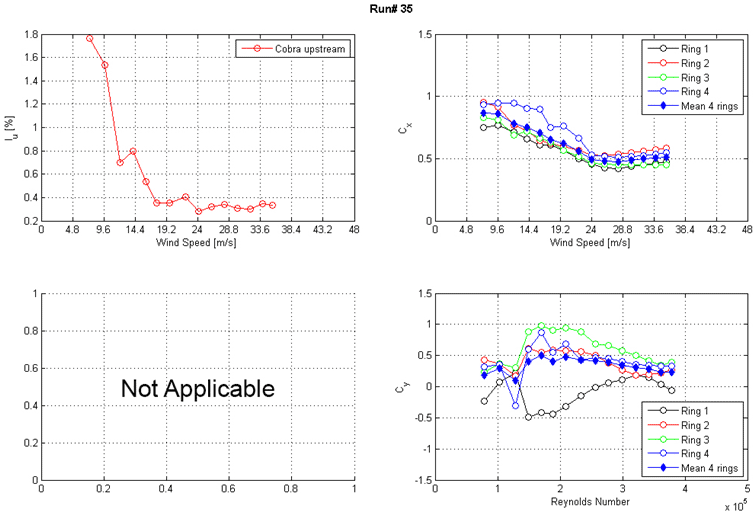
These three graphs show the run 35 intensity of turbulence measured at the entrance of the test section and along-wind and across-wind mean force coefficients (Cx and Cy) calculated from surface pressure measurements as a function of Reynolds number and wind speed. The top left graph shows the turbulence intensity in the along-wind direction measured at the entrance of the test section for a Cobra Probe in the upstream direction. Turbulence intensity is on the y-axis from 0.2 to 1.8 percent, and wind speed is on the x-axis from 0 to 48 m/s. The top right graph shows Cx on the y-axis from 0 to 1.5 and wind speed on the x-axis from 0 to 48 m/s. Results from the four rings of pressure taps and the mean of four rings are plotted as separate curves. The bottom right graph shows Cy on the y-axis from -1.5 to 1.5 and Reynolds number from 0 to 5x10(to the 5th). Results from the four rings of pressure taps and the mean of four rings are plotted as separate curves.
Figure 64. Graph. Intensity of turbulence measured at the entrance of the test section and Cx and Cy calculated from surface pressure measurements as a function of Reynolds number and wind speed for run 35.


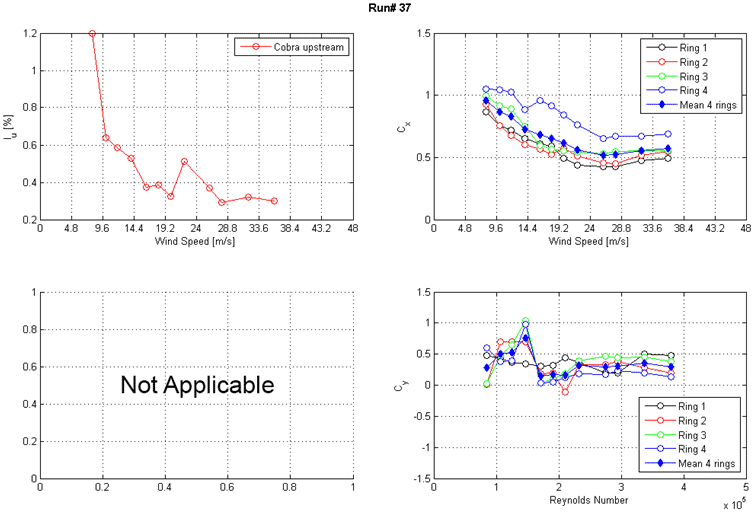
These three graphs show the run 37 intensity of turbulence measured at the entrance of the test section and along-wind and across-wind mean force coefficients (Cx and Cy) calculated from surface pressure measurements as a function of Reynolds number and wind speed. The top left graph shows the turbulence intensity in the along-wind direction measured at the entrance of the test section using a Cobra Probe in the upstream direction. Turbulence intensity is on the y-axis from 0.2 to 1.2 percent, and wind speed is on the x-axis from 0 to 48 m/s. The top right graph shows Cx on the y-axis from 0 to 1.5 and wind speed on the x-axis from 0 to 48 m/s. Results from the four rings of pressure taps and the mean of four rings are plotted as separate curves. The bottom right graph shows Cy on the y-axis from -1.5 to 1.5 and Reynolds number on the x-axis from 0 to 5x10(to the 5th). Results from the four rings of pressure taps and the mean of four rings are plotted as separate curves.
Figure 65. Graph. Intensity of turbulence measured at the entrance of the test section and Cx and Cy calculated from surface pressure measurements as a function of Reynolds number and wind speed for run 37.


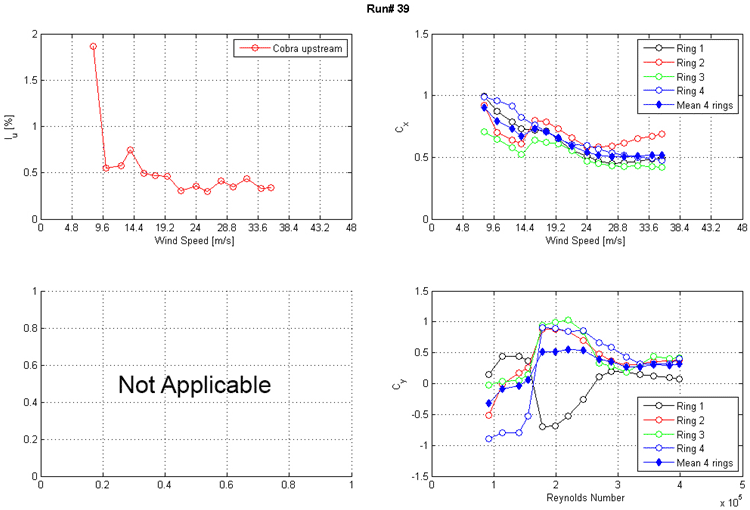
These three graphs show the run 39 intensity of turbulence measured at the entrance of the test section and along-wind and across-wind mean force coefficients (Cx and Cy) calculated from surface pressure measurements as a function of Reynolds number and wind speed. The top left graph shows the turbulence intensity in the along-wind direction measured at the entrance of the test section using a Cobra Probe in the upstream direction. Turbulence intensity is on the y-axis from 0 to 2 percent, and wind speed is on the x-axis from 0 to 48 m/s. The top right graph shows Cx on the y-axis from 0 to 1.5 and wind speed on the x-axis from 0 to 48 m/s. Results from the four rings of pressure taps and the mean of four rings are plotted as separate curves. The bottom right graph shows Cy on the y-axis from -1.5 to 1.5 and Reynolds number on the x-axis from 0 to 5x10(to the 5th). Results from the four rings of pressure taps and the mean of four rings are plotted as separate curves.
Figure 66. Graph. Intensity of turbulence measured at the entrance of the test section and Cx and Cy calculated from surface pressure measurements as a function of Reynolds number and wind speed for run 39.


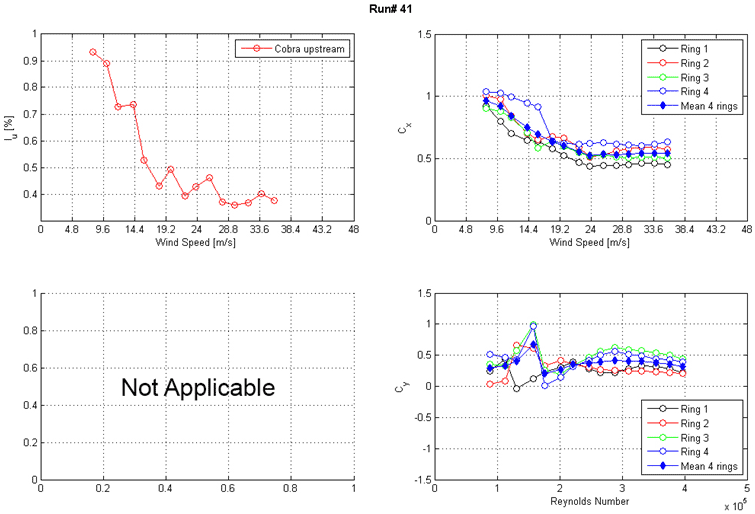
These three graphs show the run 41 intensity of turbulence measured at the entrance of the test section and along-wind and across-wind mean force coefficients (Cx and Cy) calculated from surface pressure measurements as a function of Reynolds number and wind speed. The top left graph shows the turbulence intensity in the along-wind direction measured at the entrance of the test section using a Cobra Probe in the upstream direction. Turbulence intensity is on the y-axis from 0 to 1 percent, and wind speed is on the x-axis from 0 to 48 m/s. The top right graph shows Cx on the y-axis from 0 to 1.5 and wind speed on the x-axis from 0 to 48 m/s. Results from the four rings of pressure taps and the mean of four rings are plotted as separate curves. The bottom right graph shows Cy on the y-axis from -1.5 to 1.5 and Reynolds number on the x-axis from 0 to 5x10(to the 5th). Results from the four rings of pressure taps and the mean of four rings are plotted as separate curves.
Figure 67. Graph. Intensity of turbulence measured at the entrance of the test section and Cx and Cy calculated from surface pressure measurements as a function of Reynolds number and wind speed for run 41.


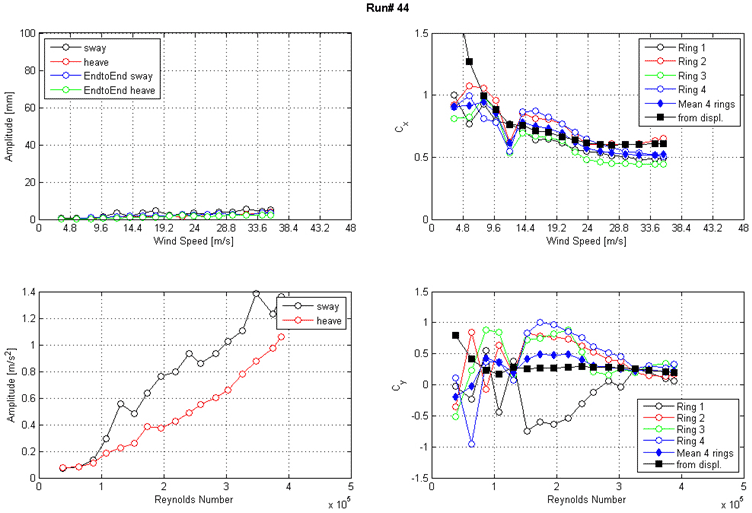
These four graphs show run 44 response of the cable as a function of wind speed or Reynolds number as measured by the lasers, accelerometers, and surface pressures. The top left graph shows the displacement amplitude on the y-axis from 0 to 100 mm and wind speed on the x-axis from 0 to 48 m/s for sway, heave, end-to-end sway, and end-to-end heave. The top right graph shows the along-wind force coefficient (Cx) on the y-axis from 0 to 1.5 and wind speed on the x-axis from 0 to 48 m/s. The four rings of pressure taps, the mean of four rings, and the coefficient derived from displacement are plotted as separate curves. The bottom left graph shows the acceleration amplitude for sway and heave. Amplitude is on the y-axis from 0 to 1.4 m/s2,  and Reynolds number is on the x-axis from 0 to 5x10(to the 5th). The bottom right graph shows the across-wind force coefficient (Cy) on the y-axis from -1.5 to 1.5 and Reynolds number on the x-axis from 0 to 5x10(to the 5th). The four rings of pressure taps, the mean of four rings, and the coefficient derived from displacement are plotted as separate curves.
Figure 68. Graph. Response of the cable as a function of wind speed or Reynolds number as measured by the lasers, accelerometers, and surface pressures for run 44.


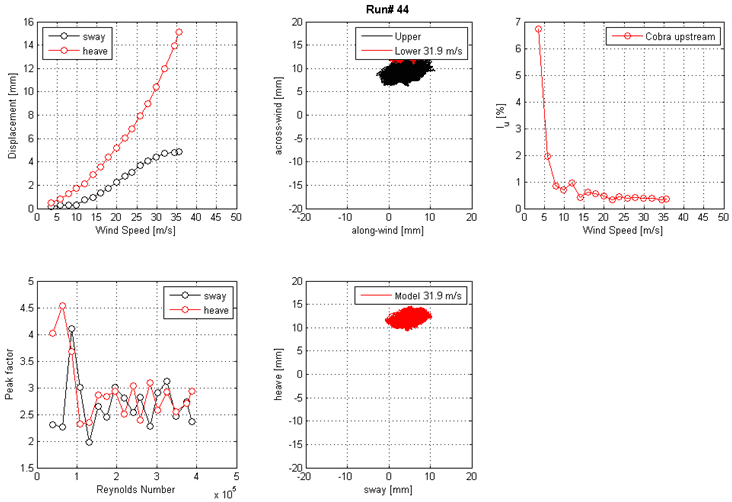
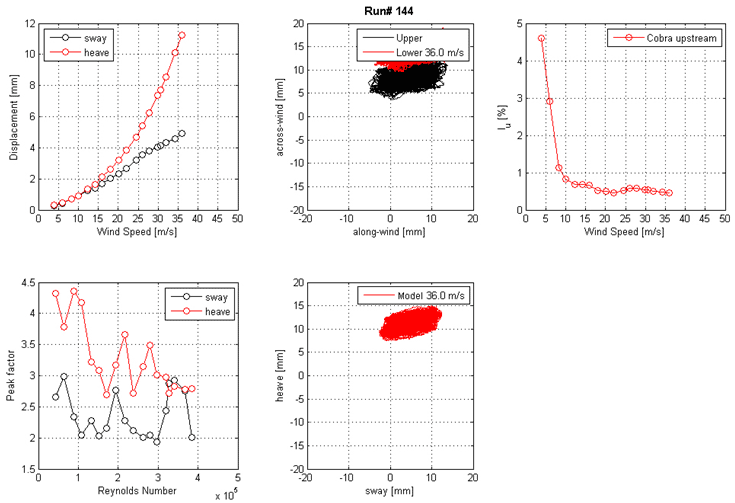
These five graphs show the run 44 mean displacement and peak factor from the laser, motion path at one wind speed, and intensity of turbulence measured at the entrance of the test section. The top left graph shows displacement response on the y-axis from 0 to 16 mm and wind speed on the x-axis from 0 to 50 m/s for sway and heave. The top middle graph shows the motion path in the along-wind direction on the x-axis from -20 to 20 mm and across-wind direction on the y-axis from -20 to 20 mm for the top end and bottom ends of the cable model at a specific wind speed. The top right graph shows the turbulence intensity in the along-wind direction measured by a Cobra Probe upstream of the cable model. Turbulence intensity is on the y-axis from 0 to 7 percent, and wind speed is on the x-axis from 0 to 50 m/s. The bottom left graph shows the peak factor on the y-axis from 1.5 to 5 and Reynolds number on the x-axis from 0 to 5x10(to the 5th) for sway and heave. The bottom middle graph shows the motion path in sway on the x-axis from -20 to 20 mm and heave on the y-axis from -20 to 20 mm for the top end and bottom ends of the cable model at a specific wind speed.
Figure 69. Graph. Mean displacement and peak factor from the laser, motion path at one wind speed, and intensity of turbulence measured at the entrance of the test section for run 44.


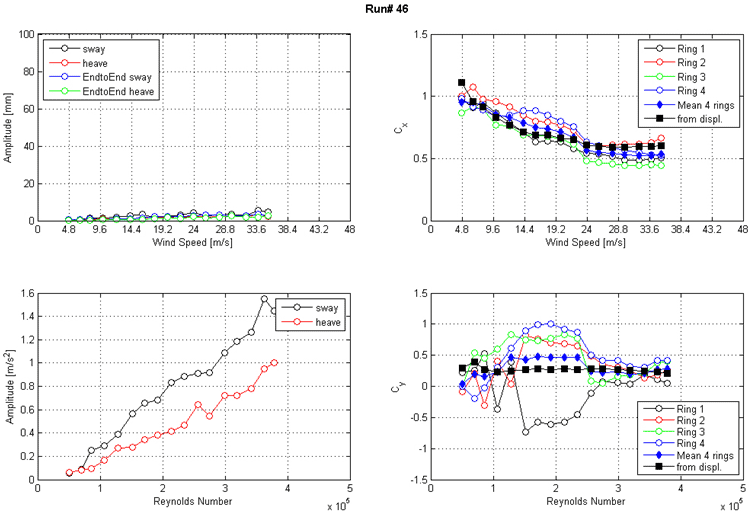
These four graphs show the run 46 response of the cable as a function of wind speed or Reynolds number as measured by the lasers, accelerometers, and surface pressures. The top left graph shows the displacement amplitude on the y-axis from 0 to 100 mm and wind speed on the x-axis from 0 to 48 m/s for sway, heave, end-to-end sway, and end-to-end heave. The top right graph shows the along-wind force coefficient (Cx) on the y-axis from 0 to 1.5 and wind speed on the x-axis from 0 to 48 m/s. The four rings of pressure taps, the mean of four rings, and the coefficient derived from displacement are plotted as separate curves.The bottom left graph shows the acceleration amplitude on the y-axis from 0 to 1.6 m/s2 and Reynolds number on the x-axis from 0 to 5x10(to the 5th) for sway and heave. The bottom right graph shows the across-wind force coefficient (Cy) on the y-axis from -1.5 to 1.5 and Reynolds number on the x-axis 0 to 5x10(to the 5th). The four rings of pressure taps, the mean of four rings, and the coefficient derived from displacement are plotted as separate curves.
Figure 70. Graph. Response of the cable as a function of wind speed or Reynolds number as measured by the lasers, accelerometers, and surface pressures for run 46.


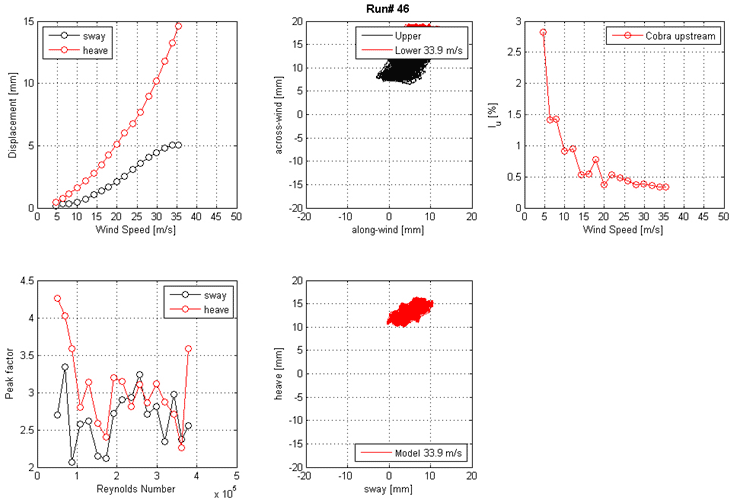
These five graphs show the run 46 mean displacement and peak factor from the laser, motion path at one wind speed, and intensity of turbulence measured at the entrance of the test section. The top left graph shows displacement on the y-axis from 0 to 15 mm and wind speed on the x-axis from 0 to 50 m/s for sway and heave. The top middle graph shows the motion path in the along-wind direction on the x-axis from -20 to 20 mm and across-wind direction on the y-axis from -20 to 20 mm of the top end and bottom ends of the cable model at a specific wind speed. The top right graph shows the turbulence intensity in the along-wind direction measured by the Cobra Probe upstream of the cable model. Turbulence instensity is on the y-axis from 0 to 3 percent, and wind speed is on the x-axis from 0 to 50 m/s. The bottom left graph shows the peak factor of sway and heave on the y-axis from 2 to 4.5 and Reynolds number on the x-axis from 0 to 5x10(to the 5th). The bottom middle graph shows the motion path in sway on the x-axis from -20 to 20 mm and heave on the y-axis from -20 to 20 mm for the top end and bottom ends of the cable model at a specific wind speed.
Figure 71. Graph. Mean displacement and peak factor from the laser, motion path at one wind speed, and intensity of turbulence measured at the entrance of the test section for run 46.


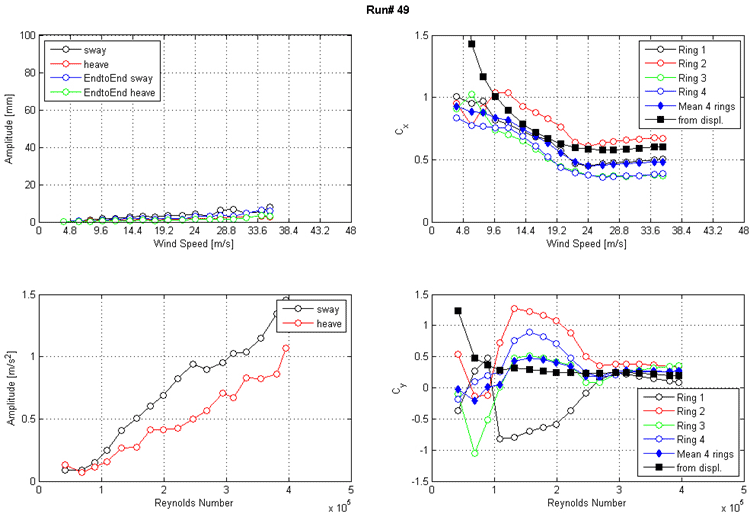
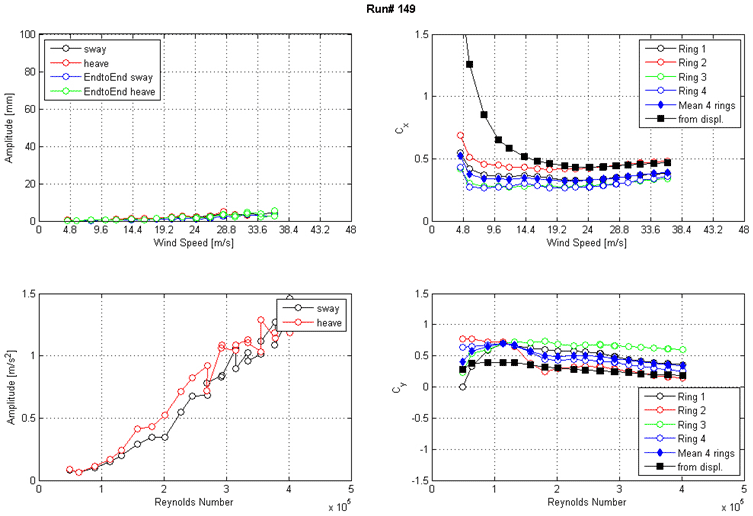
These four graphs show the run 49 response of the cable as a function of wind speed or Reynolds number as measured by the lasers, accelerometers, and surface pressures. The top left graph shows the displacement amplitude on the y-axis from 0 to 100 mm and wind speed on the x-axis from 0 to 48 m/s for sway, heave, end-to-end sway, and end-to-end heave. The top right graph shows the along-wind force coefficient (Cx) on the y-axis from 0 to 1.5 and wind speed on the x-axis from 0 to 48 m/s. The four rings of pressure taps, the mean of four rings, and the coefficient derived from displacement are plotted as separate curves.The bottom left graph shows the acceleration amplitude on the y-axis from 0 to 1.5 m/s2 and Reynolds number on the x-axis from 0 to 5x10(to the 5th) for sway and heave. The bottom right graph shows the across-wind force coefficient (Cy) on the y-axis from -1.5 to 1.5 and Reynolds number on the x-axis from 0 to 5x10(to the 5th). The four rings of pressure taps, the mean of four rings, and the coefficient derived from displacement are plotted as separate curves.
Figure 72. Graph. Response of the cable as a function of wind speed or Reynolds number as measured by the lasers, accelerometers, and surface pressures for run 49.


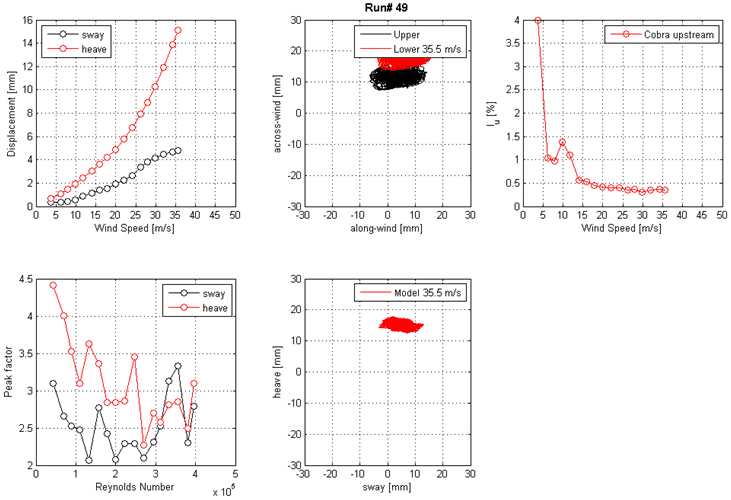
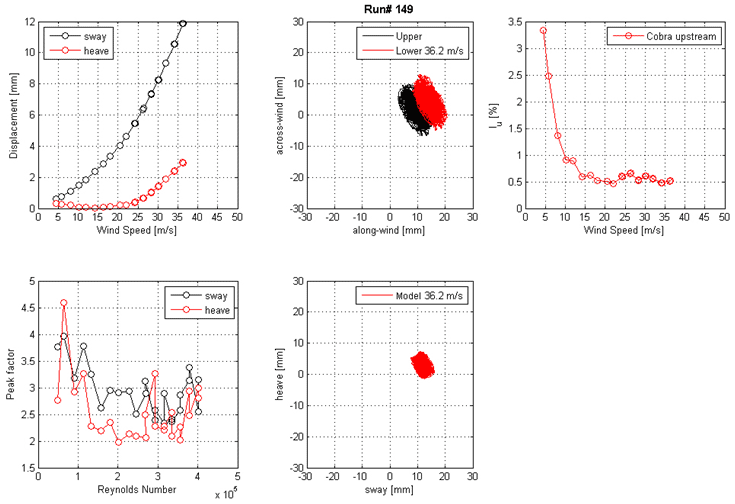
These five graphs show the run 49 mean displacement and peak factor from the laser, motion path at one wind speed, and intensity of turbulence measured at the entrance of the test section. The top left graph shows displacement on the y-axis from 0 to 16 mm and wind speed  on the x-axis from 0 to 50 m/s for sway and heave. The top middle graph shows the motion path in the along-wind direction on the x-axis from -30 to 30 mm and the across-wind direction on the y-axis from -30 to 30 mm for the top end and bottom ends of the cable model at a specific wind speed. The top right graph shows the turbulence intensity in the along-wind direction measured by the Cobra Probe upstream of the cable model. Turbulence intensity is on the y-axis from 0 to 4 percent, and wind speed is on the x-axis from 0 to 50 m/s. The bottom left graph shows the peak factor on the y-axis from 2 to 4.5 and Reynolds number on the x-axis from 0 to 5x10(to the 5th) for sway and heave. The bottom middle graph shows the motion path in sway on the x-axis from -30 to 30 mm and heave on the y-axis from -30 to 30 mm for the top end and bottom ends of the cable model at a specific wind speed.
Figure 73. Graph. Mean displacement and peak factor from the laser, motion path at one wind speed, and intensity of turbulence measured at the entrance of the test section for run 49.


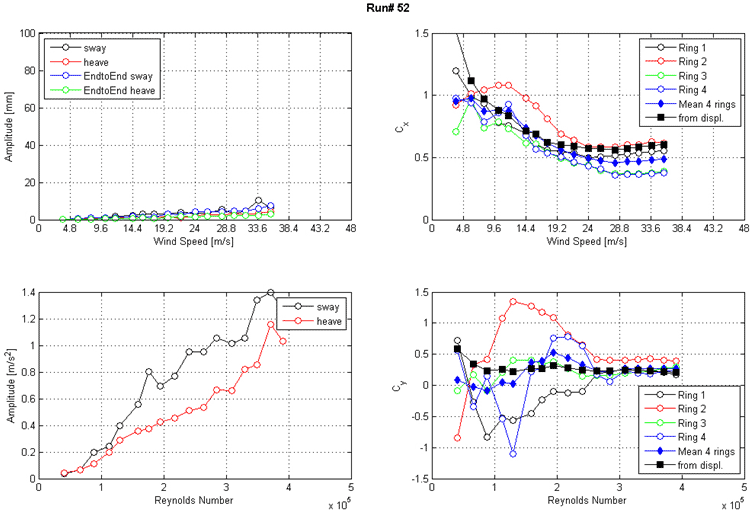
These four graphs show the run 52 response of the cable as a function of wind speed or Reynolds number as measured by the lasers, accelerometers, and surface pressures. The top left graph shows the displacement amplitude on the y-axis from 0 to 100 mm and wind speed on the x-axis from 0 to 48 m/s for sway, heave, end-to-end sway, and end-to-end heave. The top right graph shows the along-wind force coefficient (Cx) on the y-axis from 0 to 1.5 and wind speed on the x-axis from 0 to 48 m/s. The four rings of pressure taps, the mean of four rings, and the coefficient derived from displacement are plotted as separate curves. The bottom left graph shows the acceleration amplitude on the y-axis from 0 to 1.4 and Reynolds number on the x-axis from 0 to 5x10(to the 5th) for sway and heave. The bottom right graph shows the across-wind force coefficient (Cy) on the y-axis from -1.5 to 1.5 and Reynolds number on the x-axis from 0 to 5x10(to the 5th). The four rings of pressure taps, the mean of four rings, and the coefficient derived from displacement are plotted as separate curves.
Figure 74. Graph. Response of the cable as a function of wind speed or Reynolds number as measured by the lasers, accelerometers, and surface pressures for run 52.


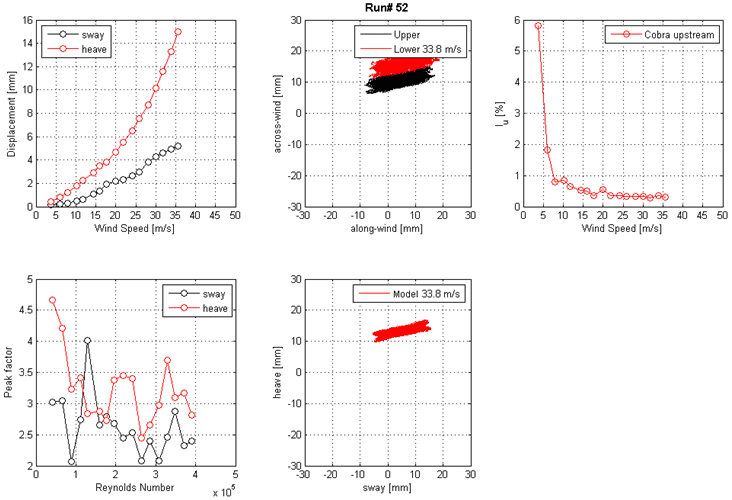
These five graphs show the run 52 mean displacement and peak factor from the laser, motion path at one wind speed, and intensity of turbulence measured at the entrance of the test section. The top left graph shows displacement on the y-axis from 0 to 16 mm and wind speed on the x-axis from 0 to 50 m/s for sway and heave. The top middle graph shows the motion path in the along-wind direction on the x-axis from -30 to 30 mm and in the across-wind direction on the y-axis from -30 to 30 mm for the top end and bottom ends of the cable model at a specific wind speed. The top right graph shows the turbulence intensity in the along-wind direction measured by the Cobra Probe upstream of the cable model. Turbulence intensity is on the y-axis from 0 to 6 percent, and wind speed is on the x-axis from 0 to 50 m/s. The bottom left graph shows the peak factor on the y-axis from 2 to 5 and Reynolds number on the x-axis from 0 to 5x10(to the 5th) for sway and heave. The bottom middle graph shows the motion path in sway on the x-axis from -30 to 30 mm and heave on the y-axis from -30 to 30 mm for the top end and bottom ends of the cable model at a specific wind speed.
Figure 75. Graph. Mean displacement and peak factor from the laser, motion path at one wind speed, and intensity of turbulence measured at the entrance of the test section for run 52.


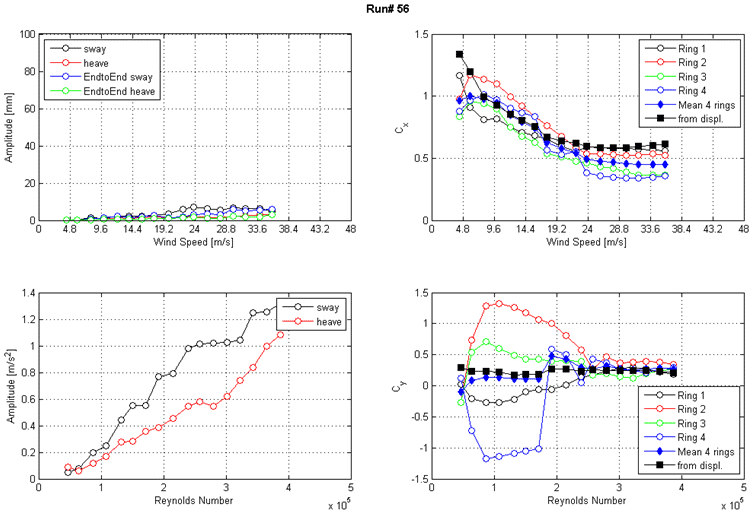
These four graphs show the run 56 response of the cable as a function of wind speed or Reynolds number as measured by the lasers, accelerometers, and surface pressures. The top left graph shows the displacement amplitude on the y-axis from 0 to 100 m/s and wind speed on the x-axis from 0 to 48 m/s for sway, heave, end-to-end sway, and end-to-end heave. The top right graph shows the along-wind force coefficient (Cx) on the y-axis from 0 to 1.5 and wind speed on the x-axis from 0 to 48 m/s. The four rings of pressure taps, the mean of four rings, and the coefficient derived from displacement are plotted as separate curves. The bottom left graph shows the acceleration amplitude on the y-axis from 0 to 1.4 m/s2 and Reynolds number on the x-axis from 0 to 5x10(to the 5th) for sway and heave. The bottom right graph shows the across-wind force coefficient (Cy) on the y-axis from -1.5 to 1.5 and Reynolds number on the x-axis from 0 to 5x10(to the 5th). The four rings of pressure taps, the mean of four rings, and the coefficient derived from displacement are plotted as separate curves.
Figure 76. Graph. Response of the cable as a function of wind speed or Reynolds number as measured by the lasers, accelerometers, and surface pressures for run 56.


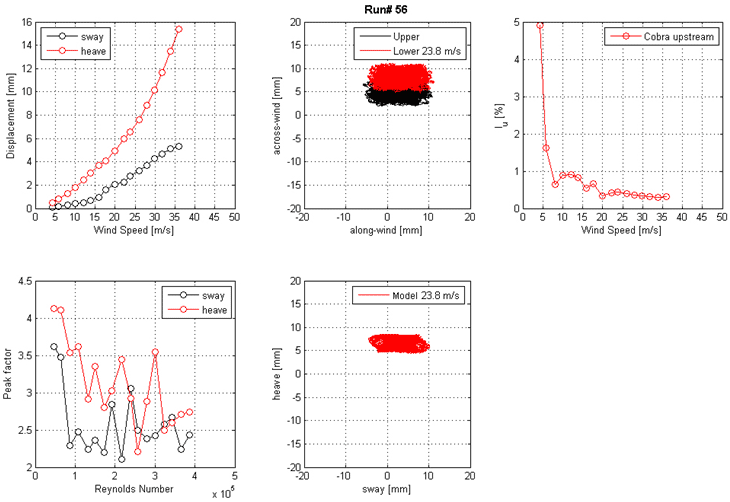
These five graphs show the run 56 mean displacement and peak factor from the laser, motion path at one wind speed, and intensity of turbulence measured at the entrance of the test section. The top left graph shows displacement on the y-axis from 0 to 16 mm and wind speed  on the x-axis from 0 to 50 m/s for sway and heave. The top middle graph shows the motion path in the along-wind direction on the x-axis from -20 to 20 mm and in the across-wind direction on the y-axis from -20 to 20 mm for the top and bottom ends of the cable model at a specific wind speed. The top right graph shows the turbulence intensity in the along-wind direction measured by the Cobra Probe upstream of the cable model. Turbulence intensity is on the y-axis from 0 to 5 percent, and wind speed is on the x-axis from 0 to 50 m/s. The bottom left graph shows the peak factor on the y-axis from 2 to 4.5 and Reynolds number on the x-axis from 0 to 5x10(to the 5th) for sway and heave. The bottom middle graph shows the motion path in sway on the x-axis from -20 to 20 mm and heave on the y-axis from -20 to 20 mm for the top and bottom ends of the cable model at a specific wind speed.
Figure 77. Graph. Mean displacement and peak factor from the laser, motion path at one wind speed, and intensity of turbulence measured at the entrance of the test section for run 56.


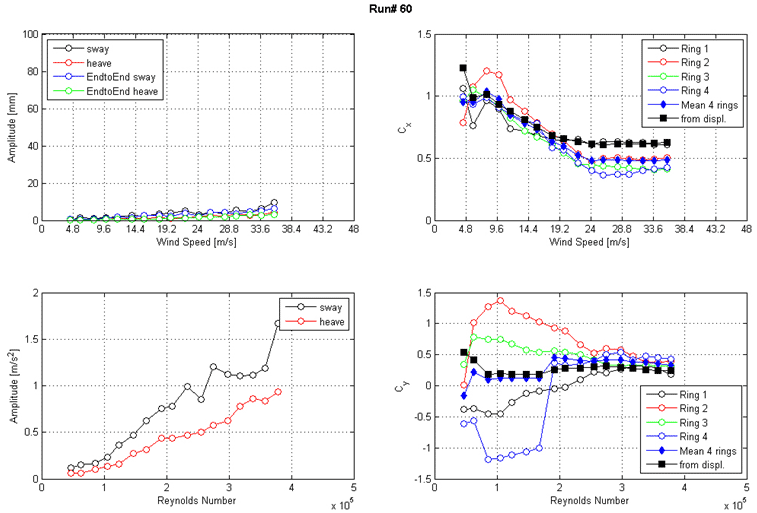
These four graphs show the run 60 response of the cable as a function of wind speed or Reynolds number as measured by the lasers, accelerometers, and surface pressures. The top left graph shows the displacement amplitude on the y-axis from 0 to 100 mm and wind speed on the x-axis from 0 to 48 m/s for sway, heave, end-to-end sway, and end-to-end heave. The top right graph shows the along-wind force coefficient (Cx) on the y-axis from 0 to 1.5 and wind speed on the x-axis from 0 to 48 m/s. The four rings of pressure taps, the mean of four rings, and the coefficient derived from displacement are plotted as separate curves. The bottom left graph shows the acceleration amplitude on the y-axis from 0 to 2 m/s2 and Reynolds number on the x-axis from 0 to 5x10(to the 5th) for sway and heave. The bottom right graph shows the across-wind force coefficient (Cy) on the y-axis from -1.5 to 1.5 and Reynolds number on the x-axis from 0 to 5x10(to the 5th). The four rings of pressure taps, the mean of four rings, and the coefficient derived from displacement are plotted as separate curves.
Figure 78. Graph. Response of the cable as a function of wind speed or Reynolds number as measured by the lasers, accelerometers, and surface pressures for run 60.


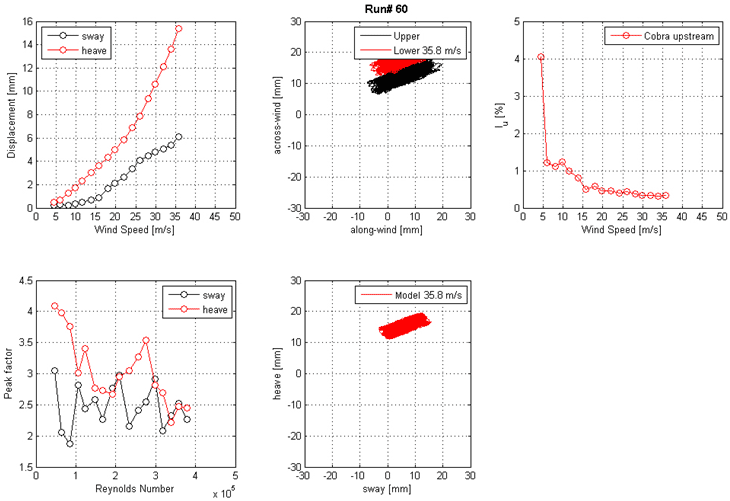
These five graphs show the run 60 mean displacement and peak factor from the laser, motion path at one wind speed, and intensity of turbulence measured at the entrance of the test section. The top left graph shows displacement on the y-axis from 0 to 15 mm and wind speed on the x-axis from 0 to 50 m/s for sway and heave. The top middle graph shows the motion path in the along-wind direction on the x-axis from -30 to 30 mm and the across-wind direction on the y-axis from -30 to 30 mm for the top and bottom ends of the cable model at a specific wind speed. The top right graph shows the turbulence intensity in the along-wind direction measured by the Cobra Probe upstream of the cable model. Turbulence intensity is on the y-axis from 0 to 5 percent, and wind speed is on the x-axis from 0 to 50 m/s. The bottom left graph shows the peak factor on the y-axis from 1.5 to 4.5 and Reynolds number on the x-axis from 0 to 5x10(to the 5th) for sway and heave. The bottom middle graph shows the motion path in sway on the x-axis from -30 to 30 mm and heave on the y-axis from -30 to 30 mm for the top and bottom ends of the cable model at a specific wind speed.
Figure 79. Graph. Mean displacement and peak factor from the laser, motion path at one wind speed, and intensity of turbulence measured at the entrance of the test section for run 60.


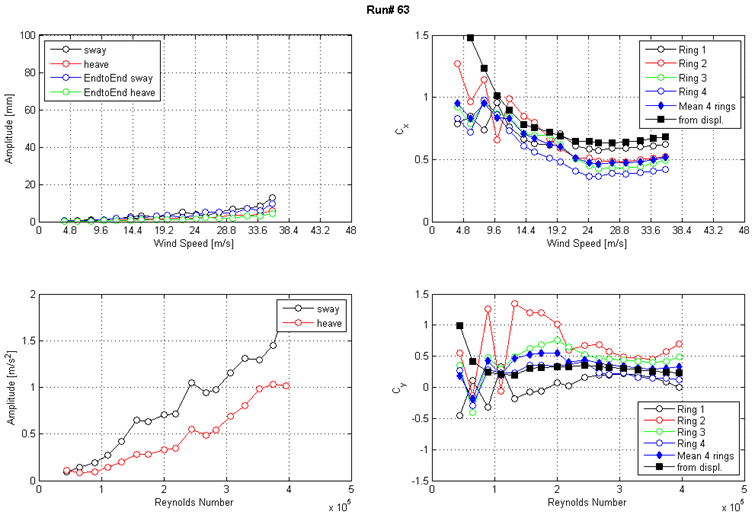
These four graphs show the run 63 response of the cable as a function of wind speed or Reynolds number as measured by the lasers, accelerometers, and surface pressures. The top left graph shows the displacement amplitude on the y-axis from 0 to 100 mm and wind speed on the x-axis from 0 to 48 m/s for sway, heave, end-to-end sway, and end-to-end heave. The top right graph shows the along-wind force coefficient (Cx) on the y-axis from 0 to 1.5 and wind speed on the x-axis from 0 to 48 m/s. The four rings of pressure taps, the mean of four rings, and the coefficient derived from displacement are plotted as separate curves.The bottom left graph shows the acceleration amplitude on the y-axis from 0 to 2 m/s2 and Reynolds number on the x-axis from 0 to 5x10(to the 5th) for sway and heave. The bottom right graph shows the across-wind force coefficient (Cy) on the y-axis from -1.5 to 1.5 and Reynolds number on the x-axis from 0 to 5x10(to the 5th). The four rings of pressure taps, the mean of four rings, and the coefficient derived from displacement are plotted as separate curves.
Figure 80. Graph. Response of the cable as a function of wind speed or Reynolds number as measured by the lasers, the accelerometers, and surface pressures for run 63.


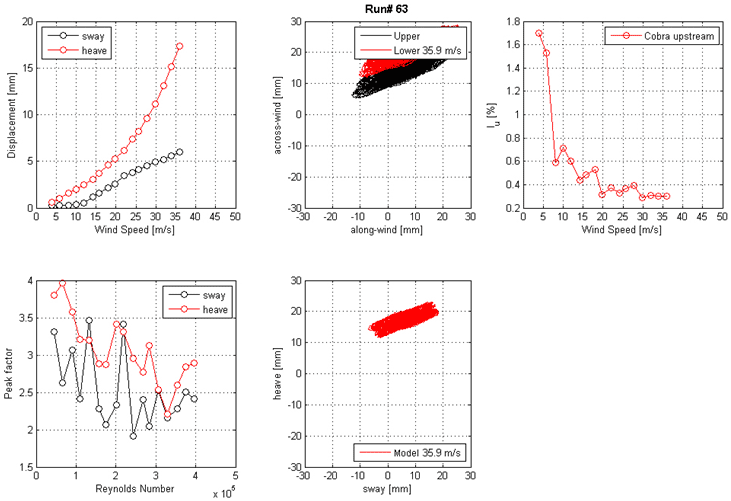
These five graphs show the run 63 mean displacement and peak factor from the laser, motion path at one wind speed, and intensity of turbulence measured at the entrance of the test section. The top left graph shows displacement on the y-axis from 0 to 20 mm and wind speed on the x-axis from 0 to 50 m/s for sway and heave. The top middle graph shows the motion path in the along-wind direction on the x-axis from -30 to 30 mm and the across-wind direction on the y-axis from -30 to 30 mm for the top and bottom ends of the cable model at a specific wind speed. The top right graph shows the turbulence intensity in the along-wind direction measured by the Cobra Probe upstream of the cable model. Turbulence intensity is on the y-axis from 0.2 to 1.8 percent, and wind speed is on the x-axis from 0 to 50 m/s. The bottom left graph shows the peak factor on the y-axis from 1.5 to 4 and Reynolds number on the x-axis from 0 to 5x10(to the 5th) for sway and heave. The bottom middle graph shows the motion path in sway on the x-axis from -30 to 30 mm and heave on the y-axis from -30 to 30 mm for the top and bottom ends of the cable model at a specific wind speed.
Figure 81. Graph. Mean displacement and peak factor from the laser, motion path at one wind speed, and intensity of turbulence measured at the entrance of the test section for run 63.


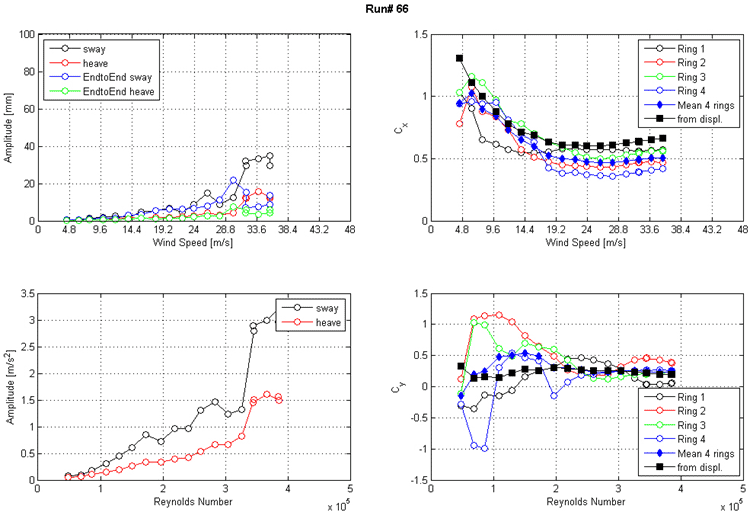
These four graphs show the run 66 response of the cable as a function of wind speed or Reynolds number as measured by the lasers, accelerometers, and surface pressures. The top left graph shows the displacement amplitude on the y-axis from 0 to 100 mm and wind speed on the x-axis from 0 to 48 m/s for sway, heave, end-to-end sway, and end-to-end heave. The top right graph shows the along-wind force coefficient (Cx) on the y-axis from 0 to 1.5 and wind speed on the x-axis from 0 to 48 m/s. The four rings of pressure taps, the mean of four rings, and the coefficient derived from displacement are plotted as separate curves.The bottom left graph shows the acceleration amplitude on the y-axis from 0 to 3.5 m/s2 and Reynolds number on the x-axis from 0 to 5x10(to the 5th) for sway and heave. The bottom right graph shows the across-wind force coefficient (Cy) on the y-axis from -1.5 to 1.5 and Reynolds number on the x-axis from 0 to 5x10(to the 5th). The four rings of pressure taps, the mean of four rings, and the coefficient derived from displacement are plotted as separate curves.
Figure 82. Graph. Response of the cable as a function of wind speed or Reynolds number as measured by the lasers, the accelerometers, and surface pressures for run 66.


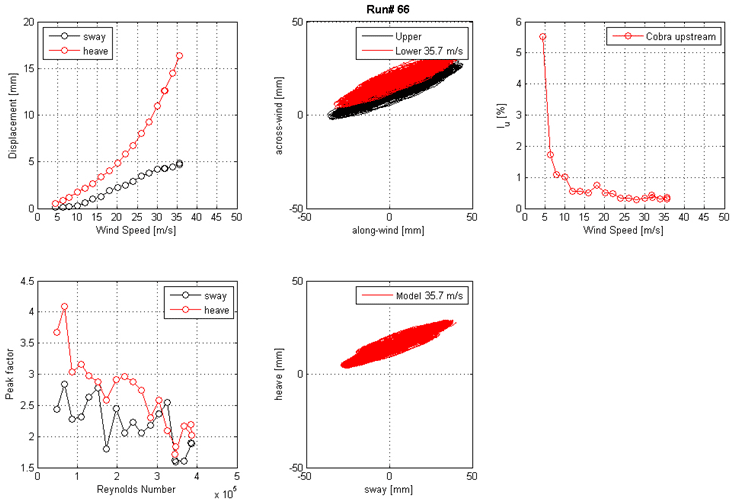
These five graphs show the run 66 mean displacement and peak factor from the laser, motion path at one wind speed, and intensity of turbulence measured at the entrance of the test section. The top left graph shows displacement on the y-axis from 0 to 20 mm and wind speed on the x-axis from 0 to 50 m/s for sway and heave. The top middle graph shows the motion path in the along-wind direction on the x-axis from -50 to 50 mm and the across-wind direction on the y-axis from -50 to 50 mm for the top and bottom ends of the cable model at a specific wind speed. The top right graph shows the turbulence intensity in the along-wind direction measured by the Cobra Probe upstream of the cable model. Turbulence intensity is on the y-axis from 0 to 6 percent, and wind speed is on the x-axis from 0 to 50 m/s. The bottom left graph shows the peak factor on the y-axis from 1.5 to 4.5 and Reynolds number on the x-axis from 0 to 5x10(to the 5th) for sway and heave. The bottom middle graph shows the motion path in sway on the x-axis from -50 to 50 mm and heave on the y-axis from -50 to 50 mm for the top and bottom ends of the cable model at a specific wind speed.
Figure 83. Graph. Mean displacement and peak factor from the laser, motion path at one wind speed, and intensity of turbulence measured at the entrance of the test section for run 66.


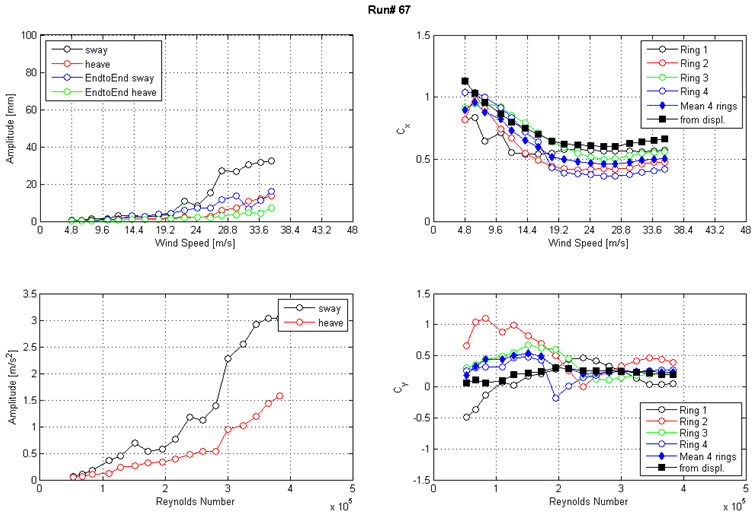
These four graphs show the run 67 response of the cable as a function of wind speed or Reynolds number as measured by the lasers, accelerometers, and surface pressures. The top left graph shows the displacement amplitude on the y-axis from 0 to 100 mm and wind speed on the x-axis from 0 to 48 ms/ for sway, heave, end-to-end sway, and end-to-end heave. The top right graph shows the along-wind force coefficient (Cx) on the y-axis from 0 to 1.5 and wind speed on the x-axis from 0 to 48 m/s. The four rings of pressure taps, the mean of four rings, and the coefficient derived from displacement are plotted as separate curves. The bottom left graph shows the acceleration amplitude on the y-axis from 0 to 3.5 m/s2 and Reynolds number on the x-axis from 0 to 5x10(to the 5th) for sway and heave. The bottom right graph shows the across-wind force coefficient (Cy) on the y-axis from -1.5 to 1.5 and Reynolds number on the x-axis from 0 to 5x10. The four rings of pressure taps, the mean of four rings, and the coefficient derived from displacement are plotted as separate curves.
Figure 84 Graph. Response of the cable as a function of wind speed or Reynolds number as measured by the lasers, the accelerometers, and surface pressures for run 67.


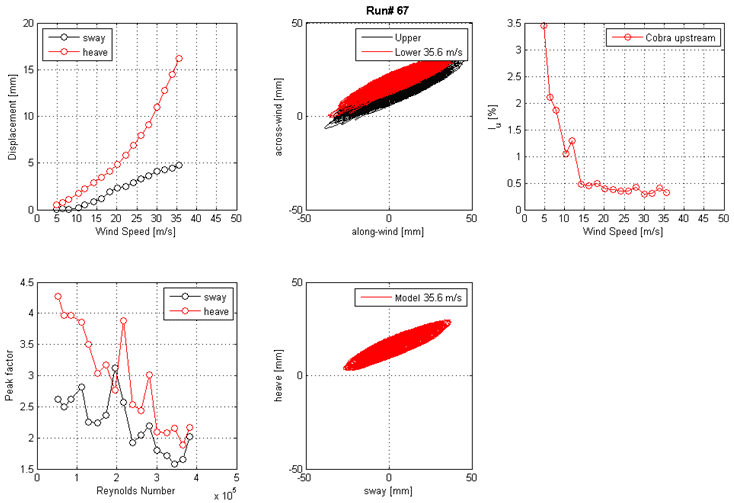
These five graphs show the run 67 mean displacement and peak factor from the laser, motion path at one wind speed, and intensity of turbulence measured at the entrance of the test section. The top left graph shows displacement on the y-axis from 0 to 20 mm and wind speed on the x-axis from 0 to 50 m/s for sway and heave. The top middle graph shows the motion path in the along-wind direction on the x-axis from -50 to 50 mm and the across-wind direction on the y-axis from -50 to 50 mm for the top and bottom ends of the cable model at a specific wind speed. The top right graph shows the turbulence intensity in the along-wind direction measured by the Cobra Probe upstream of the cable model. Turbulence intensity is on the y-axis from 0 to 3.5 percent, and wind speed is on the x-axis from 0 to 50 m/s. The bottom left graph shows the peak factor on the y-axis from 1.5 to 4.5 and Reynolds number on the x-axis from 0 to 5x10(to the 5th) for sway and heave. The bottom middle graph shows the motion path in sway on the x-axis from -50 to 50 mm and heave on the y-axis from -50 to 50 mm for the top and bottom ends of the cable model at a specific wind speed.
Figure 85. Graph. Mean displacement and peak factor from the laser, motion path at one wind speed, and intensity of turbulence measured at the entrance of the test section for run 67.


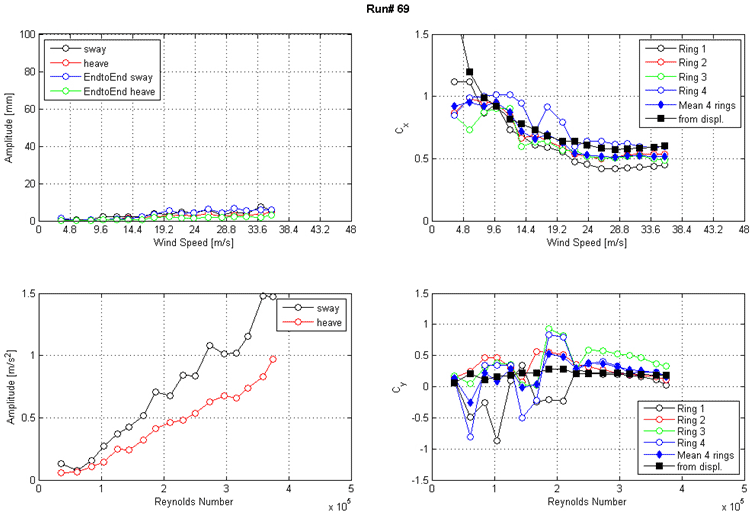
These four graphs show the run 69 response of the cable as a function of wind speed or Reynolds number as measured by the lasers, accelerometers, and surface pressures. The top left graph shows the displacement amplitude on the y-axis from 0 to 100 mm and wind speed on the x-axis from 0 to 48 m/s for sway, heave, end-to-end sway, and end-to-end heave. The top right graph shows the along-wind force coefficient (Cx) on the y-axis from 0 to 1.5 and wind speed on the x-axis from 0 to 48 m/s. The four rings of pressure taps, the mean of four rings, and the coefficient derived from displacement are plotted as separate curves. The bottom left graph shows the acceleration amplitude on the y-axis from 0 to 1.5 m/s2 and Reynolds number on the x-axis from 0 to 5x10(to the 5th) for sway and heave. The bottom right graph shows the across-wind force coefficient (Cy) on the y-axis from -1.5 to 1.5 and Reynolds number on the x-axis from 0 to 5x10(to the 5th). The four rings of pressure taps, the mean of four rings, and the coefficient derived from displacement are plotted as separate curves.
Figure 86. Graph. Response of the cable as a function of wind speed or Reynolds number as measured by the lasers, accelerometers, and surface pressures for run 69.


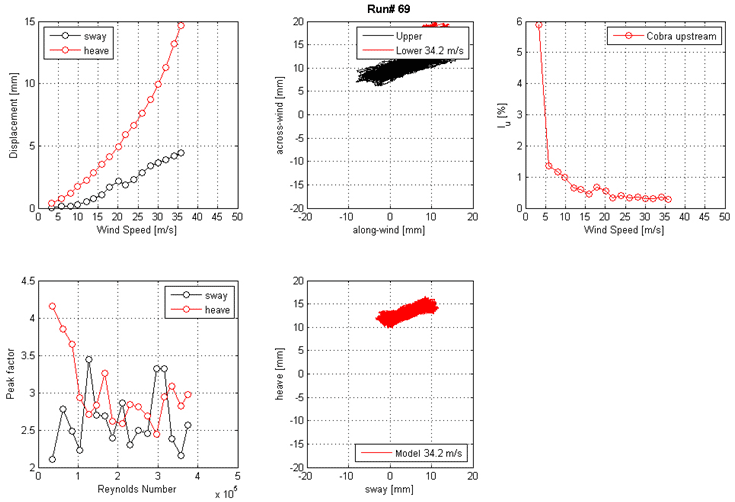
These five graphs show the run 69 mean displacement and peak factor from the laser, motion path at one wind speed, and intensity of turbulence measured at the entrance of the test section. The top left graph shows displacement on the y-axis from 0 to 15 mm and wind speed on the x-axis from 0 to 50 m/s for sway and heave. The top middle graph shows the motion path in the along-wind direction on the x-axis from -20 to 20 mm and in the across-wind direction on the y-axis from -20 to 20 mm for the top and bottom ends of the cable model at a specific wind speed. The top right graph shows the turbulence intensity in the along-wind direction measured by the Cobra Probe upstream of the cable model. Turbulence intensity is on the y-axis from 0 to 6 percent, and wind speed is on the x-axis from 0 to 50 m/s. The bottom left graph shows the peak factor on the y-axis from 2 to 4.5 and Reynolds number on the x-axis from 0 to 5x10(to the 5th) for sway and heave. The bottom middle graph shows the motion path in sway on the x-axis from -20 to 20 mm and heave on the y-axis from -20 to 20 mm for the top end and bottom end of the cable model at a specific wind speed.
Figure 87. Graph. Mean displacement and peak factor from the laser, motion path at one wind speed, and intensity of turbulence measured at the entrance of the test section for run 69.


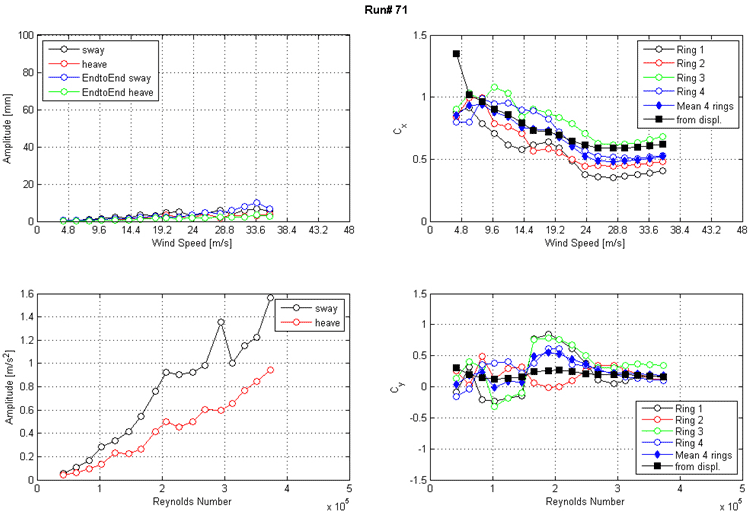
These four graphs show the run 71 response of the cable as a function of wind speed or Reynolds number as measured by the lasers, accelerometers, and surface pressures. The top left graph shows the displacement amplitude on the y-axis from 0 to 100 mm and wind speed on the x-axis from 0 to 48 m/s for sway, heave, end-to-end sway, and end-to-end heave. The top right graph shows the along-wind force coefficient (Cx) on the y-axis from 0 to 1.5 and wind speed on the x-axis from 0 to 48 m/s. The four rings of pressure taps, the mean of four rings, and the coefficient derived from displacement are plotted as separate curves. The bottom left graph shows the acceleration amplitude on the y-axis from 0 to 1.6 m/s2 and Reynolds number on the x-axis from 0 to 5x10(to the 5th) for sway and heave. The bottom right graph shows the across-wind force coefficient (Cy) on the y-axis from -1.5 to 1.5 and Reynolds number on the x-axis from 0 to 5x10(to the 5th). The four rings of pressure taps, the mean of four rings, and the coefficient derived from displacement are plotted as separate curves.
Figure 88. Graph. Response of the cable as a function of wind speed or Reynolds number as measured by the lasers, the accelerometers, and surface pressures for run 71.


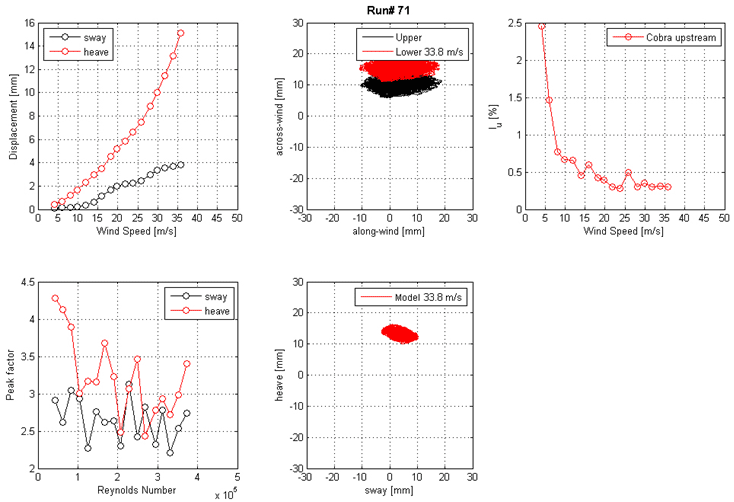
These five graphs show the run 71 mean displacement and peak factor from the laser, motion path at one wind speed, and intensity of turbulence measured at the entrance of the test section. The top left graph shows displacement on the y-axis from 0 to 16 mm and wind speed on the x-axis from 0 to 50 m/s for sway and heave. The top middle graph shows the motion path in the along-wind direction on the x-axis from -30 to 30 mm and in the across-wind direction on the y-axis from -30 to 30 mm for the top and bottom ends of the cable model at a specific wind speed. The top right graph shows the turbulence intensity in the along-wind direction measured by the Cobra Probe upstream of the cable model. Turbulence intensity is on the y-axis from 0 to 2.5 percent, and wind speed is on the x-axis from 0 to 50 m/s. The bottom left graph shows the peak factor on the y-axis from 2 to 4.5 and Reynolds number on the x-axis from 0 to 5x10(to the 5th) for sway and heave. The bottom middle graph shows the motion path in sway on the x-axis from -30 to 30 mm and heave on the y-axis from -30 to 30 mm for the top and bottom ends of the cable model at a specific wind speed.
Figure 89. Graph. Mean displacement and peak factor from the laser, motion path at one wind speed, and intensity of turbulence measured at the entrance of the test section for run 71.


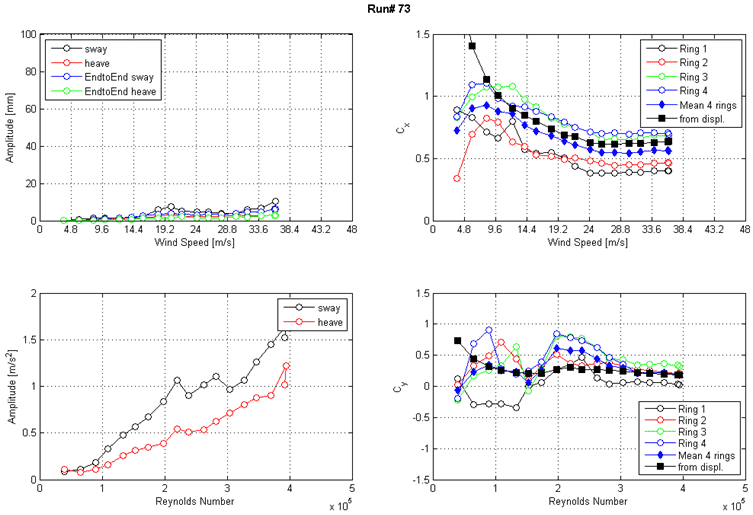
These four graphs show the run 73 response of the cable as a function of wind speed or Reynolds number as measured by the lasers, accelerometers, and surface pressures. The top left graph shows the displacement amplitude on the y-axis from 0 to 100 mm and wind speed on the x-axis from 0 to 48 m/s for sway, heave, end-to-end sway, and end-to-end heave. The top right graph shows the along-wind force coefficient (Cx) on the y-axis from 0 to 1.5 and wind speed on the x-axis from 0 to 48 m/s. The four rings of pressure taps, the mean of four rings, and the coefficient derived from displacement are plotted as separate curves. The bottom left graph shows the acceleration amplitude on the y-axis from 0 to 2 m/s2 and Reynolds number on the x-axis from 0 to 5x10(to the 5th) for sway and heave. The bottom right graph shows the across-wind force coefficient (Cy) on the y-axis from -1.5 to 1.5 and Reynolds number on the x-axis from 0 to 5x10(to the 5th). The four rings of pressure taps, the mean of four rings, and the coefficient derived from displacement are plotted as separate curves.
Figure 90. Graph. Response of the cable as a function of wind speed or Reynolds number as measured by the lasers, the accelerometers, and surface pressures for run 73.


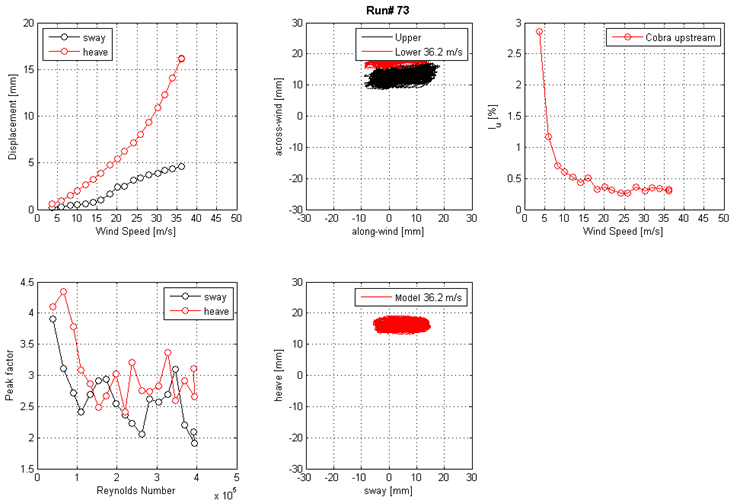
These graphs show the run 73 mean displacement and peak factor from the laser, motion path at one wind speed, and intensity of turbulence measured at the entrance of the test section. The top left graph shows displacement on the y-axis from 0 to 20 mm and wind speed on the x-axis from 0 to 50 m/s for sway and heave. The top middle graph shows the motion path in the along-wind direction on the x-axis from -30 to 30 mm and in the across-wind direction on the y-axis from -30 to 30 mm for the top and bottom ends of the cable model at a specific wind speed. The top right graph shows the turbulence intensity in the along-wind direction measured by the Cobra Probe upstream of the cable model. Turbulence intensity is on the y-axis from 0 to 3 percent, and wind speed is on the x-axis from 0 to 50 m/s. The bottom left graph shows the peak factor on the y-axis from 1.5 to 4.5 and Reynolds number on the x-axis from 0 to 5x10(to the 5th) for sway and heave. The bottom middle graph shows the motion path in sway on the x-axis and heave on the y-axis for the top and bottom ends of the cable model at a specific wind speed.
Figure 91. Graph. Mean displacement and peak factor from the laser, motion path at one wind speed, and intensity of turbulence measured at the entrance of the test section for run 73.


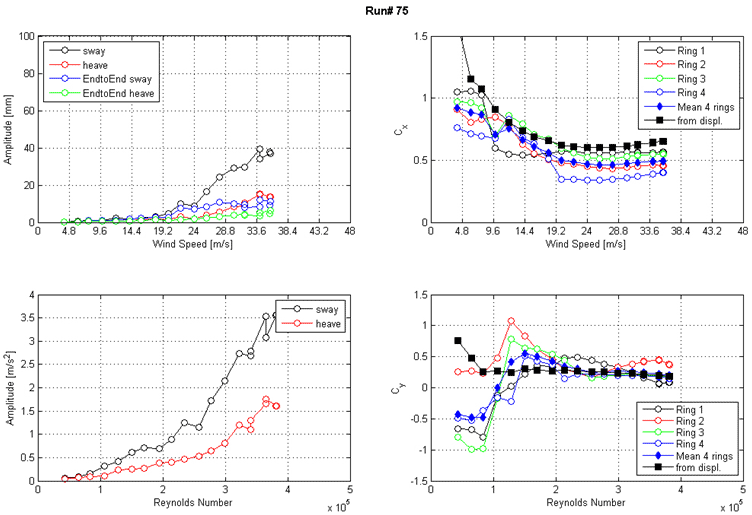
These four graphs show the run 75 response of the cable as a function of wind speed or Reynolds number as measured by the lasers, accelerometers, and surface pressures. The top left graph shows the displacement amplitude on the y-axis from 0 to 100 mm and wind speed on the x-axis from 0 to 48 m/s for sway, heave, end-to-end sway, and end-to-end heave. The top right graph shows the along-wind force coefficient (Cx) on the y-axis from 0 to 1.5 and wind speed on the x-axis from 0 to 48 m/s. The four rings of pressure taps, the mean of four rings, and the coefficient derived from displacement are plotted as separate curves.The bottom left graph shows the acceleration amplitude on the y-axis from 0 to 4 m/s2 and Reynolds number on the x-axis from 0 to 5x10(to the 5th) for sway and heave. The bottom right graph shows the across-wind force coefficient (Cy) on the y-axis from -1.5 to 1.5 and Reynolds number on the x-axis from 0 to 5x10(to the 5th). The four rings of pressure taps, the mean of four rings, and the coefficient derived from displacement are plotted as separate curves.
Figure 92. Graph. Response of the cable as a function of wind speed or Reynolds number as measured by the lasers, the accelerometers, and surface pressures for run 75.


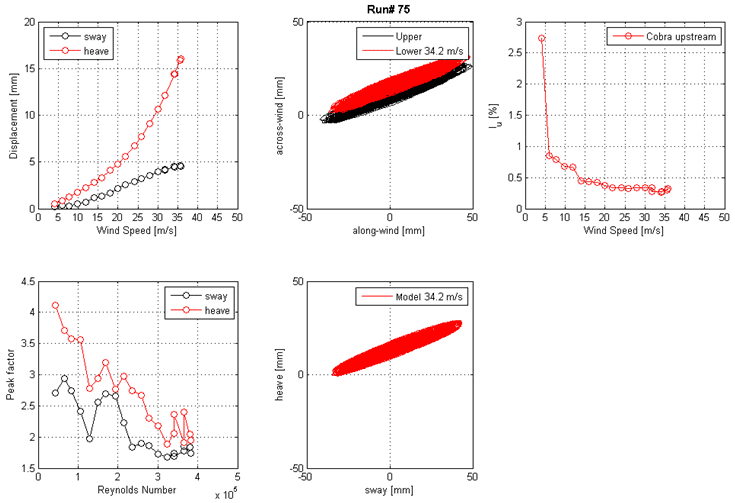
These five graphs show the run 75 mean displacement and peak factor from the laser, motion path at one wind speed, and intensity of turbulence measured at the entrance of the test section. The top left graph shows displacement on the y-axis from 0 to 20 mm and wind speed on the y-axis from 0 to 50 m/s for sway and heave. The top middle graph shows the motion path in the along-wind direction on the x-axis from -50 to 50 mm and the across-wind direction on the y-axis from -50 to 50 mm for the top and bottom ends of the cable model at a specific wind speed. The top right graph shows the turbulence intensity in the along-wind direction measured by the Cobra Probe upstream of the cable model. Turbulence intensity is on the y-axis from 0 to 3 percent, and wind speed is on the x-axis from 0 to 50 m/s. The bottom left graph shows the peak factor on the y-axis from 1.5 to 4.5 and Reynolds number on the x-axis from 0 to 5x10(to the 5th) for sway and heave.The bottom middle graph shows the motion path in sway on the x-axis from -50 to 50 mm and heave on the y-axis from -50 to 50 mm for the top and bottom ends of the cable model at a specific wind speed.
Figure 93. Graph. Mean displacement and peak factor from the laser, motion path at one wind speed, and intensity of turbulence measured at the entrance of the test section for run 75.


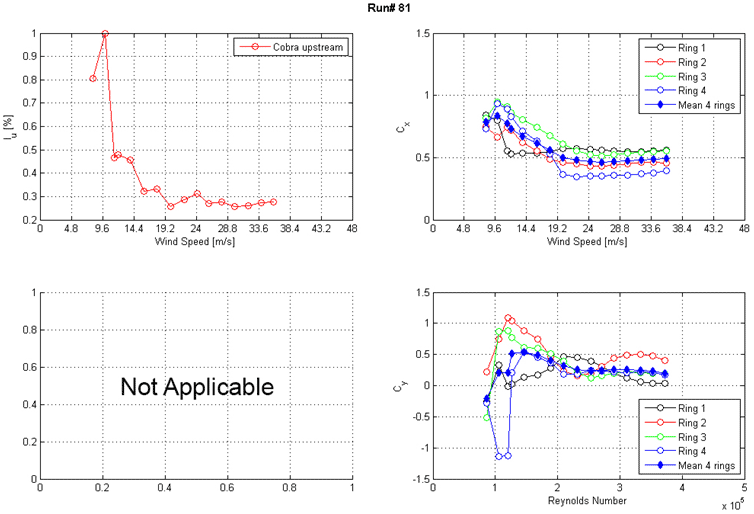
These three graphs show the run 81 intensity of turbulence measured at the entrance of the test section and along-wind and across-wind mean force coefficients (Cx and Cy) calculated from surface pressure measurements as a function of Reynolds number and wind speed. The top left graph shows the turbulence intensity in the along-wind direction measured at the entrance of the test section. Turbulence intensity is on the y-axis from 0.2 to 1 percent, and wind speed is on the x-axis from 0 to 48 m/s. The top right graph shows Cx on the y-axis from 0 to 1.5 and wind speed on the x-axis from 0 to 48 m/s. Results from the four rings of pressure taps and the mean of four rings are plotted as separate curves. The bottom right graph shows Cy on the y-axis from -1.5 to 1.5 and Reynolds number on the x-axis from 0 to 5x10(to the 5th). Results from the four rings of pressure taps and the mean of four rings are plotted as separate curves.
Figure 94. Graph. Intensity of turbulence measured at the entrance of the test section and Cx and Cy calculated from surface pressure measurements as a function of Reynolds number and wind speed for run 81.


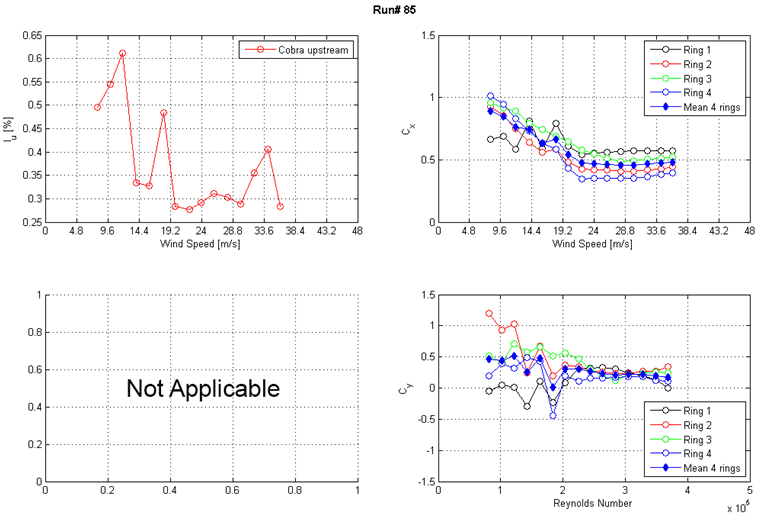
These three graphs show the run 85 intensity of turbulence measured at the entrance of the test section and along-wind and across-wind mean force coefficients (Cx and Cy) calculated from surface pressure measurements as a function of Reynolds number and wind speed. The top left graph shows the turbulence intensity in the along-wind direction measured at the entrance of the test section. Turbulence instensity is on the y-axis from 0.25 to 0.65 percent, and wind speed is on the x-axis from 0 to 48 m/s. The top right graph shows Cx on the y-axis from 0 to 1.5 and wind speed on the x-axis from 0 to 48 m/s. Results from the four rings of pressure taps and the mean of four rings are plotted as separate curves. The bottom right graph shows Cy on the y-axis from -1.5 to 1.5 and Reynolds number on the x-axis from 0 to 5x10(to the 5th). Results from the four rings of pressure taps and the mean of four rings are plotted as separate curves.
Figure 95. Graph. Intensity of turbulence measured at the entrance of the test section and Cx and Cy calculated from surface pressure measurements as a function of Reynolds number and wind speed for run 85.


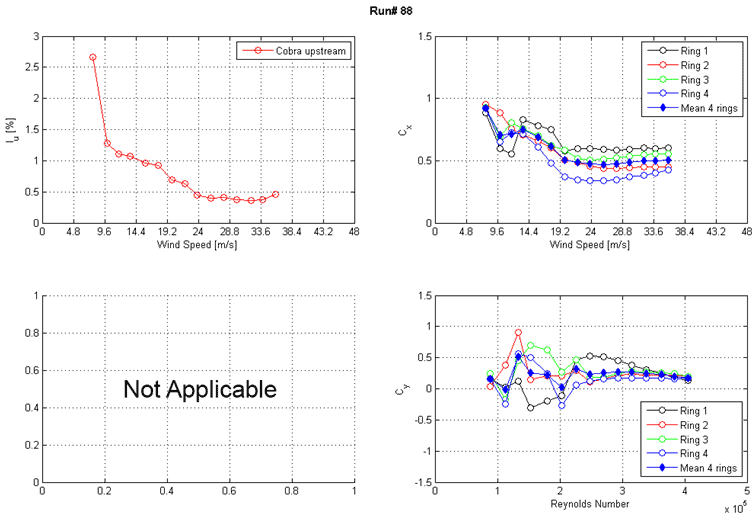
These three graphs show the run 88 intensity of turbulence measured at the entrance of the test section and along-wind and across-wind mean force coefficients (Cx and Cy) calculated from surface pressure measurements as a function of Reynolds number and wind speed. The top left graph shows the turbulence intensity in the along-wind direction measured at the entrance of the test section. Turbulence instensity is on the y-axis from 0 to 3 percent, and wind speed is on the x-axis from 0 to 48 m/s. The top right graph shows Cx on the y-axis from 0 to 1.5 and wind speed on the x-axis from 0 to 48 m/s. Results from the four rings of pressure taps and the mean of four rings are plotted as separate curves. The bottom right graph shows Cy on the y-axis from -1.5 to 1.5 and Reynolds number on the x-axis from 0 to 5x10(to the 5th). Results from the four rings of pressure taps and the mean of four rings are plotted as separate curves.
Figure 96. Graph. Intensity of turbulence measured at the entrance of the test section and Cx and Cy calculated from surface pressure measurements as a function of Reynolds number and wind speed for run 88.


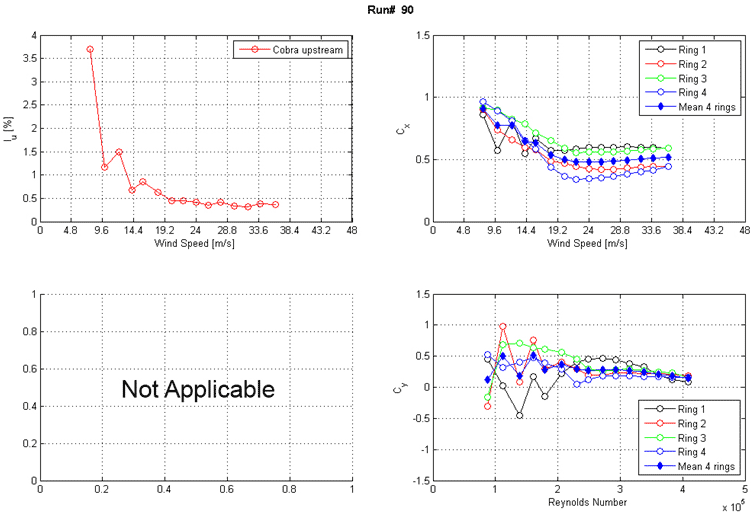
These three graphs show the run 90 intensity of turbulence measured at the entrance of the test section and along-wind and across-wind mean force coefficients (Cx and Cy) calculated from surface pressure measurements as a function of Reynolds number and wind speed. The top left graph shows the turbulence intensity in the along-wind direction measured at the entrance of the test section. Turbulence intensity is on the y-axis from 0 to 4 percent, and wind speed is on the x-axis from 0 to 48 m/s. The top right graph shows Cx on the y-axis from 0 to 1.5 and wind speed on the x-axis from 0 to 48 m/s. Results from the four rings of pressure taps and the mean of four rings are plotted as separate curves. The bottom right graph shows Cy on the y-axis from -1.5 to 1.5 and Reynolds number on the x-axis from 0 to 5x10(to the 5th). Results from the four rings of pressure taps and the mean of four rings are plotted as separate curves.
Figure 97. Graph. Intensity of turbulence measured at the entrance of the test section and Cx and Cy calculated from surface pressure measurements as a function of Reynolds number and wind speed for run 90.


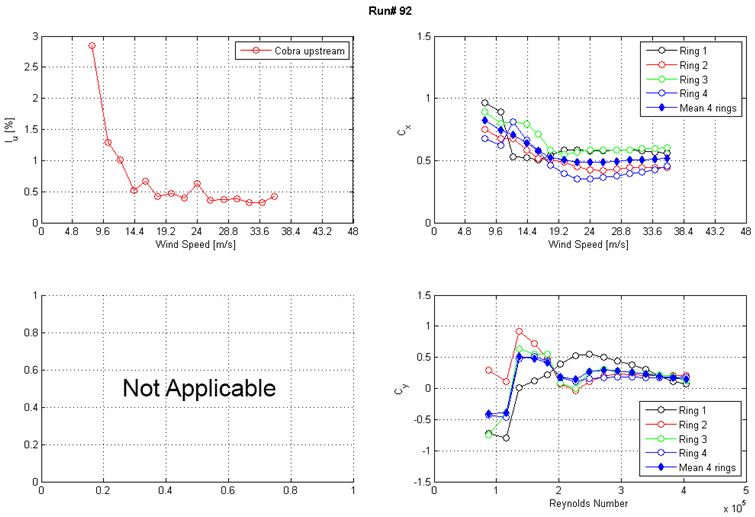
These three graphs show the run 92 intensity of turbulence measured at the entrance of the test section and mean force coefficients (Cx and Cy) calculated from surface pressure measurements as a function of Reynolds number and wind speed. The top left graph shows the turbulence intensity in the along-wind direction measured at the entrance of the test section. Turbulence instensity is on the y-axis from 0 to 3 percent, and wind speed is on the x-axis from 0 to 48 m/s. The top right graph shows Cx on the y-axis from 0 to 1.5 and wind speed on the x-axis from 0 to 48 m/s. Results from the four rings of pressure taps and the mean of four rings are plotted as separate curves. The bottom right graph shows Cy on the y-axis from -1.5 to 1.5 and Reynolds number on the x-axis from 0 to 5x10(to the 5th). Results from the four rings of pressure taps and the mean of four rings are plotted as separate curves.
Figure 98. Graph. Intensity of turbulence measured at the entrance of the test section and Cx and Cy calculated from surface pressure measurements as a function of Reynolds number and wind speed for run 92.


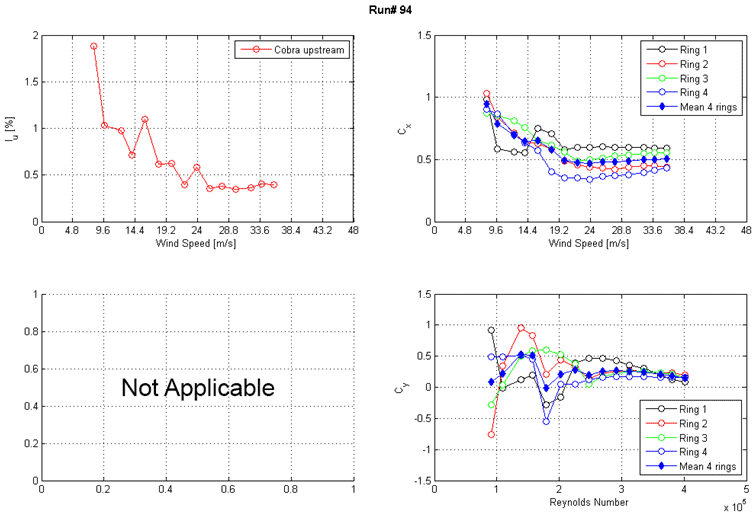
These three graphs show the run 94 intensity of turbulence measured at the entrance of the test section and along-wind and across-wind mean force coefficients (Cx and Cy) calculated from surface pressure measurements as a function of Reynolds number and wind speed. The top left graph shows the turbulence intensity in the along-wind direction measured at the entrance of the test section. Turbulence intensity is on the y-axis from 0 to 2 percent, and wind speed is on the x-axis from 0 to 48 m/s. The top right graph shows Cx on the y-axis from 0 to 1.5 and wind speed on the x-axis from 0 to 48 m/s. Results from the four rings of pressure taps and the mean of four rings are plotted as separate curves. The bottom right graph shows Cy on the y-axis from -1.5 to 1.5 and Reynolds number on the x-axis from 0 to 5x10(to the 5th). Results from the four rings of pressure taps and the mean of four rings are plotted as separate curves.
Figure 99. Graph. Intensity of turbulence measured at the entrance of the test section and Cx and Cy calculated from surface pressure measurements as a function of Reynolds number and wind speed for run 94.


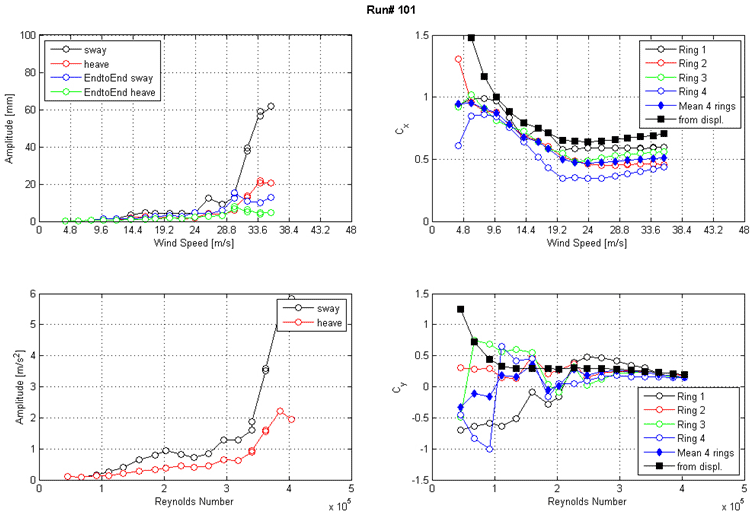
These four graphs show the run 101 response of the cable as a function of wind speed or Reynolds number as measured by the lasers, accelerometers, and surface pressures. The top left graph shows the displacement amplitude on the y-axis from 0 to 100 mm and wind speed on the x-axis from 0 to 48 m/s for sway, heave, end-to-end sway, and end-to-end heave. The top right graph shows the along-wind force coefficient (Cx) on the y-axis from 0 to 1.5 and wind speed on the x-axis from 0 to 48 m/s. The four rings of pressure taps, the mean of four rings, and the coefficient derived from displacement are plotted as separate curves. The bottom left graph shows the acceleration amplitude on the y-axis from 0 to 6 m/s2 and Reynolds number on the x-axis from 0 to 5x10(to the 5th) for sway and heave. The bottom right graph shows the across-wind force coefficient (Cy) on the y-axis from -1.5 to 1.5 and Reynolds number on the x-axis from 0 to 5x10(to the 5th). The four rings of pressure taps, the mean of four rings, and the coefficient derived from displacement are plotted as separate curves.
Figure 100. Graph. Response of the cable as a function of wind speed or Reynolds number as measured by the lasers, accelerometers, and surface pressures for run 101.


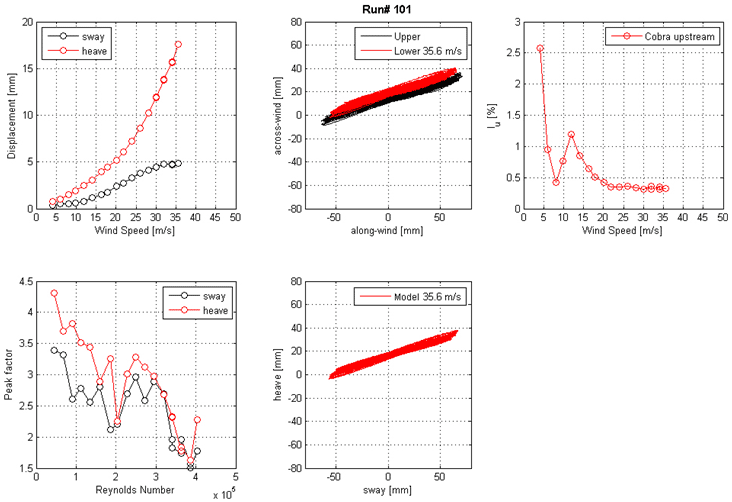
These five graphs show the run 101 mean displacement and peak factor from the laser, motion path at one wind speed, and intensity of turbulence measured at the entrance of the test section. The top left graph shows displacement on the y-axis from 0 to 20 mm and wind speed on the x-axis from 0 to 50 m/s for sway and heave. The top middle graph shows the motion path in the along-wind direction on the x-axis from -50 to 50 mm and in the across-wind direction on the y-axis from -80 to 80 mm for the top and bottom ends of the cable model at a specific wind speed. The top right graph shows the turbulence intensity in the along-wind direction measured by the Cobra Probe upstream of the cable model. Turbulence intensity is on the y-axis from 0 to 3 percent, and wind speed is on the x-axis from 0 to 50 m/s. The bottom left graph shows the peak factor on the y-axis from 1.5 to 45 and Reynolds number on the x-axis from 0 to 5x10(to the 5th) for sway and heave. The bottom middle graph shows the motion path in sway on the x-axis from -50 to 50 mm and heave on the y-axis from -80 to 80 mm for the top and bottom ends of the cable model at a specific wind speed.
Figure 101. Graph. Mean displacement and peak factor from the laser, motion path at one wind speed, and intensity of turbulence measured at the entrance of the test section for run 101.


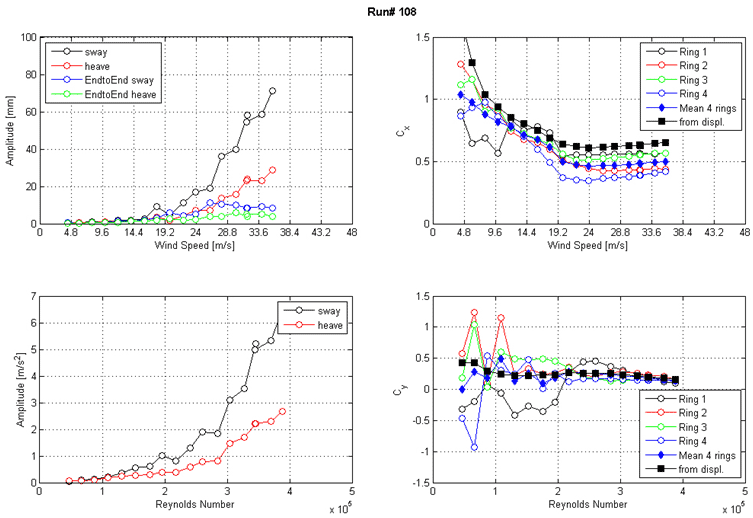
These four graphs show the run 108 response of the cable as a function of wind speed or Reynolds number as measured by the lasers, accelerometers, and surface pressures. The top left graph shows the displacement amplitude on the y-axis from 0 to 100 mm and wind speed on the x-axis from 0 to 48 m/s for sway, heave, end-to-end sway, and end-to-end heave. The top right graph shows the along-wind force coefficient (Cx) on the y-axis from 0 to 1.5 and wind speed on the x-axis from 0 to 48 m/s. The four rings of pressure taps, the mean of four rings, and the coefficient derived from displacement are plotted as separate curves. The bottom left graph shows the acceleration amplitude on the y-axis from 0 to 7 m/s2 and Reynolds number on the x-axis from 0 to 5x10(to the 5th) for sway and heave. The bottom right graph shows the across-wind force coefficient (Cy) on the y-axis from -1.5 to 1.5 and Reynolds number on the x-axis from 0 to 5x10(to the 5th). The four rings of pressure taps, the mean of four rings, and the coefficient derived from displacement are plotted as separate curves.
Figure 102. Graph. Response of the cable as a function of wind speed or Reynolds number as measured by the lasers, accelerometers, and surface pressures for run 108.


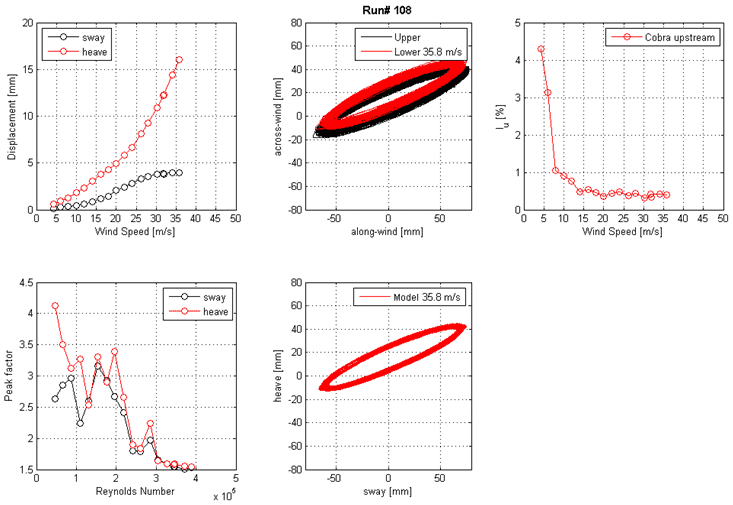
These five graphs show the run 108 mean displacement and peak factor from the laser, motion path at one wind speed, and intensity of turbulence measured at the entrance of the test section. The top left graph shows displacement on the y-axis from 0 to 20 mm and wind speed on the x-axis from 0 to 50 m/s for sway and heave. The top middle graph shows the motion path in the along-wind direction on the x-axis from -50 to 50 mm and the across-wind direction on the y-axis from -80 to 80 mm for the top and bottom ends of the cable model at a specific wind speed. The top right graph shows the turbulence intensity in the along-wind direction measured by the Cobra Probe upstream of the cable model. Turbulence intensity is on the y-axis from 0 to 5 percent, and wind speed is on the x-axis from 0 to 50 m/s. The bottom left graph shows the peak factor on the y-axis from 1.5 to 4.5 and Reynolds number on the x-axis from 0 to 5x10(to the 5th) for sway and heave. The bottom middle graph shows the motion path in sway on the x-axis from -50 to 50 mm and heave on the y-axis from -80 to 80 mm for the top and bottom ends of the cable model at a specific wind speed.
Figure 103. Graph. Mean displacement and peak factor from the laser, motion path at one wind speed, and intensity of turbulence measured at the entrance of the test section for run 108.


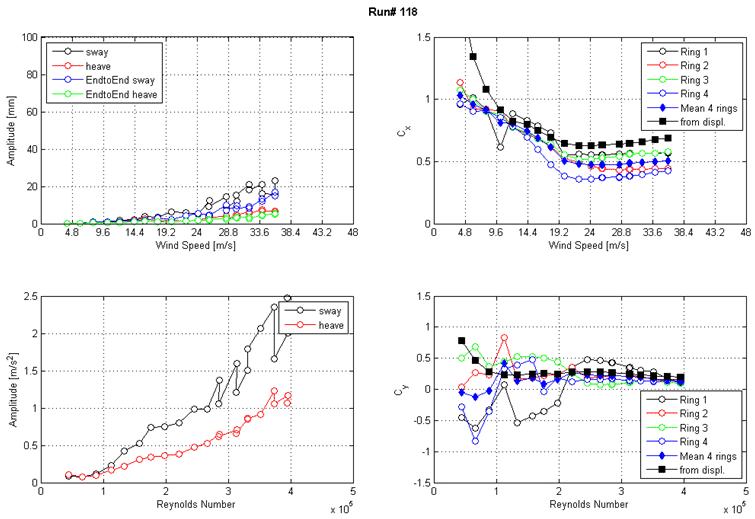
These four graphs show the run 118 response of the cable as a function of wind speed or Reynolds number as measured by the lasers, accelerometers, and surface pressures. The top left graph shows the displacement amplitude on the y-axis from 0 to 100 mm and wind speed on the x-axis from 0 to 48 m/s for sway, heave, end-to-end sway, and end-to-end heave. The top right graph shows the along-wind force coefficient (Cx) on the y-axis from 0 to 1.5 and wind speed on the x-axis from 0 to 48 m/s. The four rings of pressure taps, the mean of four rings, and the coefficient derived from displacement are plotted as separate curves. The bottom left graph shows the acceleration amplitude on the y-axis from 0 to 2.5 m/s2 and Reynolds number on the x-axis from 0 to 5x10(to the 5th) for sway and heave. The bottom right graph shows the across-wind force coefficient (Cy) on the y-axis from -1.5 to 1.5 and Reynolds number on the x-axis from 0 to 5x10(to the 5th). The four rings of pressure taps, the mean of four rings, and the coefficient derived from displacement are plotted as separate curves.
Figure 104. Graph. Response of the cable as a function of wind speed or Reynolds number as measured by the lasers, accelerometers, and surface pressures for run 118.


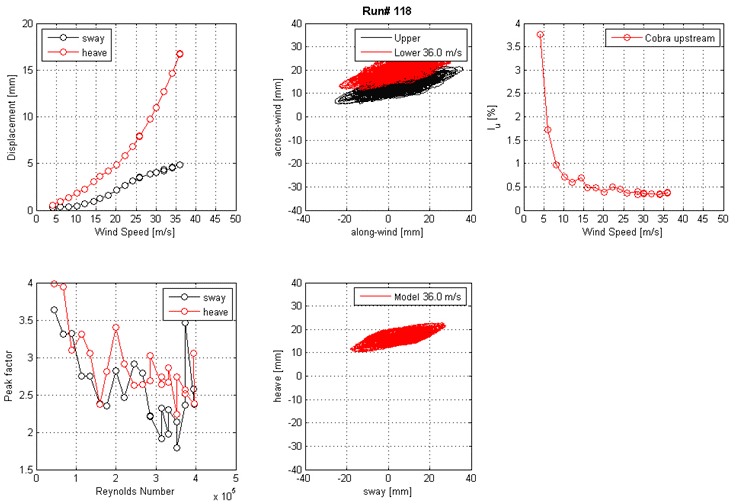
These five graphs show the run 118 mean displacement and peak factor from laser, motion path at one wind speed, and intensity of turbulence measured at the entrance of the test section. The top left graph shows displacement on the y-axis from 0 to 20 mm and wind speed on the x-axis from 0 to 50 m/s for sway and heave. The top middle graph shows the motion path in the along-wind direction on the x-axis from -40 to 40 mm and in the across-wind direction on the y-axis from -40 to 40 mm for the top and bottom ends of the cable model at a specific wind speed. The top right graph shows the turbulence intensity in the along-wind direction measured by the Cobra Probe upstream of the cable model. Turbulence intensity is on the y-axis from 0 to 4 percent, and wind speed is on the x-axis from 0 to 50 m/s. The bottom left graph shows the peak factor on the y-axis from 1.5 to 4 and Reynolds number on the x-axis from 0 to 5x10(to the 5th) for sway and heave. The bottom middle graph shows the motion path in sway on the x-axis from -40 to 40 mm and heave on the y-axis from -40 to 40 mm for the top and bottom ends of the cable model at a specific wind speed.
Figure 105. Graph. Mean displacement and peak factor from the laser, motion path at one wind speed, and intensity of turbulence measured at the entrance of the test section for run 118.


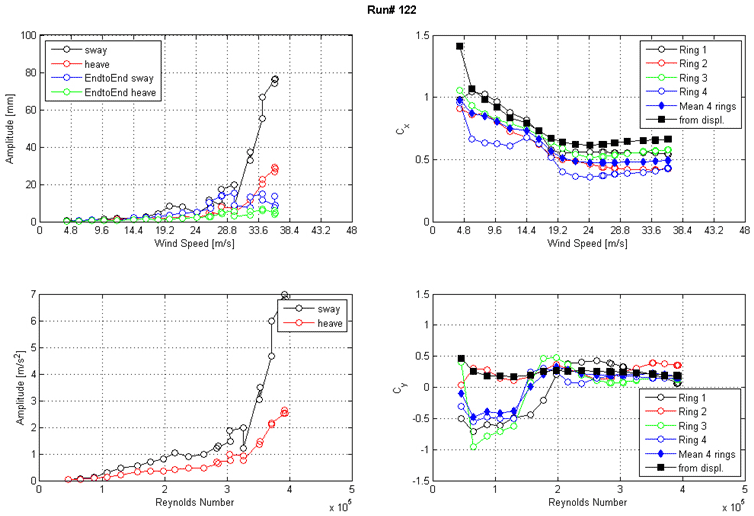
These four graphs show the run 122 response of the cable as a function of wind speed or Reynolds number as measured by the lasers, accelerometers, and surface pressures. The top left graph shows the displacement amplitude on the y-axis from 0 to 100 mm and wind speed on the x-axis from 0 to 48 m/s for sway, heave, end-to-end sway, and end-to-end heave. The top right graph shows the along-wind force coefficient (Cx) on the y-axis from 0 to 1.5 and wind speed on the x-axis from 0 to 48 m/s. The four rings of pressure taps, the mean of four rings, and the coefficient derived from displacement are plotted as separate curves. The bottom left graph shows the acceleration amplitude on the y-axis from 0 to 7 m/s2 and Reynolds number on the x-axis from 0 to 5x10(to the 5th) for sway and heave. The bottom right graph shows the across-wind force coefficient (Cy) on the y-axis from -1.5 to 1.5 and Reynolds number on the x-axis from 0 to 5x10(to the 5th). The four rings of pressure taps, the mean of four rings, and the coefficient derived from displacement are plotted as separate curves.
Figure 106. Graph. Response of the cable as a function of wind speed or Reynolds number as measured by the lasers, accelerometers, and surface pressures for run 122.


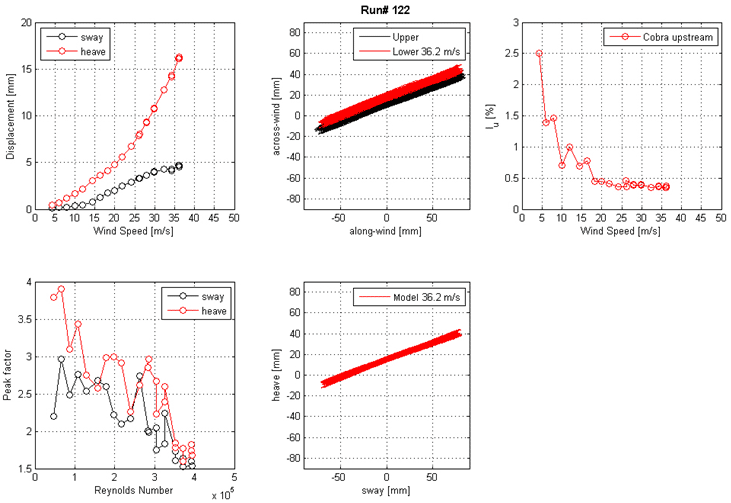
These five graphs show the run 122 mean displacement and peak factor from the laser, motion path at one wind speed, and intensity of turbulence measured at the entrance of the test section. The top left graph shows displacement on the y-axis from 0 to 20 mm and wind speed on the x-axis from 0 to 50 m/s for sway and heave. The top middle graph shows the motion path in the along-wind direction on the x-axis from -50 to 50 mm and the across-wind direction on the y-axis from -80 to 80 mm for the top and bottom ends of the cable model at a specific wind speed. The top right graph shows the turbulence intensity in the along-wind direction measured by the Cobra Probe upstream of the cable model. Turbulence intensity is on the y-axis from 0 to 3 percent, and wind speed is on the x-axis from 0 to 50 m/s. The bottom left graph shows the peak factor on the y-axis from 1.5 to 4 and Reynolds number on the x-axis from 0 to 5x10(to the 5th) for sway and heave. The bottom middle graph shows the motion path in sway on the x-axis from -50 to 50 mm and heave on the y-axis from -80 to 80 mm for the top and bottom ends of the cable model at a specific wind speed.
Figure 107. Graph. Mean displacement and peak factor from the laser, motion path at one wind speed, and intensity of turbulence measured at the entrance of the test section for run 122.


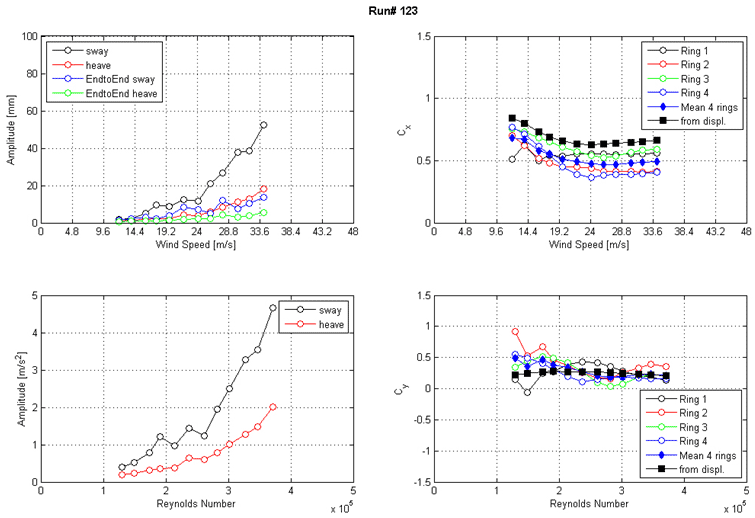
These four graphs show the run 123 response of the cable as a function of wind speed or Reynolds number  as measured by the lasers, accelerometers, and surface pressures. The top left graph shows the displacement amplitude on the y-axis from 0 to 100 mm and wind speed on the x-axis from 0 to 48 m/s for sway, heave, end-to-end sway, and end-to-end heave. The top right graph shows the along-wind force coefficient (Cx) on the y-axis from 0 to 1.5 and wind speed on the x-axis from 0 to 48 m/s. The four rings of pressure taps, the mean of four rings, and the coefficient derived from displacement are plotted as separate curves. The bottom left graph shows the acceleration amplitude on the y-axis from 0 to 5 m/s2 and Reynolds number on the x-axis from 0 to 5x10(to the 5th) for sway and heave. The bottom right graph shows the across-wind force coefficient (Cy) on the y-axis from -1.5 to 1.5 and Reynolds number on the x-axis from 0 to 5x10(to the 5th). The four rings of pressure taps, the mean of four rings, and the coefficient derived from displacement are plotted as separate curves.
Figure 108. Graph. Response of the cable as a function of wind speed or Reynolds number as measured by the lasers, accelerometers, and surface pressures for run 123.


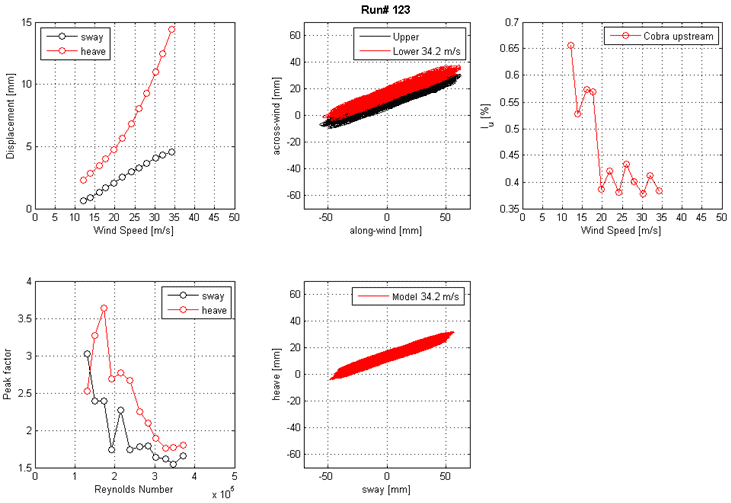
These five graphs show the run 123 mean displacement and peak factor from the laser, motion path at one wind speed, and intensity of turbulence measured at the entrance of the test section. The top left graph shows displacement on the y-axis from 0 to 15 mm and wind speed on the x-axis from 0 to 50 m/s for sway and heave. The top middle graph shows the motion path in the along-wind direction on the x-axis from -50 to 50 mm and the across-wind direction on the y-axis from -60 to 60 mm for the top and bottom ends of the cable model at a specific wind speed. The top right graph shows the turbulence intensity in the along-wind direction measured by the Cobra Probe upstream of the cable model. Turbulence intensity is on the y-axis from 0.36 to 0.7 percent, and wind speed is on the x-axis from 0 to 50 m/s. The bottom left graph shows the peak factor on the y-axis from 1.5 to 4 and Reynolds number on the x-axis from 0 to 5x10(to the 5th) for sway and heave. The bottom middle graph shows the motion path in sway on the x-axis from -50 to 50 mm and heave on the y-axis from -60 to 60 mm for the top and bottom ends of the cable model at a specific wind speed.
Figure 109. Graph. Mean displacement and peak factor from the laser, motion path at one wind speed, and intensity of turbulence measured at the entrance of the test section for run 123.


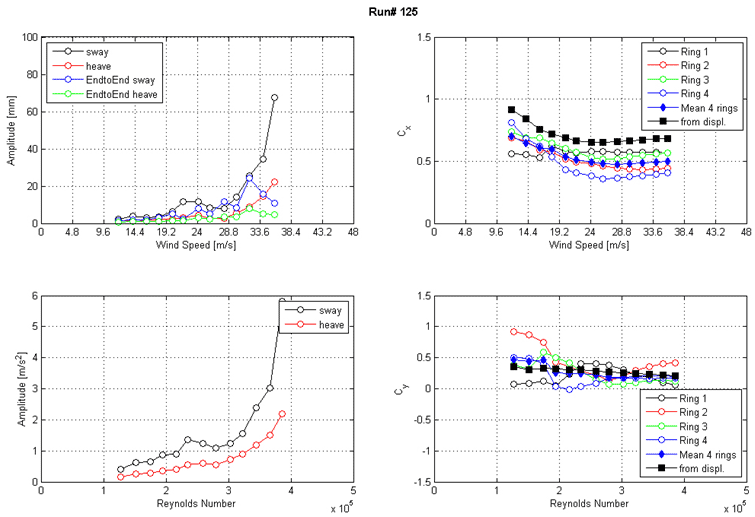
These four graphs show the run 125 response of the cable as a function of wind speed or Reynolds number as measured by the lasers, accelerometers, and surface pressures. The top left graph shows the displacement amplitude on the y-axis from 0 to 100 mm and wind speed on the x-axis from 0 to 48 m/s for sway, heave, end-to-end sway, and end-to-end heave. The top right graph shows the along-wind force coefficient (Cx) on the y-axis from 0 to 1.5 and wind speed on the x-axis from 0 to 48 m/s. The four rings of pressure taps, the mean of four rings, and the coefficient derived from displacement are plotted as separate curves. The bottom left graph shows the acceleration amplitude on the y-axis from 0 to 6 m/s2 and Reynolds number on the x-axis from 0 to 5x10(to the 5th) for sway and heave. The bottom right graph shows the across-wind force coefficient (Cy) on the y-axis from -1.5 to 1.5 and Reynolds number on the x-axis from 0 to 5x10(to the 5th). The four rings of pressure taps, the mean of four rings, and the coefficient derived from displacement are plotted as separate curves.
Figure 110. Graph. Response of the cable as a function of wind speed or Reynolds number as measured by the lasers, accelerometers, and surface pressures for run 125.


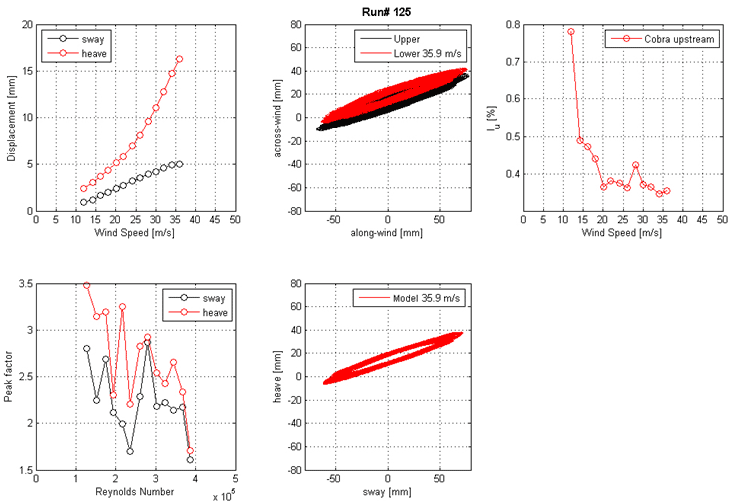
These five graphs show the run 125 mean displacement and peak factor from the laser, motion path at one wind speed, and intensity of turbulence measured at the entrance of the test section. The top left graph shows displacement on the y-axis from 0 to 20 mm and wind speed on the x-axis from 0 to 50 m/s for sway and heave. The top middle graph shows the motion path in the along-wind direction on the x-axis from -50 to 50 mm and the across-wind direction on the y-axis from -80 to 80 mm for the top and bottom ends of the cable model at a specific wind speed. The top right graph shows the turbulence intensity in the along-wind direction measured by the Cobra Probe upstream of the cable model. Turbulence intensity is on the y-axis from 0 to 0.8 percent, and wind speed is on the x-axis from 0 to 50 m/s. The bottom left graph shows the peak factor on the y-axis from 1.5 to 3.5 and Reynolds number on the x-axis from 0 to 5x10(to the 5th) for sway and heave. The bottom middle graph shows the motion path in sway on the x-axis from -50 to 50 mm and heave on the y-axis from -80 to 80 mm for the top and bottom ends of the cable model at a specific wind speed.
Figure 111. Graph. Mean displacement and peak factor from the laser, motion path at one wind speed, and intensity of turbulence measured at the entrance of the test section for run 125.


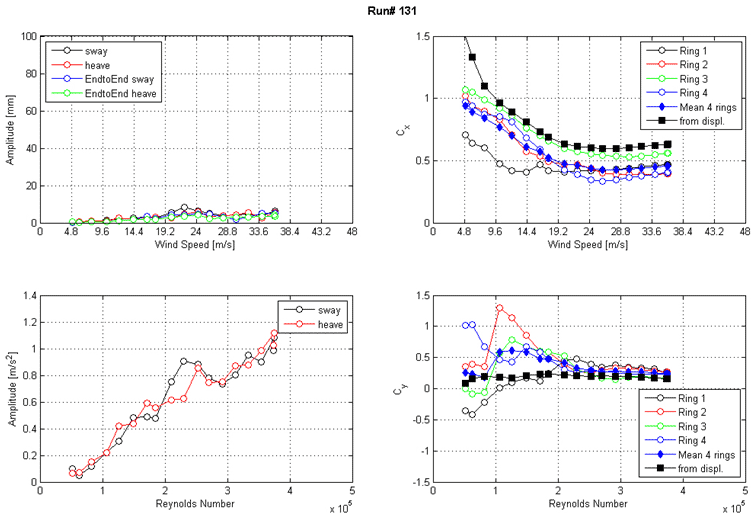
These four graphs show the run 131 response of the cable as a function of wind speed or Reynolds number as measured by the lasers, accelerometers, and surface pressures. The top left graph shows the displacement amplitude on the y-axis from 0 to 100 mm and wind speed on the x-axis from 0 to 48 m/s for sway, heave, end-to-end sway, and end-to-end heave. The top right graph shows the along-wind force coefficient (Cx) on the y-axis from 0 to 1.5 and wind speed on the x-axis from 0 to 48 m/s. The four rings of pressure taps, the mean of four rings, and the coefficient derived from displacement are plotted as separate curves. The bottom left graph shows the acceleration amplitude on the y-axis from 0 to 1.4 m/s2 and Reynolds number on the x-axis from 0 to 5x10(to the 5th) for sway and heave. The bottom right graph shows the across-wind force coefficient (Cy) on the y-axis from -1.5 to 1.5 and Reynolds number on the x-axis from 0 to 5x10(to the 5th). The four rings of pressure taps, the mean of four rings, and the coefficient derived from displacement are plotted as separate curves.
Figure 112. Graph. Response of the cable as a function of wind speed or Reynolds number as measured by the lasers, the accelerometers, and surface pressures for run 131.


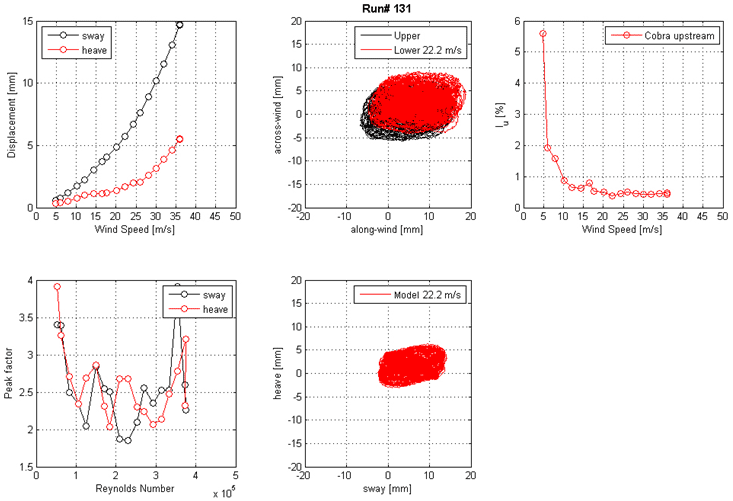
These five graphs show the run 131 mean displacement and peak factor from the laser, motion path at one wind speed, and intensity of turbulence measured at the entrance of the test section. The top left graph shows displacement on the y-axis from 0 to 15 mm and wind speed on the x-axis from 0 to 50 m/s for sway and heave. The top middle graph shows the motion path in the along-wind direction on the x-axis from -20 to 20 mm and the across-wind direction on the y-axis from -20 to 20 mm for the top and bottom ends of the cable model at a specific wind speed. The top right graph shows the turbulence intensity in athe long-wind direction measured by the Cobra Probe upstream of the cable model. Turbulence intensity is on the y-axis from 0 to 6 percent, and wind speed is on the x-axis from 0 to 50 m/s. The bottom left graph shows the peak factor on the y-axis from 1.5 to 4 and Reynolds number on the x-axis from 0 to 5x10(to the 5th) for sway and heave. The bottom middle graph shows the motion path in sway on the x-axis from -20 to 20 mm and heave on the y-axis from -20 to 20 mm for the top and bottom ends of the cable model at a specific wind speed.
Figure 113. Graph. Mean displacement and peak factor from the laser, motion path at one wind speed, and intensity of turbulence measured at the entrance of the test section for run 131.


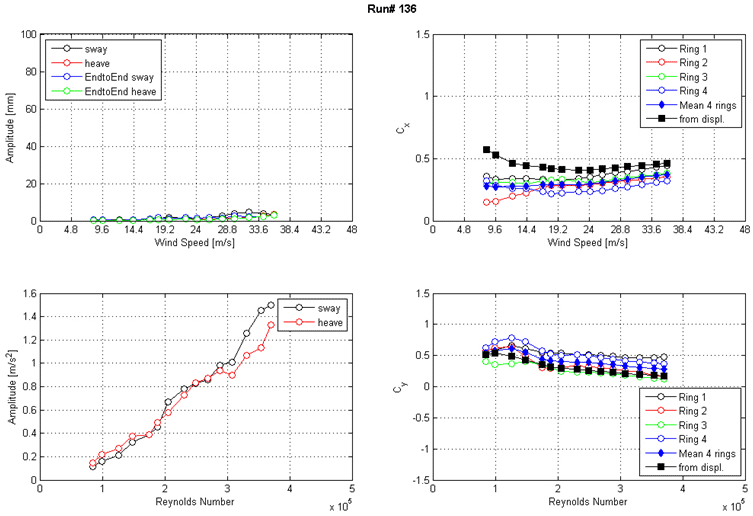
These four graphs show the run 136 response of the cable as a function of wind speed or Reynolds number  as measured by the lasers, accelerometers, and surface pressures. The top left graph shows the displacement amplitude on the y-axis from 0 to 100 mm and wind speed on the x-axis from 0 to 48 m/s for sway, heave, end-to-end sway, and end-to-end heave. The top right graph shows the along-wind force coefficient (Cx) on the y-axis from 0 to 1.5 and wind speed on the x-axis from 0 to 48 m/s. The four rings of pressure taps, the mean of four rings, and the coefficient derived from displacement are plotted as separate curves. The bottom left graph shows the acceleration amplitude on the y-axis from 0 to 1.6 m/s2 and Reynolds number on the x-axis from 0 to 5x10(to the 5th) for sway and heave. The bottom right graph shows the across-wind force coefficient (Cy) on the y-axis from -1.5 to 1.5 and Reynolds number on the x-axis from 0 to 5x10(to the 5th). The four rings of pressure taps, the mean of four rings, and the coefficient derived from displacement are plotted as separate curves.
Figure 114. Graph. Response of the cable as a function of wind speed or Reynolds number as measured by the lasers, accelerometers, and surface pressures for run 136.


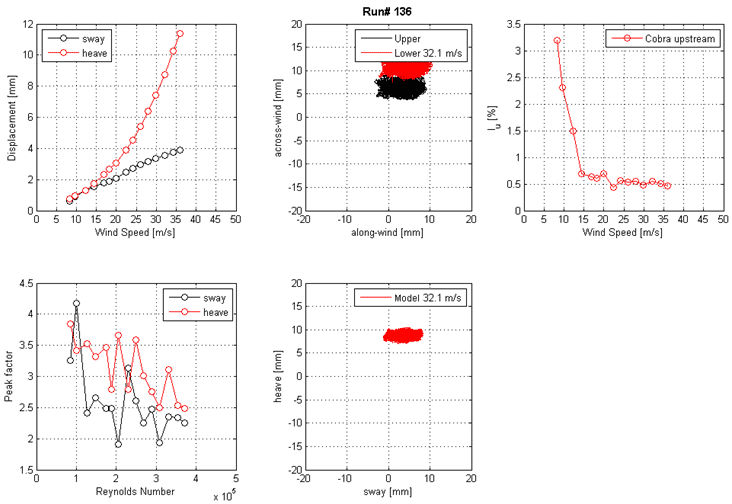
These five graphs show the run 136 mean displacement and peak factor from the laser, motion path at one wind speed, and intensity of turbulence measured at the entrance of the test section. The top left graph shows displacement on the y-axis from 0 to 12 mm and wind speed on the x-axis from 0 to 50 m/s for sway and heave. The top middle graph shows the motion path in the along-wind direction on the x-axis from -20 to 20 mm and the across-wind direction on the y-axis from -20 to 20 mm for the top and bottom ends of the cable model at a specific wind speed. The top right graph shows the turbulence intensity in the along-wind direction measured by the Cobra Probe upstream of the cable model. Turbulence intensity is on the y-axis from 0 to 3.5 percent, and wind speed is on the x-axis from 0 to 50 m/s. The bottom left graph shows the peak factor on the y-axis from 1.5 to 4.5 and Reynolds number on the x-axis from 0 to 5x10(to the 5th) for sway and heave. The bottom middle graph shows the motion path in sway on the x-axis from -20 to 20 mm and heave on the y-axis from -20 to 20 mm for the top and bottom ends of the cable model at a specific wind speed.
Figure 115. Graph. Mean displacement and peak factor from the laser, motion path at one wind speed, and intensity of turbulence measured at the entrance of the test section for run 136.


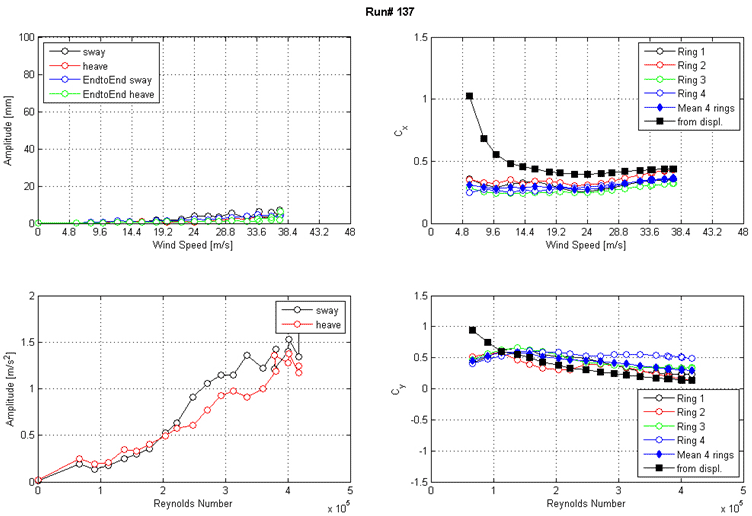
These four graphs show the run 137 response of the cable as a function of wind speed or Reynolds number as measured by the lasers, accelerometers, and surface pressures. The top left graph shows the displacement amplitude on the y-axis from 0 to 100 mm and wind speed on the x-axis from 0 to 48 m/s for sway, heave, end-to-end sway, and end-to-end heave. The top right graph shows the along-wind force coefficient (Cx) on the y-axis from 0 to 1.5 and wind speed on the x-axis from 0 to 48 m/s. The four rings of pressure taps, the mean of four rings, and the coefficient derived from displacement are plotted as separate curves. The bottom left graph shows the acceleration amplitude on the y-axis from 0 to 2 m/s2 and Reynolds number on the x-axis from 0 to 5x10(to the 5th) for sway and heave. The bottom right graph shows the across-wind force coefficient (Cy) on the y-axis from -1.5 to 1.5 and Reynolds number on the x-axis from 0 to 5x10(to the 5th). The four rings of pressure taps, the mean of four rings, and the coefficient derived from displacement are plotted as separate curves.
Figure 116. Graph. Response of the cable as a function of wind speed or Reynolds number as measured by the lasers, the accelerometers, and surface pressures for run 137.


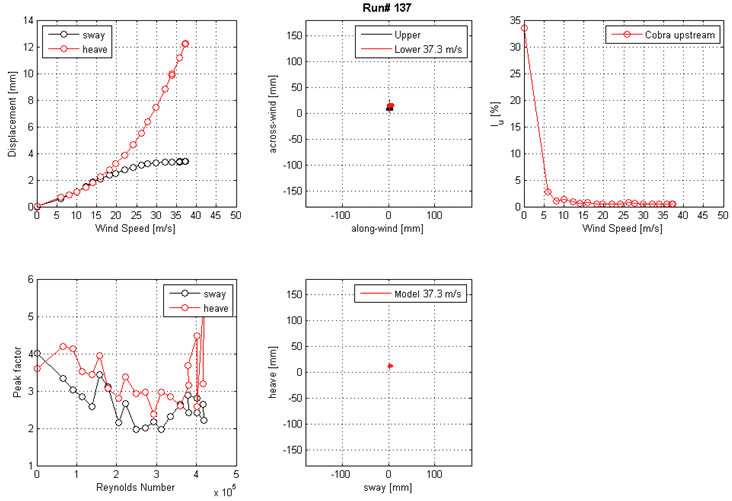
These five graphs show the run 137 mean displacement and peak factor from the laser, motion path at one wind speed, and intensity of turbulence measured at the entrance of the test section. The top left graph shows displacement on the y-axis from 0 to 14 mm and wind speed on the x-axis from 0 to 50 mm for sway and heave. The top middle graph shows the motion path in the along-wind direction on the x-axis from -100 to 100 mm and the across-wind direction on the y-axis from -150 to 150 mm for the top and bottom ends of the cable model at a specific wind speed. The top right graph shows the turbulence intensity in the along-wind direction measured by the Cobra probe upstream of the cable model. Turbulence intensity is on the y-axis from 0 to 36 percent, and wind speed is on the x-axis from 0 to 50 m/s. The bottom left graph shows the peak factor on the y-axis from 1 to 6 and Reynolds number on the x-axis from 0 to 5x10(to the 5th) for sway and heave. The bottom middle graph shows the motion path in sway on the x-axis from -100 to 100 mm and heave on the y-axis from -150 to 150 mm for the top and bottom ends of the cable model at a specific wind speed.
Figure 117. Graph. Mean displacement and peak factor from the laser, motion path at one wind speed, and intensity of turbulence measured at the entrance of the test section for run 137.


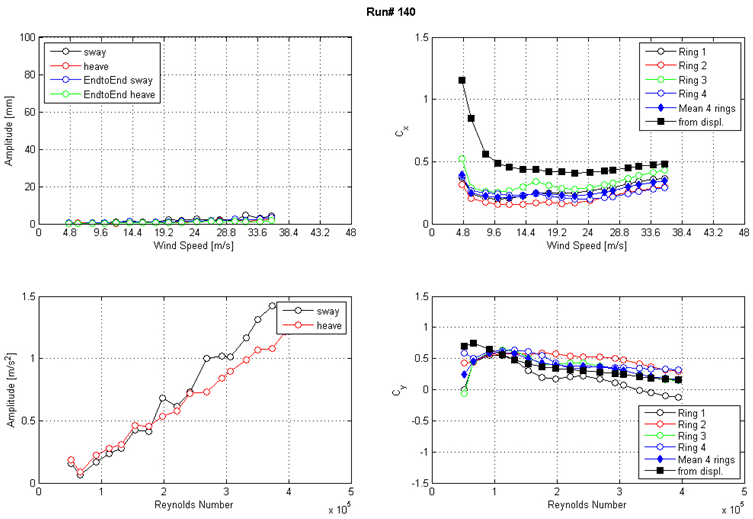
These four graphs show the run 140 response of the cable as a function of wind speed or Reynolds number as measured by the lasers, accelerometers, and surface pressures. The top left graph shows the displacement amplitude on the y-axis from 0 to 100 mm and wind speed on the x-axis from 0 to 48 m/s for sway, heave, end-to-end sway, and end-to-end heave. The top right graph shows the along-wind force coefficient (Cx) on the y-axis from 0 to 1.5 and wind speed on the x-axis from 0 to 48 m/s. The four rings of pressure taps, the mean of four rings, and the coefficient derived from displacement are plotted as separate curves. The bottom left graph shows the acceleration amplitude on the y-axis from 0 to 1.5 m/s2 and Reynolds number on the x-axis from 0 to 5x10(to the 5th) for sway and heave. The bottom right graph shows the across-wind force coefficient (Cy) on the y-axis from -1.5 to 1.5 and Reynolds number on the x-axis from 0 to 5x10(to the 5th). The four rings of pressure taps, the mean of four rings, and the coefficient derived from displacement are plotted as separate curves.
Figure 118. Graph. Response of the cable as a function of wind speed or Reynolds number as measured by the lasers, accelerometers, and surface pressures for run 140.


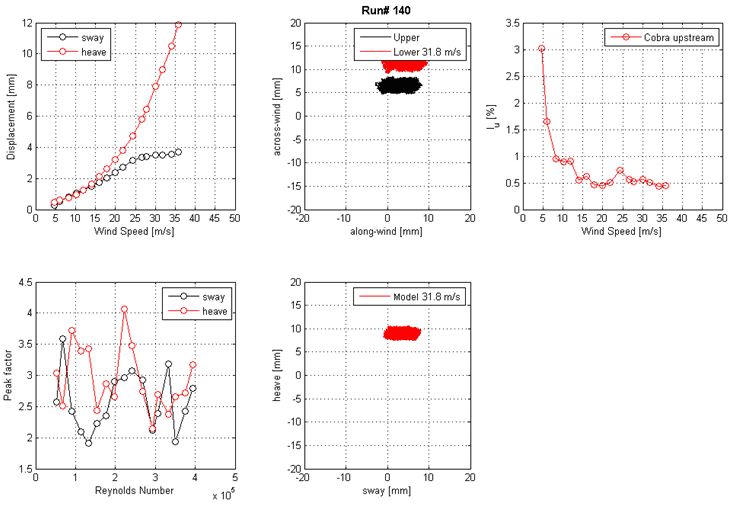
These five graphs show the run 140 mean displacement and peak factor from the laser, motion path at one wind speed, and intensity of turbulence measured at the entrance of the test section. The top left graph shows displacement on the y-axis from 0 to 12 mm and wind speed on the x-axis from 0 to 50 m/s for sway and heave. The top middle graph shows the motion path in the along-wind direction on the x-axis from -20 to 20 mm and the across-wind direction on the y-axis from -20 to 20 mm for the top and bottom ends of the cable model at a specific wind speed. The top right graph shows the turbulence intensity in the along-wind direction measured by the Cobra Probe upstream of the cable model. Turbulence intensity is on the y-axis from 0 to 3.5 percent, and wind speed is on the x-axis from 0 to 50 m/s. The bottom left graph shows the peak factor on the y-axis from 1.5 to 4.5 and Reynolds number on the x-axis from 0 to 5x10(to the 5th) for sway and heave. The bottom middle graph shows the motion path in sway on the x-axis from -20 to 20 mm and heave on the y-axis from -20 to 20 mm for the top and bottom ends of the cable model at a specific wind speed.
Figure 119. Graph. Mean displacement and peak factor from the laser, motion path at one wind speed, and intensity of turbulence measured at the entrance of the test section for run 140.


These four graphs show the run 142 response of the cable as a function of wind speed or Reynolds number  as measured by the lasers, accelerometers, and surface pressures. The top left graph shows the displacement amplitude on the y-axis from 0 to 100 mm and wind speed on the x-axis from 0 to 48 m/s for sway, heave, end-to-end sway, and end-to-end heave. The top right graph shows the along-wind force coefficient (Cx) on the y-axis from 0 to 1.5 and wind speed on the x-axis from 0 to 48 m/s. The four rings of pressure taps, the mean of four rings, and the coefficient derived from displacement are plotted as separate curves. The bottom left graph shows the acceleration amplitude on the y-axis from 0 to 2 m/s2 and Reynolds number on the x-axis from 0 to 5x10(to the 5th) for sway and heave. The bottom right graph shows the across-wind force coefficient (Cy) on the y-axis from -1.5 to 1.5 and Reynolds number on the x-axis from 0 to 5x10(to the 5th). The four rings of pressure taps, the mean of four rings, and the coefficient derived from displacement are plotted as separate curves.
Figure 120. Graph. Response of the cable as a function of wind speed or Reynolds number as measured by the lasers, accelerometers, and surface pressures for run 142.


These five graphs show the run 142 mean displacement and peak factor from the laser, motion path at one wind speed, and intensity of turbulence measured at the entrance of the test section. The top left graph shows displacement on the y-axis from 0 to 12 mm and wind speed on the x-axis from 0 to 50 m/s for sway and heave. The top middle graph shows the motion path in the along-wind direction on the x-axis from -20 to 20 mm and the across-wind direction on the y-axis from -20 to 20 mm for the top and bottom ends of the cable model at a specific wind speed. The top right graph shows the turbulence intensity in the along-wind direction measured by the Cobra Probe upstream of the cable model. Turbulence intensity is on the y-axis from 0 to 10 percent, and wind speed is on the x-axis from 0 to 50 m/s. The bottom left graph shows the peak factor on the y-axis from 1.5 to 4.5 and Reynolds number on the x-axis from 0 to 5x10(to the 5th) for sway and heave. The bottom middle graph shows the motion path in sway on the x-axis from -20 to 20 mm and heave on the y-axis from -20 to 20 mm for the top and bottom ends of the cable model at a specific wind speed.
Figure 121. Graph. Mean displacement and peak factor from the laser, motion path at one wind speed, and intensity of turbulence measured at the entrance of the test section for run 142.


These four graphs show the run 144 response of the cable as a function of wind speed or Reynolds number as measured by the lasers, accelerometers, and surface pressures. The top left graph shows the displacement amplitude on the y-axis from 0 to 100 mm and wind speed on the x-axis from 0 to 48 m/s for sway, heave, end-to-end sway, and end-to-end heave. The top right graph shows the along-wind force coefficient (Cx) on the y-axis from 0 to 1.5 and wind speed on the x-axis from 0 to 48 m/s. The four rings of pressure taps, the mean of four rings, and the coefficient derived from displacement are plotted as separate curves. The bottom left graph shows the acceleration amplitude on the y-axis from 0 to 1.6 m/s2 and Reynolds number on the x-axis from 0 to 5x10(to the 5th) for sway and heave. The bottom right graph shows the across-wind force coefficient (Cy) on the y-axis from -1.5 to 1.5 and Reynolds number on the x-axis from 0 to 5x10(to the 5th). The four rings of pressure taps, the mean of four rings, and the coefficient derived from displacement are plotted as separate curves.
Figure 122. Graph. Response of the cable as a function of wind speed or Reynolds number as measured by the lasers, accelerometers, and surface pressures for run 144.


These five graphs show the run 144 mean displacement and peak factor from the laser, motion path at one wind speed, and intensity of turbulence measured at the entrance of the test section. The top left graph shows displacement on the y-axis from 0 to 12 mm and wind speed on the x-axis from 0 to 50 m/s for sway and heave. The top middle graph shows the motion path in the along-wind direction on the x-axis from -20 to 20 mm and the across-wind direction on the y-axis from -20 to 20 mm for the top and bottom ends of the cable model at a specific wind speed. The top right graph shows the turbulence intensity in the along-wind direction measured by the Cobra Probe upstream of the cable model. Turbulence intensity is on the y-axis from 0 to 5 percent, and wind speed is on the x-axis from 0 to 50 m/s. The bottom left graph shows the peak factor on the y-axis from 1.5 to 4.5 and Reynolds number on the x-axis from 0 to 5x10(to the 5th) for sway and heave. The bottom middle graph shows the motion path in sway on the x-axis from -20 to 20 mm and heave on the y-axis from -20 to 20 mm for the top and bottom ends of the cable model at a specific wind speed.
Figure 123. Graph. Mean displacement and peak factor from the laser, motion path at one wind speed, and intensity of turbulence measured at the entrance of the test section for run 144.


These four graphs show the run 149 response of the cable as a function of wind speed or Reynolds number as measured by the lasers, accelerometers, and surface pressures. The top left graph shows the displacement amplitude on the y-axis from 0 to 100 mm and wind speed on the x-axis from 0 to 48 m/s for sway, heave, end-to-end sway, and end-to-end heave. The top right graph shows the along-wind force coefficient (Cx) on the y-axis from 0 to 1.5 and wind speed on the x-axis from 0 to 48 m/s. The four rings of pressure taps, the mean of four rings, and the coefficient derived from displacement are plotted as separate curves. The bottom left graph shows the acceleration amplitude on the y-axis from 0 to 1.5 m/s2 and Reynolds number on the x-axis from 0 to 5x10(to the 5th) for sway and heave. The bottom right graph shows the across-wind force coefficient (Cy) on the y-axis from -1.5 to 1.5 and Reynolds number on the x-axis from 0 to 5x10(to the 5th). The four rings of pressure taps, the mean of four rings, and the coefficient derived from displacement are plotted as separate curves.
Figure 124. Graph. Response of the cable as a function of wind speed or Reynolds number as measured by the lasers, accelerometers, and surface pressures for run 149.


These five graphs show the run 149 mean displacement and peak factor from the laser, motion path at one wind speed, and intensity of turbulence measured at the entrance of the test section. The top left graph shows displacement on the y-axis from 0 to 12 mm and wind speed on the x-axis from 0 to 50 m/s for sway and heave. The top middle graph shows the motion path in the along-wind direction on the x-axis from -30 to 30 mm and the across-wind direction on the y-axis from -30 to 30 mm for the top and bottom ends of the cable model at a specific wind speed. The top right graph shows the turbulence intensity in the along-wind direction measured by the Cobra Probe upstream of the cable model. Turbulence intensity is on the y-axis from 0 to 3.5 percent, and wind speed is on the x-axis from 0 to 50 m/s. The bottom left graph shows the peak factor on the y-axis from 1.5 to 5 and Reynolds number from 0 to 5x10(to the 5th) for sway and heave. The bottom middle graph shows the motion path in sway on the x-axis from -30 to 30 mm and heave on the y-axis from -30 to 30 mm for the top and bottom ends of the cable model at a specific wind speed.
Figure 125. Graph. Mean displacement and peak factor from the laser, motion path at one wind speed, and intensity of turbulence measured at the entrance of the test section for run 149.


These four graphs show the run 152 response of the cable as a function of wind speed or Reynolds number as measured by the lasers, accelerometers, and surface pressures. The top left graph shows the displacement amplitude on the y-axis from 0 to 100 mm and wind speed on the x-axis from 0 to 48 m/s for sway, heave, end-to-end sway, and end-to-end heave. The top right graph shows the along-wind force coefficient (Cx) on the y-axis from 0 to 1.5 and wind speed on the x-axis from 0 to 48 m/s. The four rings of pressure taps, the mean of four rings, and the coefficient derived from displacement are plotted as separate curves. The bottom left graph shows the acceleration amplitude on the y-axis from 0 to 1.4 m/s2 and Reynolds number on the x-axis from 0 to 5x10(to the 5th) for sway and heave. The bottom right graph shows the across-wind force coefficient (Cy) on the y-axis from -1.5 to 1.5 and Reynolds number on the x-axis from 0 to 5x10(to the 5th). The four rings of pressure taps, the mean of four rings, and the coefficient derived from displacement are plotted as separate curves.
Figure 126. Graph. Response of the cable as a function of wind speed or Reynolds number as measured by the lasers, accelerometers, and surface pressures for run 152.


These five graphs show the run 152 mean displacement and peak factor from the laser, motion path at one wind speed, and intensity of turbulence measured at the entrance of the test section. The top left graph shows displacement on the y-axis from -2 to 12 mm and wind speed on the x-axis from 0 to 50 m/s for sway and heave. The top middle graph shows the motion path in the along-wind direction on the x-axis from -20 to 20 mm and the across-wind direction on the y-axis from -20 to 20 mm for the top and bottom ends of the cable model at a specific wind speed. The top right graph shows the turbulence intensity in the along-wind direction measured by the Cobra Probe upstream of the cable model. Turbulence intensity is on the y-axis from 0 to 4 percent, and wind speed is on the x-axis from 0 to 50 m/s. The bottom left graph shows the peak factor on the y-axis from 2 to 4 and Reynolds number on the x-xis from 0 to 5x10(to the 5th). The bottom middle graph shows the motion path in sway on the x-axis from -20 to 20 mm and heave on the y-axis from -20 to 20 mm for the top and bottom ends of the cable model at a specific wind speed.
Figure 127. Graph. Mean displacement and peak factor from the laser, motion path at one wind speed, and intensity of turbulence measured at the entrance of the test section for run 152.


These four graphs show the run 155 response of the cable as a function of wind speed or Reynolds number  as measured by the lasers, accelerometers, and surface pressures. The top left graph shows the displacement amplitude on the y-axis from 0 to 100 mm and wind speed on the x-axis from 0 to 48 m/s for sway, heave, end-to-end sway, and end-to-end heave. The top right graph shows the along-wind force coefficient (Cx) on the y-axis from 0 to 1.5 and wind speed on the x-axis from 0 to 48 m/s. The four rings of pressure taps, the mean of four rings, and the coefficient derived from displacement are plotted as separate curves. The bottom left graph shows the acceleration amplitude on the y-axis from 0 to 1.5 m/s2 and Reynolds number on the x-axis from 0 to 5x10(to the 5th) for sway and heave. The bottom right graph shows the across-wind force coefficient (Cy) on the y-axis from -1.5 to 1.5 and Reynolds number on the x-axis from 0 to 5x10(to the 5th). The four rings of pressure taps, the mean of four rings, and the coefficient derived from displacement are plotted as separate curves.
Figure 128. Graph. Response of the cable as a function of wind speed or Reynolds number as measured by the lasers, accelerometers, and surface pressures for run 155.


These five graphs show the run 155 mean displacement and peak factor from the laser, motion path at one wind speed, and intensity of turbulence measured at the entrance of the test section. The top left graph shows displacement on the y-axis from 0 to 12 mm and wind speed on the x-axis from 0 to 50 m/s for sway and heave. The top middle graph shows the motion path in the along-wind direction on the x-axis from -30 to 30 mm and the across-wind direction on the y-axis from -30 to 30 mm for the top and bottom ends of the cable model at a specific wind speed. The top right graph shows the turbulence intensity in the along-wind direction measured by the Cobra Probe upstream of the cable model. Turbulence intensity is on the y-axis from 0 to 4 percent, and wind speed is on the x-axis form 0 to 50 m/s. The bottom left graph shows the peak factor on the y-axis from 1.5 to 4 and Reynolds number on the x-axis from 0 to 5x10(to the 5th) for sway and heave. The bottom middle graph shows the motion path in sway on the x-axis from -30 to 30 mm and heave on the y-axis from -30 to 30 mm for the top and bottom ends of the cable model at a specific wind speed.
Figure 129. Graph. Mean displacement and peak factor from the laser, motion path at one wind speed, and intensity of turbulence measured at the entrance of the test section for run 155.


These four graphs show the run 159 response of the cable as a function of wind speed or Reynolds number  as measured by the lasers, accelerometers, and surface pressures. The top left graph shows the displacement amplitude on the y-axis from 0 to 100 mm and wind speed on the x-axis from 0 to 48 m/s for sway, heave, end-to-end sway, and end-to-end heave. The top right graph shows the along-wind force coefficient (Cx) on the y-axis from 0 to 1.5 and wind speed on the x-axis from 0 to 48 m/s. The four rings of pressure taps, the mean of four rings, and the coefficient derived from displacement are plotted as separate curves. The bottom left graph shows the acceleration amplitude on the y-axis from 0 to 2 m/s2 and Reynolds number on the x-axis from 0 to 5x10(to the 5th) for sway and heave. The bottom right graph shows the across-wind force coefficient (Cy) on the y-axis from -1. to 1.5 and Reynolds number on the x-axis from 0 to 5x10(to the 5th). The four rings of pressure taps, the mean of four rings, and the coefficient derived from displacement are plotted as separate curves.
Figure 130. Graph. Response of the cable as a function of wind speed or Reynolds number as measured by the lasers, accelerometers, and surface pressures for run 159.


These five graphs show the run 159 mean displacement and peak factor from the laser, motion path at one wind speed, and intensity of turbulence measured at the entrance of the test section. The top left graph shows displacement on the y-axis from 0 to 10 mm and wind speed on the x-axis from 0 to 50 m/s for sway and heave. The top middle graph shows the motion path in the along-wind direction on the x-axis from -20 to 20 mm and the across-wind direction on the y-axis from -20 to 20 mm for the top and bottom ends of the cable model at a specific wind speed. The top right graph shows the turbulence intensity in the along-wind direction measured by the Cobra Probe upstream of the cable model. Turbulence intensity is on the y-axis from 0 to 3 percent, and wind speed is on the x-axis from 0 to 50 m/s. The bottom left graph shows the peak factor on the y-axis from 1.5 to 4.5 and Reynolds number on the x-axis from 0 to 5x10(to the 5th) for sway and heave. The bottom middle graph shows the motion path in sway on the x-axis from -20 to 20 mm and heave on the y-axis from -20 to 20 mm for the top and bottom ends of the cable model at a specific wind speed.
Figure 131. Graph. Mean displacement and peak factor from the laser, motion path at one wind speed, and intensity of turbulence measured at the entrance of the test section for run 159.


These four graphs show the run 163 response of the cable as a function of wind speed or Reynolds number as measured by the lasers, accelerometers, and surface pressures. The top left graph shows the displacement amplitude on the y-axis from 0 to 100 mm and wind speed on the x-axis from 0 to 48 m/s for sway, heave, end-to-end sway, and end-to-end heave. The top right graph shows the along-wind force coefficient (Cx) on the y-axis from 0 to 1.5 and wind speed on the x-axis from 0 to 48 m/s. The four rings of pressure taps, the mean of four rings, and the coefficient derived from displacement are plotted as separate curves. The bottom left graph shows the acceleration amplitude on the y-axis from 0 to 3.5 m/s2 and Reynolds number on the x-axis from 0 to 5x10(to the 5th) for sway and heave. The bottom right graph shows the across-wind force coefficient (Cy) on the y-axis from -1.5 to 1.5 and Reynolds number on the x-axis from 0 to 5x10(to the 5th). The four rings of pressure taps, the mean of four rings, and the coefficient derived from displacement are plotted as separate curves.
Figure 132. Graph. Response of the cable as a function of wind speed or Reynolds number as measured by the lasers, accelerometers, and surface pressures for run 163.


These five graphs show the run 163 mean displacement and peak factor from the laser, motion path at one wind speed, and intensity of turbulence measured at the entrance of the test section. The top left graph shows displacement on the y-axis from 0 to 15 mm and wind speed on the x-axis from 0 to 50 m/s for sway and heave. The top middle graph shows the motion path in the along-wind direction on the x-axis from -50 to 50 mm and the across-wind on the y-axis from -50 to 50 mm for the top and bottom ends of the cable model at a specific wind speed. The top right graph shows the turbulence intensity in the along-wind direction measured by the Cobra Probe upstream of the cable model. Turbulence intensity is on the y-axis from 0 to 35 percent, and wind speed is on the x-axis from 0 to 50 m/s. The bottom left graph shows the peak factor on the y-axis from 1.5 to 4 and Reynolds number on the x-axis from 0 to 5x10(to the 5th) for sway and heave. The bottom middle graph shows the motion path in sway on the x-axis from -50 to 50 mm and heave on the y-axis from -50 to 50 mm for the top and bottom ends of the cable model at a specific wind speed.
Figure 133. Graph. Mean displacement and peak factor from the laser, motion path at one wind speed, and intensity of turbulence measured at the entrance of the test section for run 163.


These four graphs show the run 167 response of the cable as a function of wind speed or Reynolds number  as measured by the lasers, accelerometers, and surface pressures. The top left graph shows the displacement amplitude on the y-axis from 0 to 100 mm and wind speed on the x-axis from 0 to 48 m/s for sway, heave, end-to-end sway, and end-to-end heave. The top right graph shows the along-wind force coefficient (Cx) on the y-axis from 0 to 1.5 and wind speed on the x-axis from 0 to 48 m/s. The four rings of pressure taps, the mean of four rings, and the coefficient derived from displacement are plotted as separate curves. The bottom left graph shows the acceleration amplitude on the y-axis from 0 to 5 m/s2 and Reynolds number on the x-axis from 0 to 5x10(to the 5th) for sway and heave. The bottom right graph shows the across-wind force coefficient (Cy) on the y-axis from -1.5 to 1.5 and Reynolds number on the x-axis from 0 to 5x10(to the 5th). The four rings of pressure taps, the mean of four rings, and the coefficient derived from displacement are plotted as separate curves.
Figure 134. Graph. Response of the cable as a function of wind speed or Reynolds number as measured by the lasers, accelerometers, and surface pressures for run 167.


These five graphs show the run 167 mean displacement and peak factor from the laser, motion path at one wind speed, and intensity of turbulence measured at the entrance of the test section. The top left graph shows displacement on the y-axis from 0 to 14 mm and wind speed on the x-axis from 0 to 50 m/s for sway and heave. The top middle graph shows the motion path in the along-wind direction on the x-axis from -50 to 50 mm and the across-wind direction on the y-axis from -60 to 60 mm for the top and bottom ends of the cable model at a specific wind speed. The top right graph shows the turbulence intensity in the along-wind direction measured by the Cobra Probe upstream of the cable model. Turbulence intensity is on the y-axis from 0.2 to 1.6 percent, and wind speed is on the x-axis from 0 to 50 m/s. The bottom left graph shows the peak factor on the y-axis from 1.5 to 4 and Reynolds number on the x-axis from 0 to 5x10(to the 5th) for sway and heave. The bottom middle graph shows the motion path in sway on the x-axis from -50 to 50 mm and heave on the y-axis from -60 to 60 mm for the top and bottom ends of the cable model at a specific wind speed.
Figure 135. Graph. Mean displacement and peak factor from the laser, motion path at one wind speed, and intensity of turbulence measured at the entrance of the test section for run 167.


These five graphs show the run 167 mean displacement and peak factor from the laser, motion path at one These four graphs show the run 176 response of the cable as a function of wind speed or Reynolds number as measured by the lasers, accelerometers, and surface pressures. The top left graph shows the displacement amplitude on the y-axis from 0 to 100 mm and wind speed on the x-axis from 0 to 48 m/s for sway, heave, end-to-end sway, and end-to-end heave. The top right graph shows the along-wind force coefficient (Cx) on the y-axis from 0 to 1.5 and wind speed on the x-axis from 0 to 48 m/s. The four rings of pressure taps, the mean of four rings, and the coefficient derived from displacement are plotted as separate curves. The bottom left graph shows the acceleration amplitude on the y-axis from 0 to 3 m/s2 and Reynolds number on the x-axis from 0 to 5x10(to the 5th) for sway and heave. The bottom right graph shows the across-wind force coefficient (Cy) on the y-axis from -1.5 to 1.5 and Reynolds number on the x-axis from 0 to 5x10(to the 5th). The four rings of pressure taps, the mean of four rings, and the coefficient derived from displacement are plotted as separate curves.
Figure 136. Graph. Response of the cable as a function of wind speed or Reynolds number as measured by the lasers, accelerometers, and surface pressures for run 176.


These five graphs show the run 176 mean displacement and peak factor from the laser, motion path at one wind speed, and intensity of turbulence measured at the entrance of the test section. The top left graph shows displacement on the y-axis from 0 to 15 mm and wind speed on the x-axis from 0 to 50 m/s for sway and heave. The top middle graph shows the motion path in the along-wind direction on the x-axis from -50 to 50 mm and the across-wind direction on the y-axis from -50 to 50 mm for the top and bottom ends of the cable model. The top right graph shows the turbulence intensity in the along-wind direction measured by the Cobra Probe upstream of the cable model. Turbulence intensity is on the y-axis from 0 to 3.5 percent, and wind speed is on the x-axis from 0 to 50 m/s. The bottom left graph shows the peak factor on the y-axis from 1.5 to 4 and Reynolds number on the x-axis from 0 to 5x10(to the 5th) for sway and heave. The bottom middle graph shows the motion path in sway on the x-axis from -50 to 50 mm and heave on the y-axis from -50 to 50 mm for the top and bottom ends of the cable model at a specific wind speed.
Figure 137. Graph. Mean displacement and peak factor from the laser, motion path at one wind speed, and intensity of turbulence measured at the entrance of the test section for run 176.


These four graphs show the run 178 response of the cable as a function of wind speed or Reynolds number  as measured by the lasers, accelerometers, and surface pressures. The top left graph shows the displacement amplitude on the y-axis from 0 to 100 mm and wind speed on the x-axis from 0 to 48 m/s for sway, heave, end-to-end sway, and end-to-end heave. The top right graph shows the along-wind force coefficient (Cx) on the y-axis from 0 to 1.5 and wind speed on the x-axis from 0 to 48 m/s. The four rings of pressure taps, the mean of four rings, and the coefficient derived from displacement are plotted as separate curves. The bottom left graph shows the acceleration amplitude on the y-axis from 0 to 3.5 m/s2 and Reynolds number on the x-axis from 0 to 5x10(to the 5th) for sway and heave. The bottom right graph shows the across-wind force coefficient (Cy) on the y-axis from -1.5 to 1.5 and Reynolds number on the x-axis from 0 to 5x10(to the 5th). The four rings of pressure taps, the mean of four rings, and the coefficient derived from displacement are plotted as separate curves.
Figure 138. Graph. Response of the cable as a function of wind speed or Reynolds number as measured by the lasers, accelerometers, and surface pressures for run 178.


These five graphs show the run 178 mean displacement and peak factor from the laser, motion path at one wind speed, and intensity of turbulence measured at the entrance of the test section. The top left graph shows displacement on the y-axis from 0 to 14 mm and wind speed on the x-axis from 0 to 50 m/s for sway and heave. The top middle graph shows the motion path in the along-wind direction on the x-axis from -50 to 50 mm and the across-wind direction on the y-axis from -50 to 50 mm for the top and bottom ends of the cable model at a specific wind speed. The top right graph shows the turbulence intensity in the along-wind direction measured by the Cobra Probe upstream of the cable model. Turbulence intensity is on the y-axis from 0 to 3.5 percent, and wind speed is on the x-axis from 0 to 50 m/s. The bottom left graph shows the peak factor on the y-axis from 1.5 to 5 and Reynolds number on the x-axis from 0 to 5x10(to the 5th) for sway and heave. The bottom middle graph shows the motion path in sway on the x-axis from -50 to 50 mm and heave on the y-axis from -50 to 50 mm for the top and bottom ends of the cable model at a specific wind speed.
Figure 139. Graph. Mean displacement and peak factor from the laser, motion path at one wind speed, and intensity of turbulence measured at the entrance of the test section for run 178.


These four graphs show the run 197 response of the cable as a function of wind speed or Reynolds number  as measured by the lasers, accelerometers, and surface pressures. The top left graph shows the displacement amplitude on the y-axis from 0 to 100 mm and wind speed on the x-axis from 0 to 48 m/s for sway, heave, end-to-end sway, and end-to-end heave. The top right graph shows the along-wind force coefficient (Cx) on the y-axis from 0 to 1.5 and wind speed on the x-axis from 0 to 48 m/s. The four rings of pressure taps, the mean of four rings, and the coefficient derived from displacement are plotted as separate curves. The bottom left graph shows the acceleration amplitude on the y-axis from 0 to 2.5 m/s2 and Reynolds number on the x-axis from 0 to 5x10(to the 5th) for sway and heave. The bottom right graph shows the across-wind force coefficient (Cy) on the y-axis from -1.5 to 1.5 and Reynolds number on the x-axis from 0 to 5x10(to the 5th). The four rings of pressure taps, the mean of four rings, and the coefficient derived from displacement are plotted as separate curves.
Figure 140. Graph. Response of the cable as a function of wind speed or Reynolds number as measured by the lasers, accelerometers, and surface pressures for run 197.


These four graphs show the run 197 mean displacement and peak factor from the laser, motion path at one wind speed, and intensity of turbulence measured at the entrance of the test section. The top left graph shows displacement on the y-axis from 0 to 14 mm and wind speed on the x-axis from 0 to 50 m/s for sway and heave. The top right graph shows the motion path in the along-wind direction on the x-axis from -60 to 60 mm and the across-wind direction on the y-axis from -60 to 60 mm for the top and bottom ends of the cable model at a specific wind speed. The bottom left graph shows the peak factor on the y-axis from 1.5 to 4.5 and Reynolds number on the x-axis from 0 to 5x10(to the 5th) for sway and heave. The bottom right graph shows the motion path in sway on the x-axis from -60 to 60 mm and heave on the y-axis from -60 to 60 mm for the top and bottom ends of the cable model at a specific wind speed.
Figure 141. Graph. Mean displacement and peak factor from the laser, motion path at one wind speed, and intensity of turbulence measured at the entrance of the test section for run 197.


These four graphs show the run 199 response of the cable as a function of wind speed or Reynolds number  as measured by the lasers, accelerometers, and surface pressures. The top left graph shows the displacement amplitude on the y-axis from 0 to 100 mm and wind speed on the x-axis from 0 to 48 m/s for sway, heave, end-to-end sway, and end-to-end heave. The top right graph shows the along-wind force coefficient (Cx) on the y-axis from 0 to 1.5 and wind speed on the x-axis from 0 to 48 m/s. The four rings of pressure taps, the mean of four rings, and the coefficient derived from displacement are plotted as separate curves. The bottom left graph shows the acceleration amplitude on the y-axis from 0 to 3 m/s2 and Reynolds number on the x-axis from 0 to 5x10(to the 5th) for sway and heave. The bottom right graph shows the across-wind force coefficient (Cy) on the y-axis from -1.5 to 1.5 and Reynolds number on the x-axis from 0 to 5x10(to the 5th). The four rings of pressure taps, the mean of four rings, and the coefficient derived from displacement are plotted as separate curves.
Figure 142. Graph. Response of the cable as a function of wind speed or Reynolds number as measured by the lasers, accelerometers, and surface pressures for run 199.


These four graphs show the run 199 mean displacement and peak factor from the laser, motion path at one wind speed, and intensity of turbulence measured at the entrance of the test section. The top left graph shows displacement on the y-axis from -2 to 14 mm and wind speed on the x-axis from 0 to 50 m/s for sway and heave. The top right graph shows the motion path in the along-wind direction on the x-axis from -60 to 60 mm and the across-wind direction on the y-axis from -60 to 60 mm for the top and bottom ends of the cable model at a specific wind speed. The bottom left graph shows the peak factor on the y-axis from 1.5 to 3.5 and Reynolds number on the x-axis from 0 to 5x10(to the 5th) for sway and heave. The bottom right graph shows the motion path in sway on the x-axis from -60 to 60 mm and heave on the y-axis from -60 to 60 mm for the top and bottom ends of the cable model at a specific wind speed.
Figure 143. Graph. Mean displacement and peak factor from the laser, motion path at one wind speed, and intensity of turbulence measured at the entrance of the test section for run 199.


These four graphs show the run 203 response of the cable as a function of wind speed or Reynolds number as measured by the lasers, accelerometers, and surface pressures. The top left graph shows the displacement amplitude on the y-axis from 0 to 100 mm and wind speed on the x-axis from 0 to 48 m/s for sway, heave, end-to-end sway, and end-to-end heave. The top right graph shows the along-wind force coefficient (Cx) on the y-axis from 0 to 1.5 and wind speed on the x-axis from 0 to 48 m/s. The four rings of pressure taps, the mean of four rings, and the coefficient derived from displacement are plotted as separate curves. The bottom left graph shows the acceleration amplitude on the y-axis from 0 to 30 m/s2 and Reynolds number on the x-axis from 0 to 5x10(to the 5th) for sway and heave. The bottom right graph shows the across-wind force coefficient (Cy) on the y-axis from -1.5 to 1.5 and Reynolds number on the x-axis from 0 to 5x10(to the 5th). The four rings of pressure taps, the mean of four rings, and the coefficient derived from displacement are plotted as separate curves.
Figure 144. Graph. Response of the cable as a function of wind speed or Reynolds number as measured by the lasers, accelerometers, and surface pressures for run 203.


These four graphs show the run 203 mean displacement and peak factor from the laser, motion path at one wind speed, and intensity of turbulence measured at the entrance of the test section. The top left graph shows displacement on the y-axis from 0 to 14 mm and wind speed on the x-axis from 0 to 50 m/s for sway and heave. The top right graph shows the motion path in the along-wind direction on the x-axis from -100 to 100 mm and the across-wind direction on the y-axis from -150 to 150 mm for the top and bottom ends of the cable model at a specific wind speed. The bottom left graph shows the peak factor on the y-axis from 1.5 to 4 and Reynolds number on the x-axis from 0 to 5x10(to the 5th) for sway and heave. The bottom right graph shows the motion path in sway on the x-axis from -100 to 100 mm and heave on the y-axis from -150 to 150 mm for the top and bottom ends of the cable model at a specific wind speed.
Figure 145. Graph. Mean displacement and peak factor from the laser, motion path at one wind speed, and intensity of turbulence measured at the entrance of the test section for run 203.


These four graphs show the run 206 response of the cable as a function of wind speed or Reynolds number as measured by the lasers, accelerometers, and surface pressures. The top left graph shows the displacement amplitude on the y-axis from 0 to 100 mm and wind speed on the x-axis from 0 to 48 m/s for sway, heave, end-to-end sway, and end-to-end heave. The top right graph shows the along-wind force coefficient (Cx) on the y-axis from 0 to 1.5 and wind speed on the x-axis from 0 to 48 m/s. The four rings of pressure taps, the mean of four rings, and the coefficient derived from displacement are plotted as separate curves. The bottom left graph shows the acceleration amplitude on the y-axis from 0 to 3 m/s2 and Reynolds number on the x-axis from 0 to 5x10(to the 5th) for sway and heave. The bottom right graph shows the across-wind force coefficient (Cy) on the y-axis from -1.5 to 1.5 and Reynolds number on the x-axis from 0 to 5x10(to the 5th). The four rings of pressure taps, the mean of four rings, and the coefficient derived from displacement are plotted as separate curves.
Figure 146. Graph. Response of the cable as a function of wind speed or Reynolds number as measured by the lasers, accelerometers, and surface pressures for run 206.


These four graphs show the run 206 mean displacement and peak factor from the laser, motion path at one wind speed, and intensity of turbulence measured at the entrance of the test section. The top left graph shows displacement on the y-axis from 0 to 14 mm and wind speed on the x-axis from 0 to 50 m/s for sway and heave. The top right graph shows the motion path in the along-wind direction on the x-axis from -20 to 20 mm and the across-wind direction on the y-axis from -20 to 20 mm for the top and bottom ends of the cable model at a specific wind speed. The bottom left graph shows the peak factor on the y-axis from 1.5 to 4 and Reynolds number on the x-axis from 0 to 5x10(to the 5th) for sway and heave. The bottom right graph shows the motion path in sway on the x-axis from -20 to 20 mm and heave on the y-axis from -20 to 20 mm for the top and bottom ends of the cable model at a specific wind speed.
Figure 147. Graph. Mean displacement and peak factor from the laser, motion path at one wind speed, and intensity of turbulence measured at the entrance of the test section for run 206.


These four graphs show the run 208 response of the cable as a function of wind speed or Reynolds number  as measured by the lasers, accelerometers, and surface pressures. The top left graph shows the displacement amplitude on the y-axis from 0 to 100 mm and wind speed on the x-axis from 0 to 48 m/s for sway, heave, end-to-end sway, and end-to-end heave. The top right graph shows the along-wind force coefficient (Cx) on the y-axis from 0 to 1.5 and wind speed on the x-axis from 0 to 48 m/s. The four rings of pressure taps, the mean of four rings, and the coefficient derived from displacement are plotted as separate curves. The bottom left graph shows the acceleration amplitude on the y-axis from 0 to 5 m/s2 and Reynolds number on the x-axis from 0 to 5x10(to the 5th) for sway and heave. The bottom right graph shows the across-wind force coefficient (Cy) on the y-axis from -1.5 to 1.5 and Reynolds number on the x-axis from 0 to 5x10(to the 5th). The four rings of pressure taps, the mean of four rings, and the coefficient derived from displacement are plotted as separate curves.
Figure 148. Graph. Response of the cable as a function of wind speed or Reynolds number as measured by the lasers, accelerometers, and surface pressures for run 208.


These four graphs show the run 208 mean displacement and peak factor from the laser, motion path at one wind speed, and intensity of turbulence measured at the entrance of the test section. The top left graph shows displacement on the y-axis from -2 to 14 mm and wind speed on the x-axis from 0 to 50 m/s for sway and heave. The top right graph shows the motion path in the along-wind direction on the x-axis from -30 to 30 mm and the across-wind direction on the y-axis from -30 to 30 mm for the top and bottom ends of the cable model. The bottom left graph shows the peak factor on the y-axis from 1 to 6 and Reynolds number on the x-axis from 0 to 5x10(to the 5th) for sway and heave.The bottom middle graph shows the motion path in sway on the x-axis from -30 to 30 mm and heave on the y-axis from -30 to 30 mm for the top and bottom ends of the cable model at a specific wind speed.
Figure 149. Graph. Mean displacement and peak factor from the laser, motion path at one wind speed, and intensity of turbulence measured at the entrance of the test section for run 208.


These four graphs show the run 211 response of the cable as a function of wind speed or Reynolds number as measured by the lasers, accelerometers, and surface pressures. The top left graph shows the displacement amplitude on the y-axis from 0 to 100 mm and wind speed on the x-axis from 0 to 48 m/s for sway, heave, end-to-end sway, and end-to-end heave. The top right graph shows the along-wind force coefficient (Cx) on the y-axis from 0 to 1.5 and wind speed on the x-axis from 0 to 48 m/s. The four rings of pressure taps, the mean of four rings, and the coefficient derived from displacement are plotted as separate curves. The bottom left graph shows the acceleration amplitude on the y-axis from 0 to 36 m/s2 and Reynolds number on the x-axis from 0 to 5x10(to the 5th) for sway and heave. The bottom right graph shows the across-wind force coefficient (Cy) on the y-axix from -1.5 to 1.5 and Reynolds number on the x-axis from 0 to 5x10(to the 5th). The four rings of pressure taps, the mean of four rings, and the coefficient derived from displacement are plotted as separate curves.
Figure 150. Graph. Response of the cable as a function of wind speed or Reynolds number as measured by the lasers, accelerometers, and surface pressures for run 211.


These four graphs show the run 211 mean displacement and peak factor from the laser, motion path at one wind speed, and intensity of turbulence measured at the entrance of the test section. The top left graph shows displacement on the y-axis from -2 to 10 mm and wind speed on the x-axis from 0 to 50 mm for sway and heave. The top right graph shows the motion path in the along-wind direction on the x-axis from -100 to 100 mm and the across-wind direction on the y-axis from -150 to 150 mm for the top and bottom ends of the cable model at a specific wind speed. The bottom left graph shows the peak factor on the y-axis from 1.5 to 5.5 and Reynolds number on the x-axis from 0 to 5x10(to the 5th) for sway and heave. The bottom middle graph shows the motion path in sway on the x-axis from -100 to 100 mm and heave on the y-axis from -150 to 150 mm for the top and bottom ends of the cable model at a specific wind speed.
Figure 151. Graph. Mean displacement and peak factor from the laser, motion path at one wind speed, and intensity of turbulence measured at the entrance of the test section for run 211.


These four graphs show the run 214 response of the cable as a function of wind speed or Reynolds number  as measured by the lasers, accelerometers, and surface pressures. The top left graph shows the displacement amplitude on the y-axis from 0 to 100 mm and wind speed on the x-axis from 0 to 48 m/s for sway, heave, end-to-end sway, and end-to-end heave. The top right graph shows the along-wind force coefficient (Cx) on the y-axis from 0 to 1.5 and wind speed on the x-axis from 0 to 48 m/s. The four rings of pressure taps, the mean of four rings, and the coefficient derived from displacement are plotted as separate curves. The bottom left graph shows the acceleration amplitude on the y-axis from 0 to 8 m/s2 and Reynolds number on the x-axis from 0 to 5x10(to the 5th) for sway and heave. The bottom right graph shows the across-wind force coefficient (Cy) on the y-axis from -1.5 to 1.5 and Reynolds number on the x-axis from 0 to 5x10(to the 5th). The four rings of pressure taps, the mean of four rings, and the coefficient derived from displacement are plotted as separate curves.
Figure 152. Graph. Response of the cable as a function of wind speed or Reynolds number as measured by the lasers, accelerometers, and surface pressures for run 214.


These four graphs show the run 214 mean displacement and peak factor from the laser, motion path at one wind speed, and intensity of turbulence measured at the entrance of the test section. The top left graph shows displacement on the y-axis from -2 to 10 mm and wind speed on the x-axis from 0 to 50 m/s for sway and heave. The top right graph shows the motion path in the along-wind direction on the x-axis from -50 to 50 mm and the across-wind direction on the y-axis from -50 to 50 mm for the top and bottom ends of the cable model at a specific wind speed. The bottom left graph shows the peak factor on the y-axis from 1 to 4 and Reynolds number on the x-axis from 0 to 5x10(to the 5th) for sway and heave. The bottom right graph shows the motion path in sway on the x-axis from -50 to 50 mm and heave on the y-axis from -50 to 50 mm for the top and bottom ends of the cable model at a specific wind speed.
Figure 153. Graph. Mean displacement and peak factor from the laser, motion path at one wind speed, and intensity of turbulence measured at the entrance of the test section for run 214.


These four graphs show the run 216 response of the cable as a function of wind speed or Reynolds number as measured by the lasers, accelerometers, and surface pressures. The top left graph shows the displacement amplitude on the y-axis from 0 to 100 mm and wind speed on the x-axis from 0 to 48 m/s for sway, heave, end-to-end sway, and end-to-end heave. The top right graph shows the along-wind force coefficient (Cx) on the y-axis from 0 to 1.5 and wind speed on the x-axis from 0 to 48 m/s. The four rings of pressure taps, the mean of four rings, and the coefficient derived from displacement are plotted as separate curves. The bottom left graph shows the acceleration amplitude on the y-axis from 0 to 7 m/s2 and Reynolds number on the x-axis from 0 to 5x10(to the 5th) for sway and heave. The bottom right graph shows the across-wind force coefficient (Cy) on the y-axis from -1.5 to 1.5 and Reynolds number on the x-axis from 0 to 5x10(to the 5th). The four rings of pressure taps, the mean of four rings, and the coefficient derived from displacement are plotted as separate curves.
Figure 154. Graph. Response of the cable as a function of wind speed or Reynolds number as measured by the lasers, accelerometers, and surface pressures for run 216.


These four graphs show the run 216 mean displacement and peak factor from the laser, motion path at one wind speed, and intensity of turbulence measured at the entrance of the test section. The top left graph shows displacement on the y-axis from -2 to 10 mm and wind speed on the x-axis from 0 to 50 m/s for sway and heave. The top right graph shows the motion path in the along-wind direction on the x-axis from -50 to 50 mm and the across-wind direction on the y-axis from -60 to 60 mm for the top and bottom ends of the cable model at a specific wind speed. The bottom left graph shows the peak factor on the y-axis from 1.5 to 4 and Reynolds number on the x-axis from 0 to 5x10(to the 5th) for sway and heave. The bottom right graph shows the motion path in sway on the x-axis from -50 to 50 mm and heave on the y-axis from -60 to 60 mm for the top and bottom ends of the cable model at a specific wind speed.
Figure 155. Graph. Mean displacement and peak factor from the laser, motion path at one wind speed, and intensity of turbulence measured at the entrance of the test section for run 216.


These four graphs show the run 219 response of the cable as a function of wind speed or Reynolds number as measured by the lasers, accelerometers, and surface pressures. The top left graph shows the displacement amplitude on the y-axis from 0 to 100 mm and wind speed on the x-axis from 0 to 48 m/s for sway, heave, end-to-end sway, and end-to-end heave. The top right graph shows the along-wind force coefficient (Cx) on the y-axis from 0 to 1.5 and wind speed on the x-axis from 0 to 48 m/s. The four rings of pressure taps, the mean of four rings, and the coefficient derived from displacement are plotted as separate curves. The top left graph shows the acceleration amplitude on the y-axis from 0 to 4 m/s2 and Reynolds number on the x-axis from 0 to 5x10(to the 5th) for sway and heave. The bottom right graph shows the across-wind force coefficient (Cy) on the y-axis from -1.5 to 1.5 and Reynolds number on the x-axis from 0 to 5x10(to the 5th). The four rings of pressure taps, the mean of four rings, and the coefficient derived from displacement are plotted as separate curves.
Figure 156. Graph. Response of the cable as a function of wind speed or Reynolds number as measured by the lasers, accelerometers, and surface pressures for run 219.


These four graphs show the run 219 mean displacement and peak factor from the laser, motion path at one wind speed, and intensity of turbulence measured at the entrance of the test section. The top left graph shows displacement on the y-axis from -2 to 12 mm and wind speed on the x-axis from 0 to 50 m/s for sway and heave. The top right graph shows the motion path in the along-wind direction on the x-axis from -50 to 50 mm and the across-wind direction on the y-axis from -50 to 50 mm for the top and bottom ends of the cable model at a specific wind speed. The bottom left graph shows the peak factor on the y-axis from 1.5 to 4.5 and Reynolds number on the x-axis from 0 to 5x10(to the 5th). The bottom right graph shows the motion path in sway on the x-axis from -50 to 50 mm and heave on the y-axis from -50 to 50 mm for the top and bottom ends of the cable model at a specific wind speed.
Figure 157. Graph. Mean displacement and peak factor from the laser, motion path at one wind speed, and intensity of turbulence measured at the entrance of the test section for run 219.


These four graphs show the run 222 response of the cable as a function of wind speed or Reynolds number  as measured by the lasers, accelerometers, and surface pressures. The top left graph shows the displacement amplitude on the y-axis from 0 to 100 mm and wind speed on the x-axis from 0 to 48 m/s for sway, heave, end-to-end sway, and end-to-end heave. The top right graph shows the along-wind force coefficient (Cx) on the y-axis from 0 to 1.5 and wind speed from 0 to 48 m/s. The four rings of pressure taps, the mean of four rings, and the coefficient derived from displacement are plotted as separate curves. The bottom left graph shows the acceleration amplitude on the y-axis from 0 to 6 m/s2 and Reynolds number on the x-axis from 0 to 5x10(to the 5th) for sway and heave. The bottom right graph shows the across-wind force coefficient (Cy) on the y-axis from -1.5 to 1.5 and Reynolds number on the x-axis from 0 to 5x10(to the 5th). The four rings of pressure taps, the mean of four rings, and the coefficient derived from displacement are plotted as separate curves.
Figure 158. Graph. Response of the cable as a function of wind speed or Reynolds number as measured by the lasers, accelerometers, and surface pressures for run 222.


These four graphs show the run 222 mean displacement and peak factor from the laser, motion path at one wind speed, and intensity of turbulence measured at the entrance of the test section. The top left graph shows displacement on the y-axis from -2 to 10 mm and wind speed on the x-axis from 0 to 50 m/s for sway and heave. The top right graph shows the motion path in the along-wind direction on the x-axis from -50 to 50 mm and the across-wind direction on the y-axis from -60 to 60 mm for the top and bottom ends of the cable model at a specific wind speed. The bottom left graph shows the peak factor on the y-axis from 1.5 to 4.5 and Reynolds number on the x-axis from 0 to 5x10(to the 5th) for sway and heave. The bottom right graph shows the motion path in sway on the x-axis from -50 to 50 mm and heave on the y-axis from -60 to 60 mm for the top  and bottom ends of the cable model at a specific wind speed.
Figure 159. Graph. Mean displacement and peak factor from the laser, motion path at one wind speed, and intensity of turbulence measured at the entrance of the test section for run 222.


These four graphs show the run 225 response of the cable as a function of wind speed or Reynolds number as measured by the lasers, accelerometers, and surface pressures. The top left graph shows the displacement amplitude on the y-axis from 0 to 100 mm and wind speed on the x-axis from 0 to 48 m/s for sway, heave, end-to-end sway, and end-to-end heave. The top right graph shows the along-wind force coefficient (Cx) on the y-axis from 0 to 1.5 and wind speed on the x-axis from 0 to 48 m/s. The four rings of pressure taps, the mean of four rings, and the coefficient derived from displacement are plotted as separate curves. The bottom left graph shows the acceleration amplitude on the y-axis from 0 to 6 m/s2 and Reynolds number on the x-axis from 0 to 5x10(to the 5th) for sway and heave. The bottom right graph shows the across-wind force coefficient (Cy) on the y-axis from -1.5 to 1.5 and Reynolds number on the x-axis from 0 to 5x10(to the 5th). The four rings of pressure taps, the mean of four rings, and the coefficient derived from displacement are plotted as separate curves.
Figure 160. Graph. Response of the cable as a function of wind speed or Reynolds number as measured by the lasers, accelerometers, and surface pressures for run 225.


These four graphs show the run 225 mean displacement and peak factor from the laser, motion path at one wind speed, and intensity of turbulence measured at the entrance of the test section. The top left graph shows displacement on the y-axis from -2 to 12 mm and wind speed on the x-axis from 0 to 50 m/s for sway and heave. The top right graph shows the motion path in the along-wind direction on the x-axis from -50 to 50 mm and the across-wind direction on the y-axis from -80 to 80 mm for the top and bottom ends of the cable model at a specific wind speed. The bottom left graph shows the peak factor on the y-axis from 1 to 4 and Reynolds number on the x-axis from 0 to 5x10(to the 5th) for sway and heave. The bottom right graph shows the motion path in sway on the x-axis from -50 to 50 mm and heave on the y-axis from -80 to 80 mm for the top and bottom ends of the cable model at a specific wind speed.
Figure 161. Graph. Mean displacement and peak factor from the laser, motion path at one wind speed, and intensity of turbulence measured at the entrance of the test section for run 225.


These four graphs show the run 226 response of the cable as a function of wind speed or Reynolds number as measured by lasers, the accelerometers, and surface pressures. The top left graph shows the displacement amplitude on the y-axis from 0 to 100 mm and wind speed on the x-axis from 0 to 48 m/s for sway, heave, end-to-end sway, and end-to-end heave. The top right graph shows the along-wind force coefficient (Cx) on the y-axis from 0 to 1.5 and wind speed on the x-axis from 0 to 48 m/s. The four rings of pressure taps, the mean of four rings, and the coefficient derived from displacement are plotted as separate curves. The bottom left graph shows the acceleration amplitude on the y-axis from 0.05 to 0.25 m/s2 and Reynolds number on the y-axis from 0 to 5x10(to the 5th) for sway and heave. The bottom right graph shows the across-wind force coefficient (Cy) on the y-axis from -1.5 to 1.5 and Reynolds number on the x-axis from 0 to 5x10(to the 5th). The four rings of pressure taps, the mean of four rings, and the coefficient derived from displacement are plotted as separate curves.
Figure 162. Graph. Response of the cable as a function of wind speed or Reynolds number as measured by the lasers, accelerometers, and surface pressures for run 226.


These four graphs show the run 226 mean displacement and peak factor from the laser, motion path at one wind speed, and intensity of turbulence measured at the entrance of the test section. The top left graph shows displacement on the y-axis from 0 to 1.4 mm and wind speed on the x-axis from 0 to 50 m/s for sway and heave. The top right graph shows the motion path in the along-wind direction on the x-axis from -10 to 10 mm and the across-wind direction on the y-axis from -10 to 10 mm for the top and bottom ends of the cable model at a specific wind speed. The bottom left graph shows the peak factor on the y-axis from 2.2 to 3.8 and Reynolds number on the x-axis from 0 to 5x10(to the 5th) for sway and heave. The bottom right graph shows the motion path in sway on the x-axis from -10 to 10 mm and heave on the y-axis from -10 to 10 mm for the top and bottom ends of the cable model at a specific wind speed.
Figure 163. Graph. Mean displacement and peak factor from the laser, motion path at one wind speed. and intensity of turbulence measured at the entrance of the test section for run 226.


These four graphs show the run 230 response of the cable as a function of wind speed or Reynolds number as measured by the lasers, accelerometers, and surface pressures. The top left graph shows the displacement amplitude on the y-axis from 0 to 100 mm and wind speed on the x-axis from 0 to 48 m/s for sway, heave, end-to-end sway, and end-to-end heave. The top right graph shows the along-wind force coefficient (Cx) on the y-axis from 0 to 1.5 and wind speed on the x-axis from 0 to 48 m/s. The four rings of pressure taps, the mean of four rings, and the coefficient derived from displacement are plotted as separate curves. The bottom left graph shows the acceleration amplitude on the y-axis from 0 to 5 m/s2 and Reynolds number on the x-axis from 0 to 5x10(to the 5th) for sway and heave. The bottom right graph shows the across-wind force coefficient (Cy) -1.5 to 1.5 and Reynolds number on the x-axis from 0 to 5x10(to the 5th). The four rings of pressure taps, the mean of four rings, and the coefficient derived from displacement are plotted as separate curves.
Figure 164. Graph. Response of the cable as a function of wind speed or Reynolds number as measured by the lasers, accelerometers, and surface pressures for run 230.


These five graphs show the run 230 mean displacement and peak factor from the laser, motion path at one wind speed, and intensity of turbulence measured at the entrance of the test section. The top left graph shows displacement on the y-axis from -2 to 10 mm and wind speed on the x-axis from 0 to 50 m/s for sway and heave. The top middle graph shows the motion path in the along-wind direction on the x-axis from -100 to 100 mm and the across-wind direction on the y-axis from -100 to 100 mm for the top and bottom ends of the cable model at a specific wind speed. The top right graph shows the turbulence intensity in the along-wind direction measured by the Cobra Probe upstream of the cable model. Turbulence intensity is on the y-axis from 0 to 20 percent, and wind speed is on the x-axis from 0 to 50 m/s. The bottom left graph shows the peak factor on the y-axis from 1 to 4.5 and Reynolds number on the x-axis from 0 to 5x10(to the 5th) for sway and heave. The bottom middle graph shows the motion path in sway on the x-axis from -100 to 100 mm and heave on the y-axis from -100 to 100 mm for the top and bottom ends of the cable model at a specific wind speed.
Figure 165. Graph. Mean displacement and peak factor from the laser, motion path at one wind speed, and intensity of turbulence measured at the entrance of the test section for run 230.


These four graphs show the run 234 response of the cable as a function of wind speed or Reynolds number as measured by the lasers, accelerometers, and surface pressures. The top left graph shows the displacement amplitude on the y-axis from 0 to 100 mm and wind speed on the x-axis from 0 to 48 m/s for sway, heave, end-to-end sway, and end-to-end heave. The top right graph shows the along-wind force coefficient (Cx) on the y-axis from 0 to 1.5 and wind speed on the x-axis from 0 to 48 m/s. The four rings of pressure taps, the mean of four rings, and the coefficient derived from displacement are plotted as separate curves. The bottom left graph shows the acceleration amplitude on the y-axis from 0 to 3.5 m/s2 and Reynolds number on the x-axis from 0 to 5x10(to the 5th) for sway and heave. The bottom right graph shows the across-wind force coefficient (Cy) on the y-axis from -1.5 to 1.5 and Reynolds number on the x-axis from 0 to 5x10(to the 5th). The four rings of pressure taps, the mean of four rings, and the coefficient derived from displacement are plotted as separate curves.
Figure 166. Graph. Response of the cable as a function of wind speed or Reynolds number as measured by the lasers, accelerometers, and surface pressures for run 234.


These five graphs show the run 234 mean displacement and peak factor from the laser, motion path at one wind speed, and intensity of turbulence measured at the entrance of the test section. The top left graph shows displacement on the y-axis from -4 to 10 mm and wind speed on the x-axis from 0 to 50 m/s for sway and heave. The top middle graph shows the motion path in the along-wind direction on the x-axis from -50 to 50 mm and the across-wind direction on the y-axis from -80 to 80 mm for the top and bottom ends of the cable model at a specific wind speed. The top right graph shows the turbulence intensity in the along-wind direction measured by the Cobra Probe upstream of the cable model. Turbulence intensity is on the y-axis from 0 to 20 percent, and wind speed is on the x-axis from 0 to 50 m/s. The bottom left graph shows the peak factor on the y-axis from 1 to 4 and Reynolds number on the x-axis from 0 to 5x10(to the 5th) for sway and heave. The bottom middle graph shows the motion path in sway on the x-axis from -50 to 50 mm and heave on the y-axis from -80 to 80 mm for the top and bottom ends of the cable model at a specific wind speed.
Figure 167. Graph. Mean displacement and peak factor from the laser, motion path at one wind speed, and intensity of turbulence measured at the entrance of the test section for run 234.


These four graphs show the run 237 response of the cable as a function of wind speed or Reynolds number as measured by the lasers, accelerometers, and surface pressures. The top left graph shows the displacement amplitude on the y-axis from 0 to 100 mm and wind speed on the x-axis from 0 to 48 m/s for sway, heave, end-to-end sway, and end-to-end heave.The top right graph shows the along-wind force coefficient (Cx) on the y-axis from 0 to 1.5 and wind speed on the x-axis from 0 to 48 m/s. The four rings of pressure taps, the mean of four rings, and the coefficient derived from displacement are plotted as separate curves. The bottom left graph shows the acceleration amplitude on the y-axis from 0 to 3 m/s2 and Reynolds number on the x-axis from 0 to 5x10(to the 5th) for sway and heave. The bottom right graph shows the across-wind force coefficient (Cy) on the y-axis from -1.5 to 1.5 and Reynolds number on the x-axis from 0 to 5x10(to the 5th). The four rings of pressure taps, the mean of four rings, and the coefficient derived from displacement are plotted as separate curves.
Figure 168. Graph. Response of the cable as a function of wind speed or Reynolds number as measured by the lasers, accelerometers, and surface pressures for run 237.


These five graphs show the run 237 mean displacement and peak factor from the laser, motion path at one wind speed, and intensity of turbulence measured at the entrance of the test section. The top left graph shows displacement on the y-axis from -4 to 10 mm and wind speed on the x-axis from 0 to 50 m/s for sway and heave. The top middle graph shows the motion path in the along-wind direction on the x-axis from -50 to 50 mm and the across-wind direction on the y-axis from -60 to 60 mm for the top and bottom ends of the cable model at a specific wind speed. The top right graph shows the turbulence intensity in the along-wind direction measured by the Cobra Probe upstream of the cable model. Turbulence intensity is on the y-axis from 0 to 30 percent, and wind speed is on the x-axis from 0 to 50 m/s. The bottom left graph shows the peak factor on the y-axis from 1 to 4.5 and Reynolds number on the x-axis from 0 to 5x10(to the 5th) for sway and heave. The bottom middle graph shows the motion path in sway on the x-axis from -50 to 50 mm and heave on the y-axis from -60 to 60 mm for the top and bottom ends of the cable model at a specific wind speed.
Figure 169. Graph. Mean displacement and peak factor from the laser, motion path at one wind speed, and intensity of turbulence measured at the entrance of the test section for run 237.


These four graphs show the run 239 response of the cable as a function of wind speed or Reynolds number as measured by the lasers, accelerometers, and surface pressures. The top left graph shows the displacement amplitude on the y-axis from 0 to 100 mm and wind speed on the x-axis from 0 to 48 m/s for sway, heave, end-to-end sway, and end-to-end heave. The top right graph shows the along-wind force coefficient (Cx) on the y-axis from 0 to 1.5 and wind speed on the x-axis from 0 to 48 m/s. The four rings of pressure taps, the mean of four rings, and the coefficient derived from displacement are plotted as separate curves. The bottom left graph shows the acceleration amplitude on the y-axis from 0 to 2 m/s2 and Reynolds number on the x-axis from 0 to 5x10(to the 5th) for sway and heave. The bottom right graph shows the across-wind force coefficient (Cy) on the y-axis from -1.5 to 1.5 and Reynolds number on the x-axis from 0 to 5x10(to the 5th). The four rings of pressure taps, the mean of four rings, and the coefficient derived from displacement are plotted as separate curves.
Figure 170. Graph. Response of the cable as a function of wind speed or Reynolds number as measured by the lasers, accelerometers, and surface pressures for run 239.


These five graphs show the run 239 mean displacement and peak factor from the laser, motion path at one wind speed, and intensity of turbulence measured at the entrance of the test section. The top left graph shows displacement on the y-axis from -2 to 6 mm and and wind speed on the x-axis from 0 to 50 m/s for sway and heave. The top middle graph shows the motion path in the along-wind direction on the x-axis from -30 to 30 mm and the across-wind direction on the y-axis from -30 to 30 mm for the top and bottom ends of the cable model at a specific wind speed. The top right graph shows the turbulence intensity in the along-wind direction measured by the Cobra Probe upstream of the cable model. Turbulence intensity is on the y-axis from 0 to 25 percent, and wind speed is on the x-axis from 0 to 50 m/s. The bottom left graph shows the peak factor on the y-axis from 1.5 to 4 and Reynolds number on the x-axis from 0 to 5x10(to the 5th) for sway and heave. The bottom middle graph shows the motion path in sway on the x-axis from -30 to 30 mm and heave on the y-axis from -30 to 30 mm for the top and bottom ends of the cable model at a specific wind speed.
Figure 171. Graph. Mean displacement and peak factor from the laser, motion path at one wind speed, and intensity of turbulence measured at the entrance of the test section for run 239.


These four graphs show the run 244 response of the cable as a function of wind speed or Reynolds number as measured by the lasers, accelerometers, and surface pressures. The top left graph shows the displacement amplitude on the y-axis from 0 to 100 mm and wind speed on the x-axis from 0 to 48 m/s for sway, heave, end-to-end sway, and end-to-end heave. The top right graph shows the along-wind force coefficient (Cx) on the y-axis from 0 to 1.5 and wind speed on the x-axis from 0 to 48 m/s. The four rings of pressure taps, the mean of four rings, and the coefficient derived from displacement are plotted as separate curves. The bottom left graph shows the acceleration amplitude on the y-axis from 0 to 5 m/s2 and Reynolds number on the x-axis from 0 to 5x10(to the 5th) for sway and heave. The bottom right graph shows the across-wind force coefficient (Cy) on the y-axis from -1.5 to 1.5 and Reynolds number on the x-axis from 0 to 5x10(to the 5th). The four rings of pressure taps, the mean of four rings, and the coefficient derived from displacement are plotted as separate curves.
Figure 172. Graph. Response of the cable as a function of wind speed or Reynolds number as measured by the lasers, accelerometers, and surface pressures for run 244.


These five graphs show the run 244 mean displacement and peak factor from the laser, motion path at one wind speed, and intensity of turbulence measured at the entrance of the test section. The top left graph shows displacement on the y-axis from -4 to 10 mm and wind speed from 0 to 50 m/s for sway and heave. The top middle graph shows the motion path in the along-wind direction on the x-axis from -100 to 100 mm and the across-wind direction on the y-axis from -100 to 100 mm for the top and bottom ends of the cable model at a specific wind speed. The top right graph shows the turbulence intensity in the along-wind direction measured by the Cobra Probe upstream of the cable model. Turbulence intensity is on the y-axis from 0.25 to 0.45 percent, and wind speed is on the x-axis from 0 to 50 m/s. The bottom left graph shows the peak factor on the y-axis from 1 to 4 and Reynolds number on the x-axis from 0 to 5x10(to the 5th) for sway and heave. The bottom middle graph shows the motion path in sway on the x-axis from -100 to 100 mm and heave on the y-axis from -100 to 100 mm for the top and bottom ends of the cable model at a specific wind speed.
Figure 173. Graph. Mean displacement and peak factor from the laser, motion path at one wind speed, and intensity of turbulence measured at the entrance of the test section for run 244.


These three graphs show the run 248 intensity of turbulence measured at the entrance of the test section and along-wind and across-wind mean force coefficients (Cx and Cy) calculated from surface pressure measurements as a function of Reynolds number and wind speed. The top left graph shows the turbulence intensity in the along-wind direction measured at the entrance of the test section. Turbulence intensity is on the y-axis from 0 to 12 percent, and wind speed is on the x-axis from 0 to 48 m/s. The top right graph shows Cx on the y-axis from 0 to 1.5 and wind speed on the x-axis from 0 to 48 m/s. Results from the four rings of pressure taps and the mean of four rings are plotted as separate curves. The bottom right graph shows Cy on the y-axis from -1.5 to 1.5 and Reynolds number on the x-axis from 0 to 5x10(to the 5th). Results from the four rings of pressure taps and the mean of four rings are plotted as separate curves.
Figure 174. Graph. Intensity of turbulence measured at the entrance of the test section and Cx and Cy calculated from surface pressure measurements as a function of Reynolds number and wind speed for run 248.


These three graphs show the run 250 intensity of turbulence measured at the entrance of the test section and along-wind and across-wind mean force coefficients (Cx and Cy) calculated from surface pressure measurements as a function of Reynolds number and wind speed. The top left graph shows the turbulence intensity in the along-wind direction measured at the entrance of the test section. Turbulence intensity is on the y-axis from 0 to 25 percent, and wind speed is on the x-axis from 0 to 48 m/s. The top right graph shows Cx on the y-axis from 0 to 1.5 and wind speed on the x-axis from 0 to 48 m/s. Results from the four rings of pressure taps and the mean of four rings are plotted as separate curves. The bottom right graph shows Cy on the y-axis from -1.5 to 1.5 and Reynolds number on the x-axis from 0 to 5x10(to the 5th). Results from the four rings of pressure taps and the mean of four rings are plotted as separate curves.
Figure 175. Graph. Intensity of turbulence measured at the entrance of the test section and Cx and Cy calculated from surface pressure measurements as a function of Reynolds number and wind speed for run 250.


These four graphs show the run 253 response of the cable as a function of wind speed or Reynolds number  as measured by the lasers, accelerometers, and surface pressures. The top left graph shows the displacement amplitude on the y-axis from 0 to 100 mm and wind speed on the x-axis from 0 to 48 m/s for sway, heave, end-to-end sway, and end-to-end heave. The top right graph shows the along-wind force coefficient (Cx) on the y-axis from 0 to 1.5 and wind speed on the x-axis from 0 to 48 m/s. The four rings of pressure taps, the mean of four rings, and the coefficient derived from displacement are plotted as separate curves. The bottom left graph shows the acceleration amplitude on the y-axis from 0 to 2 m/s2 and Reynolds number on the x-axis from 0 to 5x10(to the 5th) for sway and heave. The bottom right graph shows the across-wind force coefficient (Cy) on the y-axis from -1.5 to 1.5 and Reynolds number on the x-axis from 0 to 5x10(to the 5th). The four rings of pressure taps, the mean of four rings, and the coefficient derived from displacement are plotted as separate curves.
Figure 176. Graph. Response of the cable as a function of wind speed or Reynolds number as measured by the lasers, accelerometers, and surface pressures for run 253.


These five graphs show the run 253 mean displacement and peak factor from the laser, motion path at one wind speed, and intensity of turbulence measured at the entrance of the test section. The top left graph shows displacement on the y-axis from -2 to 12 mm and wind speed on the x-axis from 0 to 50 m/s for sway and heave. The top middle graph shows the motion path in the along-wind direction on the x-axis from -30 to 30 mm and the across-wind direction on the y-axis from -30 to 30 mm for the top and bottom ends of the cable model at a specific wind speed. The top right graph shows the turbulence intensity in the along-wind direction measured by the Cobra Probe upstream of the cable model. Turbulence intensity is on the y-axis from 0 to 30 percent, and wind speed is on the x-axis from 0 to 50 m/s. The bottom left graph shows the peak factor on the y-axis from 1.5 to 4.5 and Reynolds number on the x-axis from 0 to 5x10(to the 5th) for sway and heave. The bottom middle graph shows the motion path in sway on the x-axis from -30 to 30 mm and heave on the y-axis from -30 to 30 mm for the top and bottom ends of the cable model at a specific wind speed.
Figure 177. Graph. Mean displacement and peak factor from the laser, motion path at one wind speed, and intensity of turbulence measured at the entrance of the test section for run 253.


These four graphs show the run 255 response of the cable as a function of wind speed or Reynolds number as measured by the lasers, accelerometers, and surface pressures. The top left graph shows the displacement amplitude on the y-axis from 0 to 100 mm and wind speed on the x-axis from 0 to 48 m/s for sway, heave, end-to-end sway, and end-to-end heave. The top right graph shows the along-wind force coefficient (Cx) on the y-axis from 0 to 1.5 and wind speed on the x-axis from 0 to 48 m/s. The four rings of pressure taps, the mean of four rings, and the coefficient derived from displacement are plotted as separate curves. The bottom left graph shows the acceleration amplitude on the y-axis from 0 to 4 m/s2 and Reynolds number on the x-axis from 0 to 5x10(to the 5th) for sway and heave. The bottom right graph shows the across-wind force coefficient (Cy) on the y-axis from -1.5 to 1.5 and Reynolds number on the x-axis from 0 to 5x10(to the 5th). The four rings of pressure taps, the mean of four rings, and the coefficient derived from displacement are plotted as separate curves.
Figure 178. Graph. Response of the cable as a function of wind speed or Reynolds number as measured by the lasers, accelerometers, and surface pressures for run 255.


These five graphs show the run 255 mean displacement and peak factor from the laser, motion path at one wind speed, and intensity of turbulence measured at the entrance of the test section. The top left graph shows displacement on the y-axis from -2 to 12 mm and wind speed on the x-axis from 0 to 50 m/s for sway and heave. The top middle graph shows the motion path in the along-wind direction on the x-axis from -60 to 60 mm and the across-wind direction on the y-axis from -60 to 60 mm for the top and bottom ends of the cable model at a specific wind speed. The top right graph shows the turbulence intensity in the along-wind direction measured by the Cobra Probe upstream of the cable model. Turbulence intensity is on the y-axis from 0 to 3 percent, and wind speed is on the x-axis from 0 to 50 m/s. The bottom left graph shows the peak factor on the y-axis from 1.5 to 4.5 and Reynolds number on the x-axis from 0 to 5x10(to the 5th) for sway and heave. The bottom middle graph shows the motion path in sway on the x-axis from -60 to 60 mm and heave on the y-axis from -60 to 60 mm for the top and bottom ends of the cable model at a specific wind speed.
Figure 179. Graph. Mean displacement and peak factor from the laser, motion path at one wind speed, and intensity of turbulence measured at the entrance of the test section for run 255.


These four graphs show the run 257 response of the cable as a function of wind speed or Reynolds number  as measured by the lasers, accelerometers, and surface pressures. The top left graph shows the displacement amplitude on the y-axis from 0 to 100 mm and wind speed on the x-axis from 0 to 48 m/s for sway, heave, end-to-end sway, and end-to-end heave. The top right graph shows the along-wind force coefficient (Cx) on the y-axis from 0 to 1.5 and wind speed on the x-axis from 0 to 48 m/s. The four rings of pressure taps, the mean of four rings, and the coefficient derived from displacement are plotted as separate curves. The bottom left graph shows the acceleration amplitude on the y-axis from 0 to 3.5 m/s2 and Reynolds number on the x-axis from 0 to 5x10(to the 5th) for sway and heave. The bottom right graph shows the across-wind force coefficient (Cy) on the y-axis from -1.5 to 1.5 and Reynolds number on the x-axis from 0 to 5x10(to the 5th). The four rings of pressure taps, the mean of four rings, and the coefficient derived from displacement are plotted as separate curves.
Figure 180. Graph. Response of the cable as a function of wind speed or Reynolds number as measured by the lasers, accelerometers, and surface pressures for run. 257.


These five graphs show the run 257 mean displacement and peak factor from the laser, motion path at one wind speed, and intensity of turbulence measured at the entrance of the test section. The top left graph shows displacement on the y-axis from -2 to 12 mm and wind speed on the x-axis from 0 to 50 m/s for sway and heave. The top middle graph shows the motion path in the along-wind direction on the x-axis from -50 to 50 mm and the across-wind direction on the y-axis from -60 to 60 mm for the top and bottom ends of the cable model at a specific wind speed. The top right graph shows the turbulence intensity in the along-wind direction measured by the Cobra Probe upstream of the cable model. Turbulence intensity is on the y-axis from 0 to 14 percent, and wind speed is on the x-axis from 0 to 50 m/s. The bottom left graph shows the peak factor on the y-axis from 1 to 4.5 and Reynolds number on the x-axis from 0 to 5x10(to the 5th) for sway and heave. The bottom middle graph shows the motion path in sway on the x-axis from -50 to 50 mm and heave on the y-axis from -60 to 60 mm for the top and bottom ends of the cable model at a specific wind speed.
Figure 181. Graph. Mean displacement and peak factor from the laser, motion path at one wind speed, and intensity of turbulence measured at the entrance of the test section for run 257.


These four graphs show the run 260 response of the cable as a function of wind speed or Reynolds number as measured by the lasers, accelerometers, and surface pressures. The top left graph shows the displacement amplitude on the y-axis from 0 to 100 mm and wind speed on the x-axis from 0 to 48 m/s for sway, heave, end-to-end sway, and end-to-end heave. The top right graph shows the along-wind force coefficient (Cx) on the y-axis from 0 to 1.5 and wind speed on the x-axis from 0 to 48 m/s. The four rings of pressure taps, the mean of four rings, and the coefficient derived from displacement are plotted as separate curves. The bottom left graph shows the acceleration amplitude on the y-axis from 0 to 3.5 m/s2 and Reynolds number on the x-axis from 0 to 5x10(to the 5th) for sway and heave. The bottom right graph shows the across-wind force coefficient (Cy) on the y-axis from -1.5 to 1.5 and Reynolds number on the x-axis from 0 to 5x10(to the 5th). The four rings of pressure taps, the mean of four rings, and the coefficient derived from displacement are plotted as separate curves.
Figure 182. Graph. Response of the cable as a function of wind speed or Reynolds number as measured by the lasers, accelerometers, and surface pressures for run 260.


These five graphs show the run 260 mean displacement and peak factor from the laser, motion path at one wind speed, and intensity of turbulence measured at the entrance of the test section. The top left graph shows displacement on the y-axis from -2 to 12 mm and wind speed on the x-axis from 0 to 50 m/s for sway and heave. The top middle graph shows the motion path in the along-wind direction on the x-axis from -40 to 40 mm and the across-wind direction on the y-axis from -40 to 40 mm for the top and bottom ends of the cable model at a specific wind speed. The top right graph shows the turbulence intensity in the along-wind direction measured by the Cobra Probe upstream of the cable model. Turbulence intensity is on the y-axis from 0 to 10 percent, and wind speed is on the x-axis from 0 to 50 m/s. The bottom left graph shows the peak factor on the y-axis from 1.5 to 5 and Reynolds number on the x-axis from 0 to 5x10(to the 5th) for sway and heave. The bottom middle graph shows the motion path in sway on the x-axis from -40 to 40 mm and heave on the y-axis from -40 to 40 mm for the top and bottom ends of the cable model at a specific wind speed.
Figure 183. Graph. Mean displacement and peak factor from the laser, motion path at one wind speed, and intensity of turbulence measured at the entrance of the test section for run 260.


These four graphs show the damping traces and damping level for the sway and heave modes for the low damping level case. The top left graph shows the time history of the displacement of the sway mode. Amplitude is on the y-axis from -80 to 80 mm, and time is on the x-axis from 0 to 300 s. The top right graph shows the time history of the displacement of the heave mode. Amplitude is on the y-axis from -40 to 60 mm, and time is on the x-axis from 0 to 300 s. The bottom left graph shows the damping ratio in percentage of critical damping and amplitude for the sway mode. Damping percent of critical is on the y-axis from 0 to 1 percent, and amplitude is on the x-axis from 0 to 70 mm. The bottom right graph shows the damping ratio in percentage of critical damping and amplitude for the heave mode. Damping percent of the critical is on the y-axis from 0 to 1 percent, and amplitude is on the x-axis from 0 to 35 mm. Damping ratios generally increase with increasing vibration amplitude.
Figure 184. Damping traces and level for the sway and heave modes for the low damping level case.


These graphs show the damping traces and damping level for the sway and heave modes for the medium damping case. The top left graph shows the time history of the displacement of the sway mode. Amplitude is on the y-axis from -80 to 80 mm, and time is on the x-axis from 0 to 300 s. The top right graph shows the time history of the displacement of the heave mode. Amplitude is on the y-axis from -40 to 60 mm, and time is on the x-axis from 0 to 300 s. The bottom left graph shows the damping ratio in percentage of critical damping and amplitude for the sway mode. Damping percent of critical is on the y-axis from 0 to 1 percent, and amplitude is on the x-axis from 0 to 60 mm. The bottom right graph shows the damping ratio in percentage of critical damping and amplitude for the heave mode. Damping percent of critical is on the y-axis from 0 to 1 percent, and amplitude is on the x-axis from 0 to 40 mm. Damping ratios generally increase with increasing vibration amplitude.
Figure 185. Damping traces and level for the sway and heave modes for the medium damping case.


These graphs show the damping traces and damping level for the sway and heave modes for the high damping level case. The top left graph shows the time history of the displacement of the sway mode. Amplitude is on the y-axis from -40 to 40 mm, and time is on the x-axis from 0 to 200 s. The top right graph shows the time history of the displacement of the heave mode. Amplitude is on the y-axis from -40 to 40 mm, and time is on the x-axis from 0 to 200 s. The bottom left graph shows the damping ratio in percentage of critical damping and amplitude for the sway mode. Damping percent of critical is on the y-axis from 0 to 1 percent, and amplitude is on the x-axis from 10 to 30 mm. The bottom right graph shows the damping ratio in percentage of critical damping and amplitude for the heave mode. Damping percent of critical is on the y-axis from 0 to 1 percent, and amplitude is on the x-axis from 5 to 35 mm. Damping ratios generally increase with increasing vibration amplitude.
Figure 186. Damping traces and level for the sway and heave modes for the high damping level case.


Federal Highway Administration | 1200 New Jersey Avenue, SE | Washington, DC 20590 | 202-366-4000
Turner-Fairbank Highway Research Center | 6300 Georgetown Pike | McLean, VA | 22101