U.S. Department of Transportation
Federal Highway Administration
1200 New Jersey Avenue, SE
Washington, DC 20590
202-366-4000
Federal Highway Administration Research and Technology
Coordinating, Developing, and Delivering Highway Transportation Innovations
| REPORT |
| This report is an archived publication and may contain dated technical, contact, and link information |
|
| Publication Number: FHWA-HRT-15-080 Date: February 2016 |
Publication Number: FHWA-HRT-15-080 Date: February 2016 |
Various factors may affect the behavior of bridge supports using engineered fills. They include the following:
The performance of bridge supports using engineering fills can be characterized by the following:
In this chapter, the factors that affect the behaviors of shallow foundations are synthesized based on the published results in the literature. They include factors affecting the settlement of shallow foundations with and without reinforcement and factors affecting vertical and lateral deformations of bridge piers and abutments using engineered fills. Further, the effects of transient loads on deformations of bridges supports on granular soils and the determination of stress distributions in granular soils under shallow foundations are reviewed. Based on the literature review, a load-deformation data catalog was compiled into an unpublished Microsoft® Excel spreadsheet.
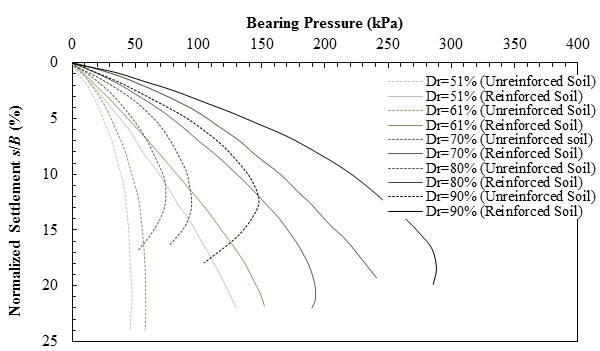
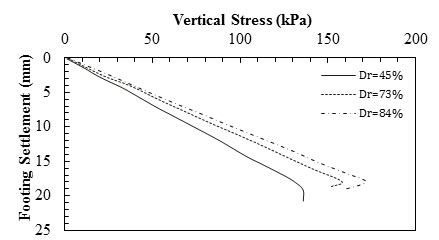
Fragaszy and Lawton performed a series of laboratory model tests designed to determine the influence of soil relative density (DR) on the load-settlement behavior of reinforced sand.(53) The uniformly graded native sand was reinforced with three layers of aluminum foils in all tests. As figure 5 shows, in all cases, the ultimate bearing capacity increased with increasing DR. Additionally, the load-settlement behavior of the strip footings on reinforced soil was stiffer than those bearing on unreinforced soil at the same relative density. The results show that with a 10 percent increase in DR, at 14.5 psi (100 kPa) pressure, the settlement of the foundation decreased by about 20 percent. By reinforcing the soil, the ultimate bearing capacity of the foundation increased at least 60 percent at a ratio of settlement of foundation to its width (s/B) of 10 percent. Note that the increase in confinement with the addition of reinforcement layers suppressed the dilative behavior, as observed through the suppressed peak in load-settlement response. Basudhar et al. conducted an experimental study on circular footings resting on sand reinforced with geotextiles.(54) They concluded that the immediate settlement of the foundation decreased with an increase in DR (see figure 6).
1 psi = 6.89 kPa
Note: This figure was created by FHWA after Fragaszy and Lawton.(53)
Figure 5. Graph. Load-settlement results on unreinforced and reinforced sand.
1 inch = 25.4 mm
1 psi = 6.89 kPa
Note: This figure was created by FHWA after Basudhar et al.(54)
Figure 6. Graph. Load-settlement results for different relative densities.
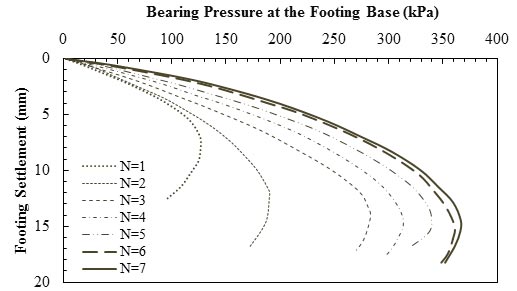
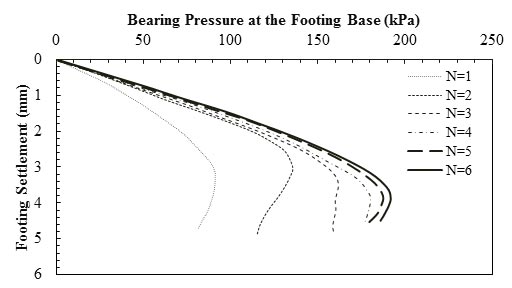
Omar et al. conducted a series of laboratory model tests on strip and square foundations supported by sand reinforced with geogrid layers.(55) As their results in figure 7 and figure 8 show, for similar values of applied load, the settlement of footings bearing on reinforced soil was lower than that on unreinforced soil. For tests with a strip foundation, when N increased from 1 to 3, the ultimate bearing load doubled, while the settlement at its respective ultimate load also almost doubled. At each applied pressure, the amount of settlement decreased with increasing N. for N greater than or equal to 4, the settlement at ultimate bearing load remained practically constant, indicating there is an optimum N beyond which the settlement at ultimate bearing load has insignificant improvement. It should be considered that based on the study by Omar et al., the effective depth of reinforcement is about 2B for strip foundations.(55) Therefore, in their experiment, by having u/B = h/B = 0.33 (the notations are shown in figure 4), reinforcements with N greater than or equal to 7 are placed out of the influence zone.
1 inch = 25.4 mm
1 psi = 6.89 kPa
Note: This figure was created by FHWA after Omar et al.(55)
Figure 7. Graph. Load-settlement results for strip footing for u/B = h/B = 0.333, b/B = 10.
1 inch = 25.4 mm
1 psi = 6.89 kPa
Note: This figure was created by FHWA after Omar et al.(55)
Figure 8. Graph. Load-settlement results for square footing for u/B = h/B = 0.333, b/B = 6.
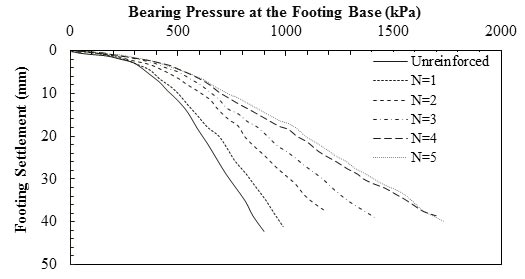
Chen et al. investigated the behavior of square foundations on geosynthetic-reinforced clayey soil with a PI of 15 percent using laboratory model footing tests.(56) The model footings used in the tests were steel plates with dimensions of 5.98 by 5.98 by 1 inch (152 by 152 by 25.4 mm) (width by length by thickness). The model tests were conducted in a 4.92- by 2.98- by 2.98-ft (1.5- by 0.91- by 0.91-m) (length by width by depth) steel test box. The testing procedure was performed according to the ASTM D 1196-93, where the load increments were applied and maintained until the rate of settlement was less than 0.001 inch/min (0.03 mm/min) for 3 min consecutively.(57) The results, plotted in figure 9, show that by increasing N, the amount of settlement at each applied pressure decreased up to N = 4. For N greater than or equal to 4, settlement of square foundations did not increase with additional reinforcement layers. This again indicates there is an optimum N beyond which the settlement has insignificant improvement. It should be noted that based on Chen et al., the effective depth of reinforcement is about 1.5B for geogrid reinforced clay.(56) Therefore, in the experiment by Chen et al., by having u/B = h/B = 0.33, reinforcements with N greater than or equal to 7 are placed out of the influence zone.(56)
1 inch = 25.4 mm
1 psi = 6.89 kPa
Note: This figure was created by FHWA after Chen et al.(56)
Figure 9. Graph. Load-settlement results for square footing on unreinforced and reinforced soil with polypropylene (PP) geogrid layers.
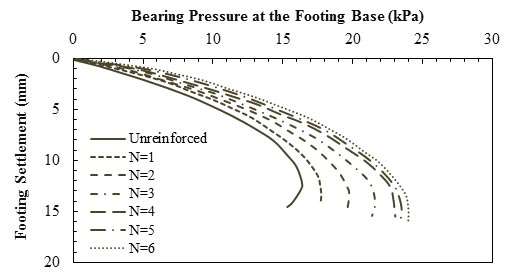
Das et al. conducted laboratory model tests to investigate the ultimate bearing capacity of surface strip foundations on geogrid reinforced sand and clay.(58) Each foundation was made of an aluminum plate with dimensions of 3 by 12 inches (76.2 by 304.8 mm) (B × L). Bearing capacity tests were conducted in two boxes, each with internal dimensions of 3.61 by 0.98 by 2.95 ft (1.1 by 0.3 by 0.9 m) (length by width by depth). The results show that the inclusion of geogrid reinforcement increased the load per unit area that could be carried by a foundation at any given settlement level. This is true for the tests in both sand and clay. As figure 10 shows, the foundation settlement decreased with the increase of reinforcement layer until N = 5. When N was greater than 5, the foundation settlement no longer decreased with an increase of the reinforcement layers. The results may be due to the fact that additional reinforcement layers were placed below the effective depth of reinforcement that was about 2B for strip footing in sandy soil.
1 inch = 25.4 mm
1 psi = 6.89 kPa
Note: This figure was created by FHWA after Das et al.(58)
Figure 10. Graph. Load-settlement results for sandy soil for u/B = 0.4, h/B = 0.33, and b/B = 4.
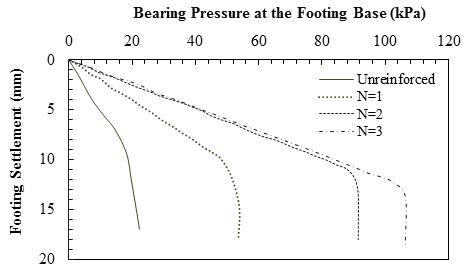
Basudhar et al. conducted an experimental study on circular footings resting on sand reinforced with geotextiles.(54) They concluded that with an increase in N, the settlement gradually decreased in rate. As figure 11 shows, when N is greater than or equal to 2, the foundation settlement no longer decreased with an increase of the reinforcement layers, with the exception of the settlement at ultimate capacity. For the test with three layer of reinforcement, the geotextile was placed at depths of 0.25B, B, and 2B below the base of the footing. By considering the results presented in section, the effective depth of reinforcement was less than 2B for square foundation; therefore, layer 3 and the additional layers were placed outside the influence zone and no longer affected the foundation settlement.
1 inch = 25.4 mm
1 psi = 6.89 kPa
Note: This figure was created by FHWA after Basudhar et al.(54)
Figure 11. Graph. Load-settlement results for 1.18-inch (30-mm)-diameter circular footing.
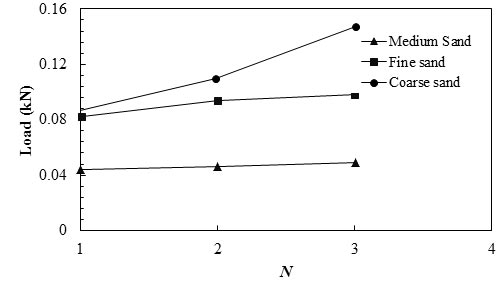
Phanikumar el al. performed a series of laboratory plate load tests on geogrid reinforced sand beds.(59) Properties of the test sands are presented in table 5. Figure 12 shows that at certain settlements, the bearing load needed to reach that settlement was also affected by N and soil types.
| Property | Fine Sand | Medium Sand | Coarse Sand |
|---|---|---|---|
| Dry unit weight (at DR = 50 percent) (kN/m3) | 15.2 | 14.9 | 14.7 |
| Maximum aggregate size (dmax) (mm) | 0.425 | 2.36 | 4.75 |
| Particle diameter at which 10 percent of the sample is finer, by mass (D10) (mm) | 0.25 | 0.59 | 1.3 |
| Internal Φ* (degree) | 32 | 35 | 40 |
| Coefficient of uniformity | 1.4 | 1.995 | 2.07 |
| Coefficient of curvature | 1.17 | 1.12 | 1.25 |
| 1 kN/m3 = 6.37 lbf/ft3 1 inch = 25.4 mm *The internal Φ of the test sands was determined by performing direct shear tests. The test sands were compacted at their respective dry unit weights corresponding to a relative density of 50 percent. |
|||
1 lbf = 0.0044 kN
Note: This figure was created by FHWA after Phanikumar et al.(59)
Figure 12. Graph. Effect of number of geogrids on the load required for a settlement of 0.02 inch (0.5 mm).
Results of the effect of different numbers of reinforcement on the behavior of foundation placed on reinforced sand with phosphor-bronze layers are plotted in figure 13.(60) The results also show the decreasing trend of settlement with the increasing N at two ratios of reinforcement: L versus B.
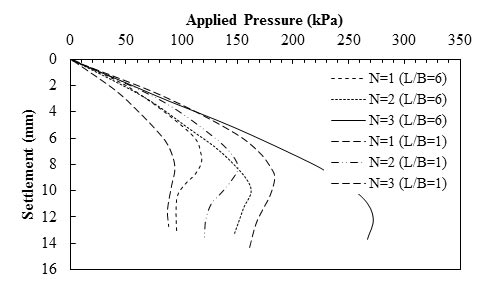
1 inch = 25.4 mm
1 psi = 6.89 kPa
Figure 13. Graph. Load-settlement results for different numbers of metallic reinforcement.
Results from laboratory model tests conducted by Latha and Somwanshi are plotted in figure 14.(61) The results show that with an increase in b, the magnitude of ultimate bearing capacity of foundations on reinforced soil increased, and settlement decreased.
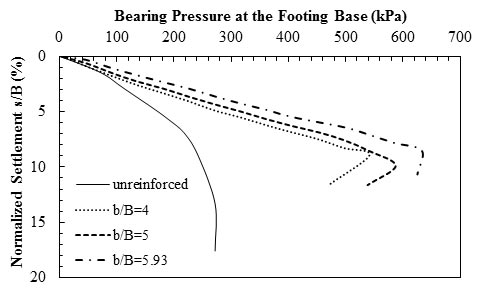
1 psi = 6.89 kPa
Note: This figure was created by FHWA after Latha and Somwanshi.(61)
Figure 14. Graph. Load-settlement results for different widths of geonet (N = 4, d = 2B).
Elton and Patawaran conducted an experimental study on reinforced soil specimens to evaluate the effects of Tf of geotextiles on the stress-strain relationship of reinforced soil.(62) The properties of the six geotextile used in their experiments are presented in table 6. Figure 15 shows the unconfined compression test results. Three transducers on top of the steel loading plate measured vertical displacements. As the results show, the curve initially reached its peak strength at approximately 3 to 8 percent strain, had a decrease in some strength, and then gradually increased back to reach a second peak before finally decreasing sharply. The peak strength and the corresponding strain of the specimens increased as reinforcement strength increased.
| Property | Geotextile Type (G) | |||||
|---|---|---|---|---|---|---|
| G4 | G6 | G8 | G12 | G16 | G28 | |
| Mass per area (g/m2) | 135.64 | 203.46 | 271.28 | 406.92 | 542.56 | 949.48 |
| Wide-width machine direction strength (kN/m) | 9.0 | 14.0 | 14.5 | 18.6 | 20.1 | 24.9 |
| Wide-width cross-machine direction strength (kN/m) | 14.4 | 19.3 | 19.8 | 20.3 | 22.9 | 21.7 |
| 1 g/m2 = 2.05 ´ 10-4 lb/ft2 1 kN/m = 68.5 lbf/ft | ||||||
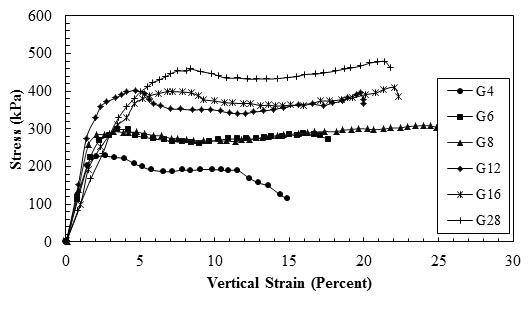
1 psi = 6.89 kPa
Note: This figure was created by FHWA after Elton and Patawaran.(62)
Figure 15. Graph. Stress-strain relationship of reinforced soil.
Adams and Collin conducted five laboratory experiments on reduced-scale piers as part of an FHWA research project.(41) Of the five experiments, one was unreinforced, and the others were reinforced with different reinforcement spacing and Tf. As the results in figure 16 show, the specimen with spacing of 0.66 ft (0.2 m) and lower wide width strength of 1,439 lbf/ft (21 kN/m) could withstand higher stresses compared to the specimen with 1.31-ft (0.4-m) spacing and higher wide width strength of 4,797 lbf/ft (70 kN/m) at any given strain. Therefore, they concluded that the reinforcement spacing played a more important role than the reinforcement strength.
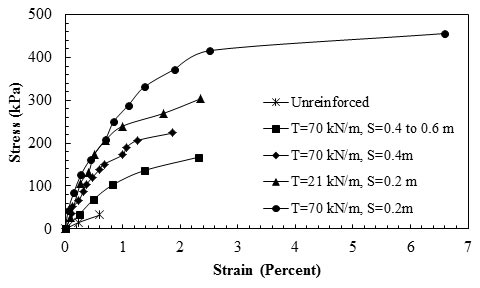
1 psi = 6.89 kPa
1 kN/m = 68.5 lbf/ft
1 ft = 0.305 m
Note: This figure was created by FHWA after Adams and Collin.(41)
Figure 16. Graph. Stress-strain relationship of the mini-pier experiments.
Abu-Hejleh et al. conducted an assessment of the new Founders/Meadows Bridge near Denver, CO, which was completed in July 1999.(63,64) The study focused on the performance and behavior of the GRS system under service loads. Three sections of the GRS system were instrumented to measure movements of the front GRS wall, settlement of the bridge footing, and differential settlements between the bridge abutment and the approaching roadway. The backfill soil used in this project was a mixture of gravel (35 percent), sand (54.4 percent), and fine-grained soil (10.6 percent). The backfill soil was classified as well-graded silty sand per ASTM D 2487 and as stone fragments, gravel, and sand (A-1-B (0)) per AASHTO M145-91.(65,66) The average unit weight and dry unit weight of the compacted backfill soil as measured during construction were 140.6 and 133.7 lb/ft3 (22.1 and 21 kN/m3), respectively, and the water content was 5.6 percent. Results of large direct shear and large triaxial tests showed a Φ of 47.7 and 39.5 degrees and c of 16.06 and 5.73 psi (110.7 and 39.5 kPa), respectively, for the direct shear and triaxial tests. Three grades of geogrid reinforcements were used in this project: uniaxial (UX) 6 below the foundation and UX 3 and UX 2 behind the abutment wall. Table 7 summarizes the ultimate strength and the long-term design strength (LTDS) for these geogrids.
| Geogrid Type and Notation | Ultimate Strength (kN/m) | LTDS (kN/m) |
|---|---|---|
| UX 6 | 157.3 | 27 |
| UX 3 | 64.2 | 11 |
| UX 2 | 39.3 | 6.8 |
| 1 kN/m =68.5 lbf/ft | ||
Data were collected during construction of the GRS walls, during placement of the bridge superstructure, and during the 18 mo after opening the bridge to traffic. The results are presented in table 8 and show excellent performance of the GRS structure. The monitored overall displacements were smaller than those expected in the design and allowed by performance requirements, there were no signs for development of the bridge bump problem or of any structural damage, and post-construction movements became negligible within a year after opening the bridge to traffic.
| Types of Maximum Movements | Induced Only by GRS Wall Construction | Induced Only by Placement of Bridge Superstructure (115-kPa Surcharge) | Induced Only While Bridge in Service (150-kPa Surcharge) | ||
|---|---|---|---|---|---|
| 6 Mo | 12 Mo | 18 Mo | |||
| Maximum outward displacement of the front wall facing (mm) | 12 | 10 | 8 | 12 | 13 |
| Maximum settlement of the leveling pad supporting the front wall facing (mm) | 8 | 7 | 4 | 5 | 5 |
| Maximum bridge abutment footing settlement (mm) | 13 | 7 | 11 | 10 | |
| Percent maximum settlement of bridge abutment of wall height (percent) | 0.29 | 0.17 | |||
| 1 kPa = 0.145 psi 1 inch = 25.4 mm Note: This table was created by FHWA after Abu-Hejleh et al.(64) Blank cells indicate no value was recorded. |
|||||
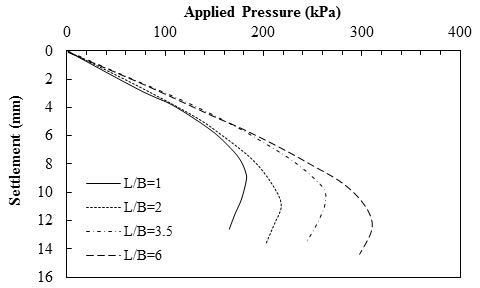
Huang and Tatsuoka used different types of metal strips to reinforce the soil beneath a shallow foundation.(60) Figure 17 shows the results from laboratory model tests reinforced with phosphor-bronze strips. The results show that with an increase in L, the magnitude of the settlement in each applied load decreased. However, this decrease was not proportional to the increase in L. For example, under 4,177 psf (200 kPa) of applied pressure, the settlement of the foundation was the same for two different reinforcement lengths of L/B = 3.5 and L/B = 6.
1 psi = 6.89 kPa
Note: This figure was created by FHWA after Huang and Tatsuoka.(60)
Figure 17. Graph. Load-settlement results for different reinforcement lengths (N = 3).
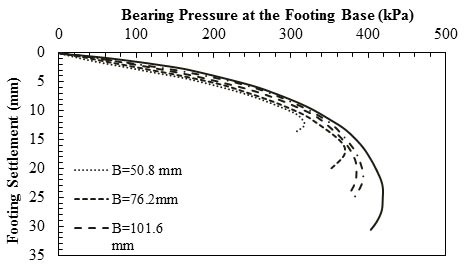
Das and Omar conducted an experimental study on surface strip foundations on geogrid- reinforced sand.(67) As shown in figure 18, they concluded that the settlement at the ultimate bearing capacity increased with a decrease in B. The figure also revealed insignificant effects of footing size on settlement under bearing pressures less than approximately 6,266 psf (300 kPa). It is noted that these observations were obtained in small-scale experiments.
1 inch = 25.4 mm
1 psi = 6.89 kPa
Note: This figure was created by FHWA after Das and Omar.(67)
Figure 18. Graph. Load-settlement results in reinforced sand (DR = 75 percent).
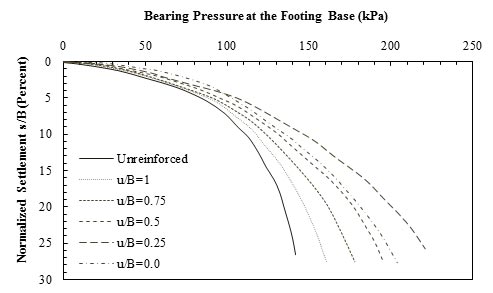
Mandal and Sah conducted bearing capacity tests on model footings on clay subgrades reinforced with geogrids.(68) Their results, plotted in figure 19, show that the maximum percentage reduction in settlement with the use of geogrid reinforcement within the compacted and saturated clay was about 45 percent, and it occurred at a depth of 0 to 0.25B below the base of the square foundation.
1 psi = 6.89 kPa
Note: This figure was created by FHWA after Mandal and Sah.(68)
Figure 19. Graph. Load-settlement results of model footings on clay subgrade reinforced with geogrid.
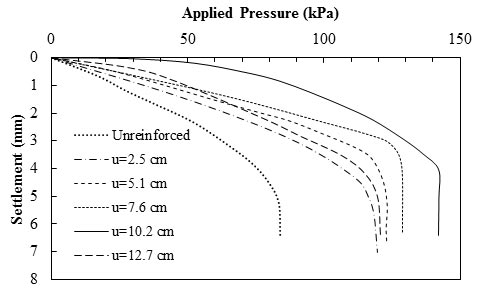
Binquet and Lee conducted a series of experiments on strip footing 2.99 inches (76 mm) wide placed on sandy soil reinforced with metal strips.(69) Figure 20 shows the results of the studies on the effect of u of the top reinforcement layer on the settlement of a foundation. They concluded that the optimum location of the top layer was at u/B = 1.3. Furthermore, based on experimental results obtained from foundations placed on reinforced soil with geogrid, it was concluded that the optimum depth for placing the top layer of reinforcement was within 0.25B below the base of the foundation. Therefore, the top layer of the metal strip could be located at a lower depth compared to geogrid reinforcement in order to have the minimum amount of settlement under each applied load.
1 inch = 25.4 mm = 2.54 cm
1 psi = 6.89 kPa
Note: This figure was created by FHWA after Binquet and Lee.(69)
Figure 20. Graph. Load-settlement results for different depth of top layer of metallic reinforcement (N = 3).
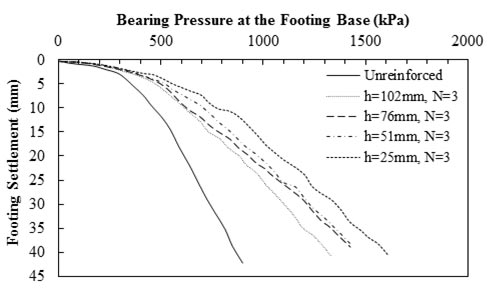
Chen et al. investigated the behavior of square foundations on geosynthetic reinforced clayey soil of low to medium plasticity using laboratory model footing tests.(56) As figure 21 shows, by decreasing h between the three reinforcement layers (placed within the zone of influence below the footing), the amount of settlement at each applied load pressure decreased.
1 inch = 25.4 mm
1 psi = 6.89 kPa
Note: This figure was created by FHWA after Chen et al.(56)
Figure 21. Graph. Load-settlement results for square footing tests with three layers of geogrids placed at different vertical spacing.
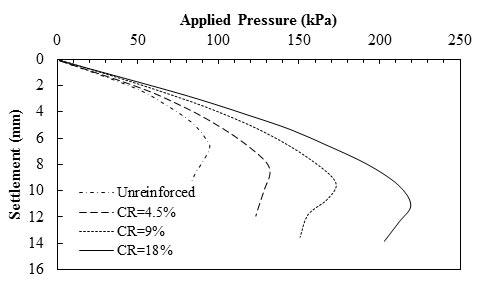
An effective parameter for the load-settlement behavior of foundation on soil reinforced with metallic strips is the CR of reinforcement in each layer. Figure 22 shows the experimental results of the settlement of a foundation placed on reinforced soil with phosphor-bronze strip layers.(60) The figure shows by increasing CR, the settlement at each applied pressure decreases. From the results, it can be concluded that the decrease in settlement was not proportional to CR. This suggests that there is an upper bound in CR, above which a decrease in settlement with the increase in CR may not be expected.
1 inch = 25.4 mm
1 psi = 6.89 kPa
Note: This figure was created by FHWA after Huang and Tatsuoka.(60)
Figure 22. Graph. Load-settlement results for different CRs of reinforcement (L = 2B, N = 3).
Adams and Nicks conducted an experimental study to investigate secondary deformation characteristics of GRS as bridge piers under service load conditions.(27) Load-settlement behaviors of four GRS piers built using two types of soils and woven geotextiles were monitored under 30.45 psi (210 kPa) of pressure. The characteristics of the materials used and results presented by Adams and Nicks are shown in table 9.(27) The results show that under service load conditions, there was no significant increase in settlement for the pier with the weak geotextile (pier A). Also, the piers with open-graded #8 aggregates experienced slightly more compression (about 5 percent higher) compared to well-graded A-1-a backfill soil. The results from the pier deformation survey over 4 mo indicated that secondary settlement occurred in granular material, but it was still within typical tolerable limits for bridges of up to 2 percent vertical strain over the life of the bridge.(32)
| Measurement Categories | Material Properties and Specific Field Surveys | Pier A | Pier B | Pier C | Pier D |
|---|---|---|---|---|---|
| Backfill material properties | AASHTO soil type | #8 | A-1-a | A-1-a | #8 |
| Φ (degrees) | 55 | 54 | 54 | 55 | |
| c (kPa) | 0 | 5.5 | 5.5 | 0 | |
| Reinforcement properties | Tf (kN/m) | 35 | 70 | 70 | 70 |
| Minimum average roll value strength at 2 percent strain (kN/m) | 3.5 | 19.3 | 19.3 | 19.3 | |
| Survey results | GRS composite settlement 105 days after load placement (mm) | 24 | 23.6 | 22.5 | 24.8 |
| Vertical strain in GRS composite (percent) | 1.03 | 1.01 | 0.97 | 1.07 | |
| 1 psi = 6.89 kPa 1kN/m = 68.5 lbf/ft 1 inch = 25.4 mm Note: This table was created by FHWA after Adams and Nicks.(27) |
|||||
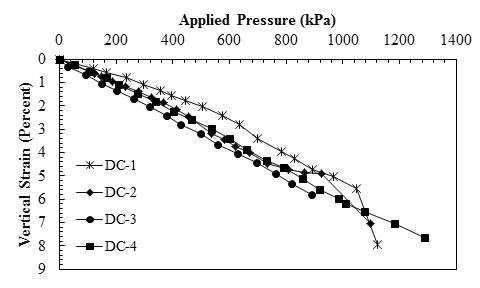
Nicks et al. conducted 19 GRS PTs as a part of FHWA research that investigated axial load versus vertical deformation characteristics of GRS piers.(42) A total of 5 tests were conducted at the Defiance County (DC), OH, highway maintenance facility, and 14 were conducted at the Turner-Fairbank Highway Research Center (TFHRC). The parameters that varied among tests were reinforcement spacing, geotextile strength, soil type, and frictionally connected facing element. The parameters of piers tested to investigate the effect of aggregate type on load- deformation characteristics of the piers and the test results are shown in table 10 and figure 23. The applied pressure was calculated as the average of the measured values over the period of loading, and the vertical strain was calculated as the averages of the four linear voltage displacement transducers (LVDTs) and potentiometers (POTs) located on the footing at the end of each load increment. Based on the results, the pier built with the largest aggregate tested (#57 stone) had the lowest service limit of all the tests, indicating more deformation under an applied load. In addition, the pier built with rounded pea gravel had a lower strength and service limit than the more angular aggregate meeting the same gradation specifications for an AASHTO #8 material.
| Test No. | Backfill | Reinforcement | Facing | ||||
|---|---|---|---|---|---|---|---|
| Type | Φ (degree) |
c (kPa) |
Aggregate Size (mm) |
Tf (kN/m) |
Sv (mm) |
||
| DC-1 | 8 | 54 | 0 | 12.7 | 70 | 194 | CMU |
| DC-2 | 8P | 46 | 0 | 19.05 | 70 | 194 | CMU |
| DC-3 | 57 | 52 | 0 | 25.4 | 70 | 194 | CMU |
| DC-4 | 9 | 49 | 0 | 9.525 | 70 | 194 | CMU |
| 1 psi = 6.89 kPa 1kN/m = 68.5 lbf/ft 1 inch = 25.4 mm CMU = Concrete Masonry Unit. Note: This table was created by FHWA after Nicks et al.(42) |
|||||||
1 psi = 6.89 kPa
Note: This figure was created by FHWA after Nicks et al.(42)
Figure 23. Graph. Load-deformation behavior from PTs on GRS piers using five types of DC backfills.
By comparing identical piers that were similar in all of their characteristics except their gradation, Nicks et al. concluded that the use of well-graded material resulted in a considerably stiffer load-deformation response than that observed when open-graded material was used.(42)
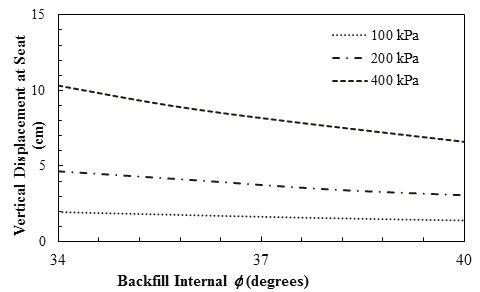
Helwany et al. conducted finite element analyses (FEAs) of two full-scale loading tests on GRS bridge abutments and performed a parametric study to investigate the performance of the modular block facing of GRS bridge abutments subjected to live and dead loads from the bridge superstructure.(70) They concluded that more favorable deformation response was attained when using soil types that have higher internal Φ and corresponding higher bulk and shear moduli. figure 24 shows that when Φ increased from 34 to 40 degrees, the vertical displacement at the abutment seat decreased from 1.89 to 1.18 inches (48 to 30 mm) at applied pressure of 4,177 psf (200 kPa), while vertical displacement showed little variation at a lower applied pressure of 2,088 psf (100 kPa).
1 inch = 2.54 cm
1 psi = 6.89 kPa
Note: This figure was created by FHWA after Helwany et al.(70)
Figure 24. Graph. Effects of backfill internal Φ on vertical displacement at abutment seat (reinforcement spacing = 7.87 inches (20 cm))
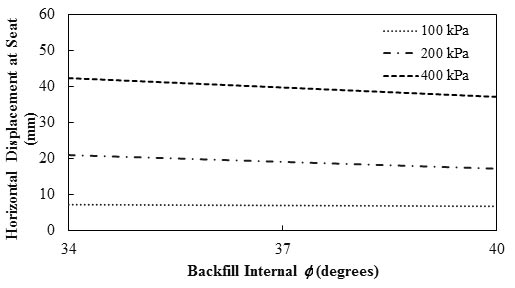
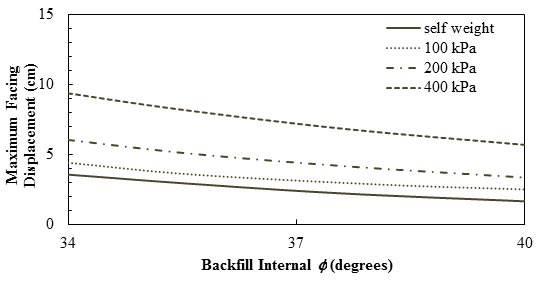
Helwany et al. also concluded that by using soil types that had higher internal Φ and higher bulk and shear moduli, a more favorable deformation response was attained for horizontal displacement at the abutment seat and for maximum lateral displacement of the segmental facing (see figure 26).(70) At applied pressure of 4,177 psf (200 kPa), by increasing the internal Φ from 34 to 40 degrees, the horizontal displacement at seat decreased by about 14 percent. As figure 26 shows, at different applied pressures, the maximum lateral displacement of the segmental facing decreased in a linear manner with increasing Φ .
1 inch = 25.4 mm
1 psi = 6.89 kPa
Note: This figure was created by FHWA after Helwany et al.(70)
Figure 25. Graph. Effects of backfill internal Φ (reinforcement spacing = 7.87 inches (20 cm)) on horizontal displacement at abutment seat.
1 inch = 2.54 cm
Note: This figure was created by FHWA after Helwany et al.(70)
Figure 26. Graph. Effects of backfill internal Φ (reinforcement spacing = 7.87 inches (20 cm)) on the maximum lateral displacement of the facing.
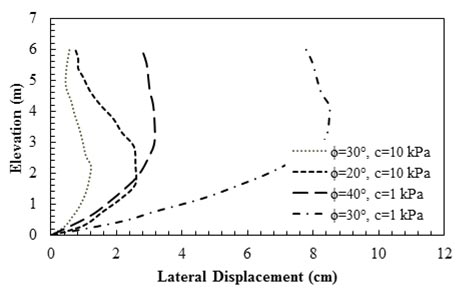
Hatami and Bathurst investigated the influence of backfill type on the performance of reinforced soil segmental retaining walls (SRWs) under working stress conditions at the end of construction (EOC) using a finite difference numerical modeling.(71) As figure 27 shows, facing deflections diminished in magnitude as soil shear strength increased due to an increase in Φ, an increase in apparent c, or both. The pattern of deflected shape was also influenced by the increase of apparent c. An increase of apparent c moved the location of maximum wall deflection lower down the wall and was particularly effective in reducing deflections at the wall crest. The results also show the different influences of Φ and c
1 ft = 0.305 m
1 inch = 2.54 cm
Note: This figure was created by FHWA after Hatami and Bathurst.(71)
Figure 27. Graph. Influence of apparent c and Φ on lateral displacement of the wall.
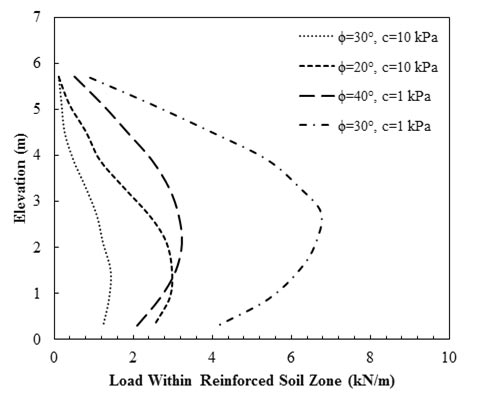
Results plotted in figure 28 show that reinforcement loads were greater for the walls with weaker backfills, and the distribution of maximum load along the wall height varied between a parabolic shape for granular backfill and a linear shape when the backfill had higher value of apparent c and was more cohesive.(71)
1 ft = 0.305 m
1kN/m = 68.5 lbf/ft
Note: This figure was created by FHWA after Hatami and Bathurst.(71)
Figure 28. Graph. Influence of backfill apparent c and Φ values on maximum reinforcement loads in wall models at EOC
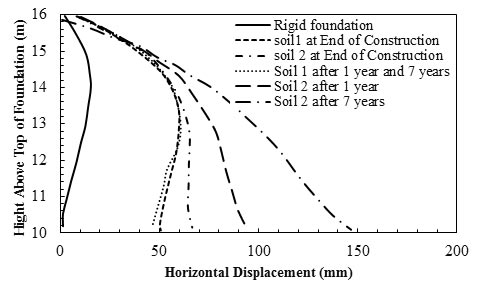
Skinner and Rowe numerically investigated the short- and long-term behaviors of a 19.68-ft (6-m)-high segmental block-faced geosynthetic reinforced retaining wall constructed on a rigid base; they also studied two 32.8-ft (10-m)-thick clayey foundations to investigate the effect of yielding in the foundation on the stability of the wall.(72) The horizontal displacements of the wall face calculated for the rigid foundation and the two clayey foundations are plotted in figure 29. Clayey foundations are significantly more compressible than the rigid foundation. The figure shows that the deformations at the face and base of the wall were considerably higher for soils 1 and 2 than for the rigid foundation. The increased foundation deformation contributed significantly to the facing displacement. For the lower viscosity soil 1, there was no significant change in behavior between the time of 95 percent consolidation (reached 1 year after EOC) and subsequent time (e.g., 7 years). The more viscous soil 2 reached approximately 20 percent consolidation 1 year after EOC and approximately 95 percent consolidation 7 years after EOC. The slight backward rotation of the wall face from EOC to 7 years (95 percent consolidation) for soil 1 was caused by local displacements at the face and especially at the toe of the wall.
1 ft = 0.305 m
1 inch = 25.4 mm
Note: This figure was created by FHWA after Skinner and Rowe.(72)
Figure 29. Graph. Horizontal displacements at wall face
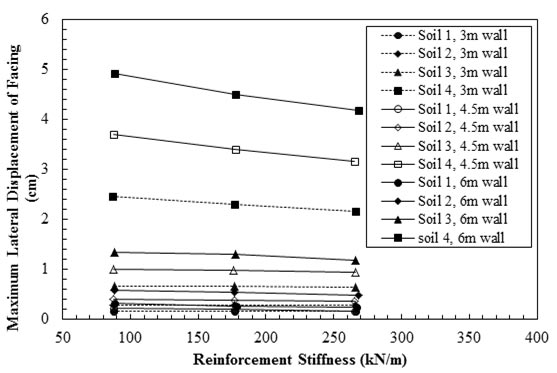
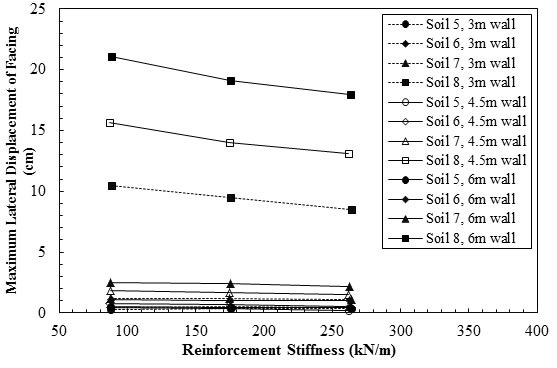
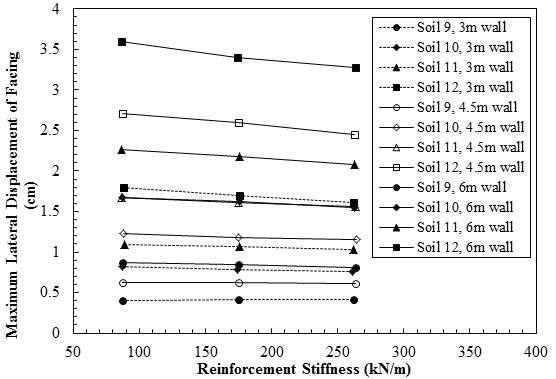
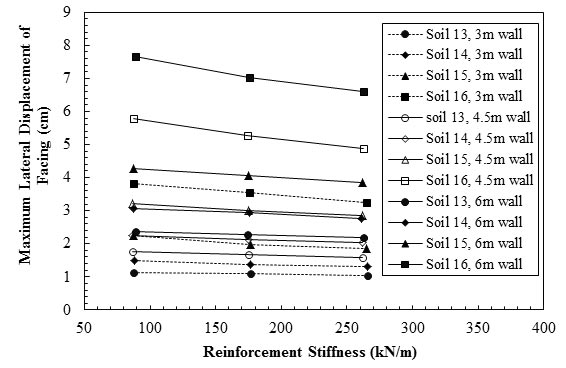
Helwany et al. conducted FEAs to investigate the effect of backfill type and reinforcement strength on the behavior of GRS retaining walls.(73) A total of 3 different reinforcement stiffness values and 16 different backfill materials were implemented in the analyses of 3 walls with different heights to produce 144 analysis combinations. The GRS retaining walls were under 15.23-psi (105-kPa) surcharge pressure. The dimensions and the properties of the different soils are presented in table 11 and table 12, and the results are plotted in figure 30 through figure 33.
| Wall Height (m) | Depth of Backfill (m) | Length of Geotextile (m) | N |
|---|---|---|---|
| 3 | 3.7 | 1.8 | 10 |
| 4.5 | 5.5 | 2.7 | 15 |
| 6 | 7.3 | 3.7 | 20 |
| 1 ft = 0.305 m Note: This figure was created by FHWA after Helwany et al.(73) | |||
| Soil Type Based on Unified Soil Classification | Backfill Designation Number | RC Based on Percent of Standard Proctor | Moist Unit Weight (kN/m3) |
Φ for Confining Pressure = 1 Atmosphere Pressure (degrees) |
Reduction in Φ for a 10-Fold Increase in Confining Pressure (degrees) |
c (kN/m2) |
|---|---|---|---|---|---|---|
| Well-graded gravel, poorly graded gravel, well-graded sand, poorly graded sand | 1 | 105 | 23.6 | 42 | 9 | 0 |
| 2 | 100 | 22.8 | 39 | 7 | 0 | |
| 3 | 95 | 22.1 | 36 | 5 | 0 | |
| 4 | 90 | 21.3 | 33 | 3 | 0 | |
| Silty sand | 5 | 100 | 21.3 | 36 | 8 | 0 |
| 6 | 95 | 20.5 | 34 | 6 | 0 | |
| 7 | 90 | 19.7 | 32 | 4 | 0 | |
| 8 | 85 | 18.9 | 30 | 2 | 0 | |
| Silty clayey sand | 9 | 100 | 21.3 | 33 | 0 | 24 |
| 10 | 95 | 20.5 | 33 | 0 | 19 | |
| 11 | 90 | 19.7 | 33 | 0 | 14 | |
| 12 | 85 | 18.9 | 33 | 0 | 10 | |
| Low plasticity clay | 13 | 100 | 21.3 | 30 | 0 | 19 |
| 14 | 95 | 20.5 | 30 | 0 | 14 | |
| 15 | 90 | 19.7 | 30 | 0 | 10 | |
| 16 | 85 | 18.9 | 30 | 0 | 5 | |
| 1 kN/m3 = 6.37 lbf/ft3 1kN/m2 = 20.89 lb/ft2 Note: This table was created by FHWA after Helwany et al.(73) | ||||||
Figure 30 through figure 33 all show that the type of backfill had the most effect on the behavior of the GRS retaining wall. They concluded that the stiffness of the geosynthetic reinforcement had a considerable effect on the behavior of the GRS retaining wall when the backfill was of lower stiffness and shear strength. For example, the 9.84-ft (3-m)-high GRS retaining walls made of soils #15 and #16 (lower stiffness and shear strength) exhibited significant improvement when a stiffer geosynthetic was utilized. When the 9.84-ft (3-m)-high GRS retaining wall was made of soils #13 and #14 (higher stiffness and shear strength), it exhibited relatively small improvements when the geosynthetic stiffness was increased.
1 inch = 2.54 cm
1 ft = 0.305 m
1kN/m = 68.5 lbf/ft
Note: This figure was created by FHWA after Helwany et al.(73)
Figure 30. Graph. Maximum lateral displacement versus geosynthetic stiffness for soils 1–4.
1 inch = 2.54 cm
1 ft = 0.305 m
1kN/m = 68.5 lbf/ft
Note: This figure was created by FHWA after Helwany et al.(73)
Figure 31. Graph. Maximum lateral displacement versus geosynthetic stiffness for soils 5–8.
1 inch = 2.54 cm
1 ft = 0.305 m
1kN/m = 68.5 lbf/ft
Note: This figure was created by FHWA after Helwany et al.(73)
Figure 32. Graph. Maximum lateral displacement versus geosynthetic stiffness for soils 9–12.
1 inch = 2.54 cm
1 ft = 0.305 m
1kN/m = 68.5 lbf/ft
Note: This figure was created by FHWA after Helwany et al.(73)
Figure 33. Graph. Maximum lateral displacement versus geosynthetic stiffness for soils 13–16.
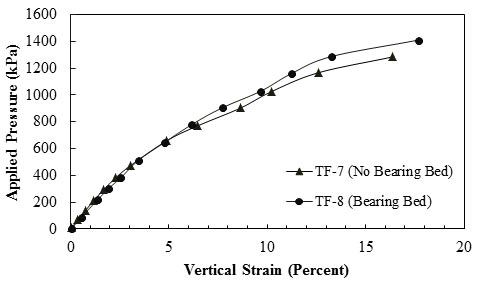
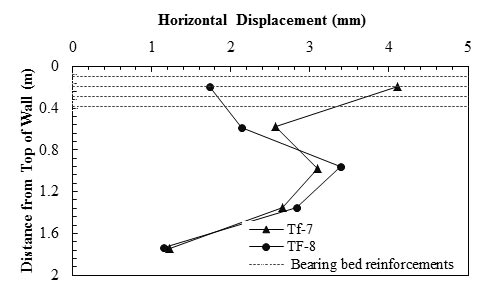
Figure 34 and figure 35 show the results from two PTs conducted by Nicks et al. to investigate the effect of bearing bed reinforcement on load deformation characteristics of bridge piers.(42) Bearing bed reinforcement placed directly underneath the beam seat was recommended in at least the top five courses of CMU facing elements for GRS abutments to support the increased loads due to the bridge and should be, at a minimum, half the primary spacing.(32) The two piers were identical except one pier (Turner-Fairbank (TF)-8) had two courses of bearing bed reinforcement in addition to the primary reinforcement of 7.87-inch (20-cm) spacing, and the other pier (TF-7) had no bearing bed reinforcement with only primary reinforcement. The applied pressure was calculated as the average of the measured values over the period of loading, and the vertical strain was calculated as the averages of the four LVDTs and POTs located on the footing at the end of each load increment. The axial deformations plotted in figure 34 indicate that the bearing bed provided marginally higher vertical capacity; however, vertical deformation was not improved at low strain levels. Figure 35 shows that at service loads (3,550-psf (170-kPa) applied vertical pressure), the lateral deformation of the top 1.31-ft (0.4-m)-thick bearing bed reduced by more than 50 percent due to inclusion of two courses of reinforcement.
1 psi = 6.89 kPa
Note: This figure was created by FHWA after Nicks et al.(42)
Figure 34. Graph. Effect of bearing bed reinforcement for TF-7 and TF-8.
1 ft = 0.305 m
1 inch = 25.4 mm
Note: This figure was created by FHWA after Nicks et al.(42)
Figure 35. Graph. Measured lateral deformation at 3,600 psf (172.5 kPa) applied pressure for TF-7 (no bearing bed reinforcement) and TF-8 (two courses of bearing bed reinforcement).
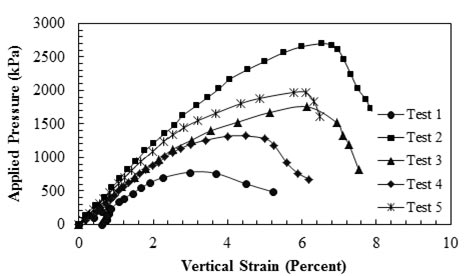
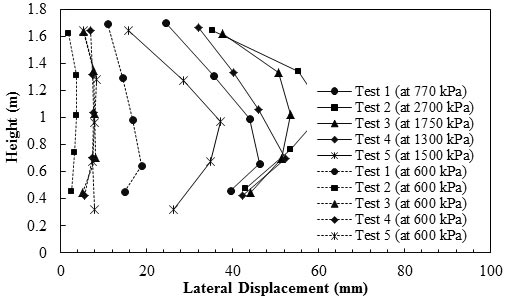
Wu et al. conducted a series of generic soil geosynthetic composite (GSGC) laboratory tests to investigate the composite behavior of GRS mass with varying spacing and Tf of reinforcement.(74) The test program comprised five GSGC tests. The specimen height was 6.56 ft (2 m) with a square cross section of 4.59 ft (1.4 m). The test conditions and a summary of the results are presented in table 13. The vertical movement was measured along the top surface of the concrete pad placed on top of the specimen before loading. Test 1 was conducted as a baseline for the other four tests. The specimen was loaded to 36.26 psi (250 kPa) (nearly up to 1 percent vertical strain), then unloaded to 0 psi (0 kPa) load and reloaded until failure. Other tests were loaded to the failure directly. A prescribed confining pressure of 4.93 psi (34 kPa) was applied on the entire surface area of the test specimens for tests 1 through 4. Figure 36 shows the load deformation behavior of the five GSGC tests. By comparing the results from tests 2 and 3, it can be concluded that the ultimate applied pressure increased by about 35 percent by doubling the reinforcement strength. By comparing tests 2 and 4, it can be concluded that by changing the reinforcement spacing from 1.31 to 0.66 ft (0.4 m to 0.2 m), the ultimate applied pressure increased by more than 50 percent. Therefore, compared to the Tf of reinforcement, the spacing of the reinforcement layers plays a more significant role in improving load-settlement behavior of a reinforced soil mass. Figure 37 shows lateral displacement of the test specimens at failure and at applied pressure of 87.02 psi (600 kPa). Test 2, which was a confined specimen with 0.66-ft (0.2-m) reinforcement spacing, demonstrated the highest ultimate capacity and least lateral deformation.
| Parameters | Test 1 | Test 2 | Test 3 | Test 4 | Test 5 |
|---|---|---|---|---|---|
| Wide-width tensile ultimate strength (kN/m) | No reinforcement | 70 | 140 | 70 | 70 |
| Reinforcement spacing (m) | No reinforcement | 0.2 | 0.4 | 0.4 | 0.2 |
| Confining pressure (kPa) | 34 | 34 | 34 | 34 | 0 |
| Ultimate applied pressure (kPa) | 770 | 2,700 | 1,750 | 1,300 | 1,900 |
| Vertical strain at failure (percent) | 3 | 6.5 | 6.1 | 4 | 6 |
| Maximum lateral displacement at failure (mm) | 47 | 60 | 54 | 53 | Not measured |
| 1 kN/m = 68.5 lbf/ft 1 ft = 0.305 m 1 psi = 6.89 kPa 1 inch = 25.4 mm Note: This table was created by FHWA adopted from Wu et al.(74) |
|||||
1 psi = 6.89 kPa
Note: This figure was created by FHWA after Wu et al.(74)
Figure 36. Graph. Load-deformation behaviors for GSGC tests.
1 ft = 0.305 m
1 inch = 25.4 mm
1 psi = 6.89 kPa
Note: This figure was created by FHWA after Wu et al.(74)
Figure 37. Graph. Lateral deformation of test specimens at 12,531 psf (600 kPa) and the ultimate applied pressure.
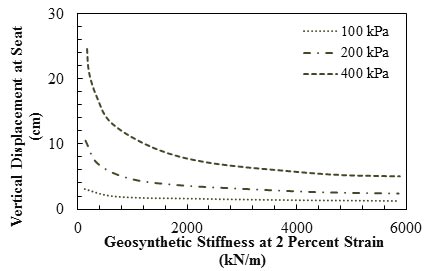
Helwany et al. conducted FEAs to investigate the effects of geosynthetic stiffness on the performance of GRS abutment.(70) The stiffness of the base case was assumed to be 36,305 lbf/ft (530 kN/m). Results plotted in figure 38 show that the vertical displacement of the abutment seat for the base case (for an applied pressure of 4,177 psf (200 kPa)) was reduced by 43 percent when the geosynthetic stiffness increased by 10 times to 363,050 lbf/ft (5,300 kN/m). Conversely, a drastic increase of 250 percent in displacement was noted when the geosynthetic stiffness was reduced to 3,603.5 lbf/ft (53 kN/m). Vertical displacement at the abutment seat increased drastically when axial stiffness of the geosynthetic dropped below a critical value, and the trend became more pronounced with an increase in applied pressure.
1 inch = 2.54 cm
1 psi = 6.89 kPa
1 kN/m = 68.5 lbf/ft
Note: This figure was created by FHWA after Helwany et al.(70)
Figure 38. Graph. Effect of geosynthetic stiffness (reinforcement spacing = 7.87 inches (20 cm)) on vertical displacement at abutment seat.
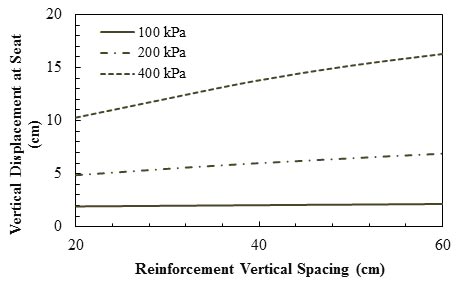
Helwany et al. concluded that the vertical displacement at the abutment seat increased when the vertical spacing between reinforcements increased at a high pressure of 58 psi (400 kPa).(70) Figure 39 shows that the increase in vertical displacement became more significant as the applied pressure increased. At an applied pressure of 4,177 psf (200 kPa), an increase of 40 percent in the vertical displacement was observed when the reinforcement vertical spacing increased from 7.87 to 23.62 inches (20 to 60 cm).
1 inch = 2.54 cm
1 psi = 6.89 kPa
Note: This figure was created by FHWA after Helwany et al.(70)
Figure 39. Graph. Effect of geosynthetic spacing on vertical displacement at abutment seat.
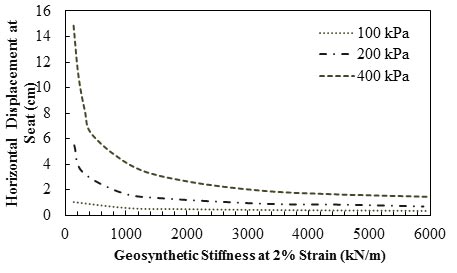
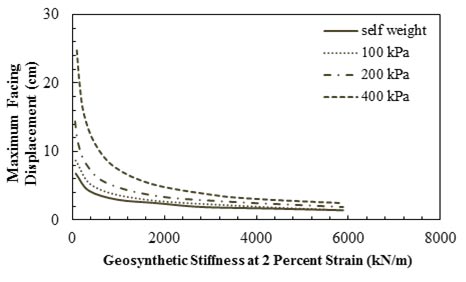
Figure 40 and figure 41 show that the horizontal displacements of the abutment seat and the maximum lateral displacement of the segmental wall decreased when the geosynthetic stiffness increased to 363,050 lbf/ft (5,300 kN/m) from the base case. Conversely, a drastic increase in displacements occurred when the geosynthetic stiffness was reduced to 3,630.5 lbf/ft (53 kN/m).
1 inch = 2.54 cm
1 psi = 6.89 kPa
1 kN/m = 68.5 lbf/ft
Note: This figure was created by FHWA after Helwany et al.(70)
Figure 40. Graph. Effect of geosynthetic stiffness (reinforcement spacing = 7.87 inches (20 cm)) on horizontal displacement at abutment seat.
1 inch = 2.54 cm
1 psi = 6.89 kPa
1 kN/m = 68.5 lbf/ft
Note: This figure was created by FHWA after Helwany et al.(70)
Figure 41. Graph. Effect of geosynthetic stiffness (reinforcement spacing = 7.87 inches (20 cm)) on the maximum lateral displacement of the facing.
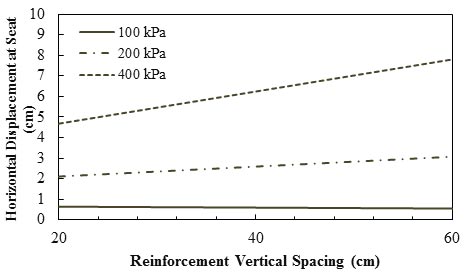
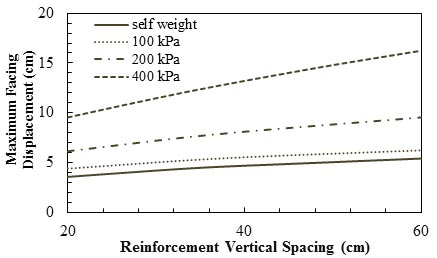
Based on the FEA of two full-scale loading tests of GRS bridge abutments as well as a parametric study to investigate the performance of GRS bridge abutments, Helwany et al. concluded that the horizontal displacement at the abutment seat and the maximum lateral displacement of the segmental facing increased with an increase in reinforcement spacing (see figure 42 and figure 43).(70) As figure 42 shows, at applied pressure of 29 psi (200 kPa), an increase of 52 percent in the horizontal displacement was observed when reinforcement vertical spacing increased from 7.87 to 23.62 inches (20 to 60 cm). At a lower applied pressure of 14.50 psi (100 kPa), the vertical spacing had a minimum effect on horizontal displacement. As shown in figure 43, at an applied pressure of 29 psi (200 kPa), by increasing the reinforcement spacing from 7.87 to 23.62 inches (20 to 60 cm), the maximum facing displacement increased by about 50 percent.
1 inch = 2.54 cm
1 psi = 6.89 kPa
Note: This figure was created by FHWA after Helwany et al.(70)
Figure 42. Graph. Effect of geosynthetic spacing on horizontal displacement at abutment seat.
1 inch = 2.54 cm
1 psi = 6.89 kPa
Note: This figure was created by FHWA after Helwany et al.(70)
Figure 43. Graph. Effect of geosynthetic spacing on the maximum lateral displacement of the facing.
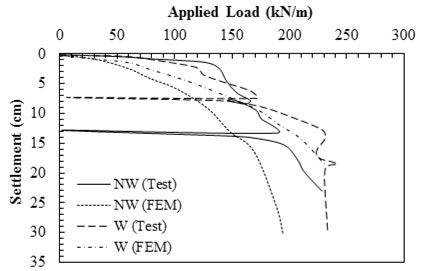
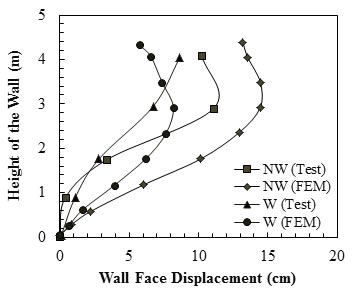
Gotteland et al. performed experimental and numerical studies on two reinforced walls: one was reinforced with a non-woven geotextile (represented by NW) and the other with a woven geotextile (represented by W) (see figure 44 and figure 45).(75) The non-woven geotextile was 3.5 times more extensible than the woven one and approximately half as strong in terms of Tf . After construction, the reinforced walls were loaded in the same way as a bridge deck through a foundation slab until failure occurred. The 3.28-ft (1-m)-wide foundation was located 4.92 ft (1.50 m) from the edge of the facing. As figure 44 shows, the abutment with woven geotextile had a higher ultimate bearing capacity, and its settlement was less compared to the non-woven one. The results in figure 45 show that lateral deformation of the wall face with woven geotextile was less than that with non-woven geotextile.
1 inch = 2.54 cm
1 kN/m = 68.5 lbf/ft
FEM = Finite element method.
Note: This figure was created by FHWA after Gotteland et al.(75)
Figure 44. Graph. Central settlement of the foundation versus applied load.
1 ft = 0.305 m
1 inch = 2.54 cm
Note: This figure was created by FHWA after Gotteland et al.(75)
Figure 45. Graph. Wall face displacement at applied pressure of 3,969.1 lb/ft2 (190 kN/m2) for non-woven and woven reinforcement
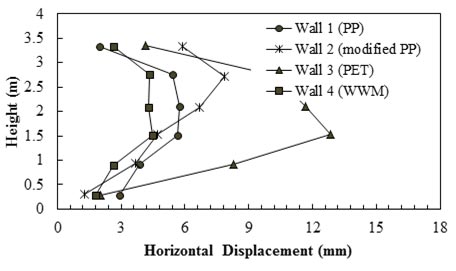
Bathurst et al. conducted experiments on four full-scale modular block walls that were constructed with reinforcement layers with different tensile stiffnesses.(76) The walls were 11.81 ft (3.6 m) high. Two of the walls (walls 1 and 2) were reinforced with two different PP geogrid reinforcements, wall 3 was reinforced with a polyester (PET) geogrid, and wall 4 was reinforced with a welded wire mesh (WWM). Walls 1 and 2 were compacted using vibrating plate equipment, and walls 3 and 4 were compacted by a vibrating rammer. Figure 46 shows measured relative horizontal displacements recorded at monitored points on the wall facing column shortly after EOC. Each elevation point has a local datum corresponding to the time when each row of displacement POTs were installed.
1 ft = 0.305 m
1 inch = 25.4 mm
Note: This figure was created by FHWA after Bathurst et al.(76)
Figure 46. Graph. Relative horizontal displacement of wall facing recorded at EOC.
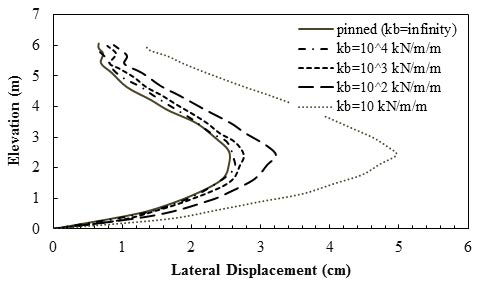
Hatami and Bathurst investigated the influence of reinforcement properties on the performance of reinforced soil SRWs using a finite difference numerical model.(71) They concluded that the deformation response of the model wall with a pinned (fully fixed) reinforcement condition was very close to that of the model with interface stiffness between backfill soil and reinforcement layers (kb) ≥ 145 lbf/inch/inch (1,000 kN/m/m). As figure 47 shows, for values of kb ≤ 145 lbf/inch/inch (1,000 kN/m/m), the lower kb, the greater the wall deformation. The wall deformation magnitude increased by a factor of two when the value of kb was reduced by two orders of magnitude from kb = 145 lbf/inch/inch (103 kN/m/m) to kb = 1.45 lbf/inch/inch (10 kN/m/m).
1 inch = 2.54 cm
1 kN/m/m = 0.145 lbf/inch/inch
Note: This figure was created by FHWA after Hatami and Bathurst.(71)
Figure 47. Graph. Influence of soil-reinforcement interface stiffness value on lateral displacement of the wall.
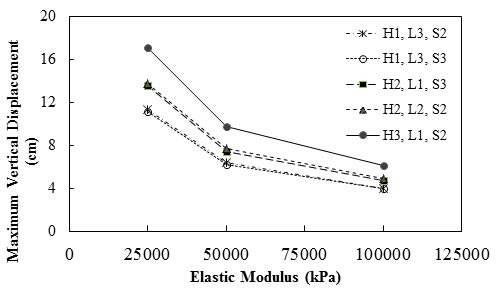
Zevgolis and Bourdeau simulated the performance of MSE abutments with metal strips to investigate the effects of different parameters such as the elastic modulus of reinforcement (ER), H, magnitude of the applied load, and foundation soil type on the behaviors of the abutments.(4) They defined five case studies; H1-L3-S2, H1-L3-S3, H2-L1-S3, H2-L2-S2, and H3-L1-S2, where H1, H2, and H3 stand for the abutments that were 19.66, 22.97, and 26.24 ft (6, 7, and 8 m) tall, respectively; L1, L2, and L3 stand for supported spans that were 59.06, 78.74, and 9,843 ft (18, 24, and 30 m) long with total applied load of 18,152, 22,262, and 26,372 lbf/ft (265, 325, and 385 kN/m), respectively; and S2 and S3 represent different foundation soil types. For S2, Φ was 30 degrees, c was 104 lb/ft2 (5 kPa), and the unit weight was 121 lb/ft3 (19 kN/m3). For S3, Φ was 20 degrees, c was 835 lb/ft2 (40 kPa), and the unit weight was 108 lb/ft3 (17 kN/m3). As figure 48 shows, by increasing Young’s modulus of reinforcement from 3.63 to 7.25 ksi (25 to 50 MPa), the maximum vertical deformation of the abutment decreased at least 42 percent, and by increasing Young’s modulus of reinforcement from 7.25 to 14.50 ksi (50 to 100 MPa), the maximum vertical deformation decreased at least 36 percent. Moreover, the results indicate that higher MSE abutment had more vertical displacement that that of a lower one.
1 inch = 2.54 cm
1 psi = 6.89 kPa
Figure 48. Graph. Effect of ER on the maximum vertical displacement of MSE abutments with metal strips
Tatsuoka et al. and Tateyama performed a series of plane strain model tests of metal strip-reinforced sand retaining walls with three different numbers of reinforcement layers (N = 2, 5, and 10).(77,78) The reinforcement layers were made of phosphor-bronze strips. The model wall was 33.07 inches (84 cm) wide, 15.55 inches (39.5 cm) long, and 20.47 inches (52 cm) tall. As the results plotted in figure 49 show, by increasing N, the vertical displacement of the foundation placed on top of abutment under each applied load decreased. For instance, by increasing N from 2 to 5, the settlement under applied pressure of 1.02 psi (7 kPa) decreased about 70 percent, and by increasing N from 5 to 10, the settlement decreased 53 percent under applied pressure of 2.03 psi (14 kPa). Cao and Peng simulated these experiments through a nonlinear FEM analysis and obtained similar results.(79) The results showed that the peak footing load of reinforced retaining walls increased significantly with an increase in the number of reinforced layers. The experimental results were obtained by Tateyama, and the FEM results were obtained by Cao and Peng.(78,79)
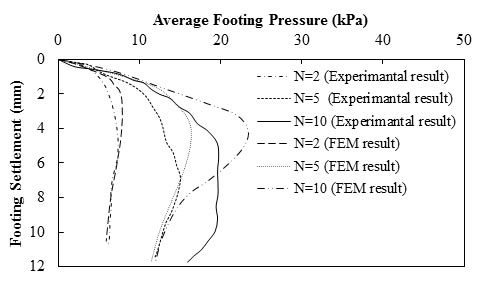
1 inch = 25.4 mm
1 psi = 6.89 kPa
Note: This figure was created by FHWA after Zevgolis and Bourdeau.(4)
Figure 49. Graph. Load-settlement results for the foundation on top of MSE abutment.
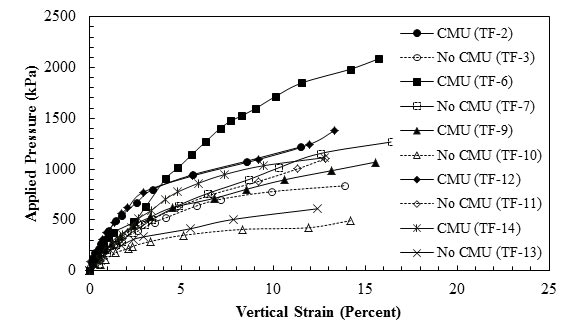
Nicks et al. conducted five pairs of tests as a part of an FHWA research study to investigate the effects of facing elements on load deformation behavior of bridge piers (see figure 50).(42) They concluded that the ultimate capacity of pier increased when a facing element was present; however, the magnitude of strain at failure, which was measured through LVDTs and POTs on the footing, was similar for a given GRS composite with or without a facing.
For figure 50, the following parameters were used:
1 psi = 6.89 kPa
Note: This figure was created by FHWA after Nicks et al.(42)
Figure 50. Graph. Stress-strain response for different piers.
A full-scale GRS bridge pier load test was conducted at FHWA’s TFHRC in 1996.(22,23) The GRS pier was prestrained (preloaded) using hydraulic jacks and a specially designed reaction system. Results obtained from this instrumented bridge pier show that the prestraining reduced vertical settlement of the pier by approximately 50 percent (see figure 51). Figure 52 shows that prestraining did not reduce lateral deformation except for near the top of the pier where the lateral movement reduced significantly.
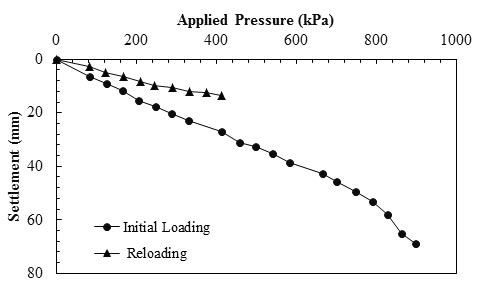
1 inch = 25.4 mm
1 psi = 6.89 kPa
Note: This figure was created by FHWA after Adams and Wu et al.(22,23)
Figure 51. Graph. Load-settlement curves for the pier.
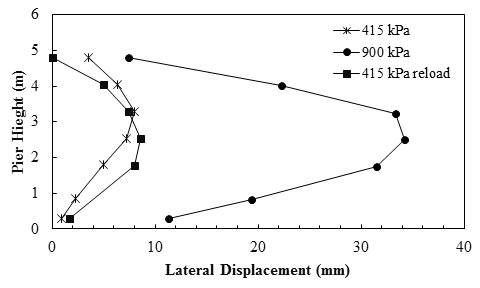
1 ft = 0.305 m
1 inch = 25.4 mm
1 psi = 6.89 kPa
Note: This figure was created by FHWA after Adams and Wu et al.(22,23)
Figure 52. Graph. Lateral displacement measured by LVDT.
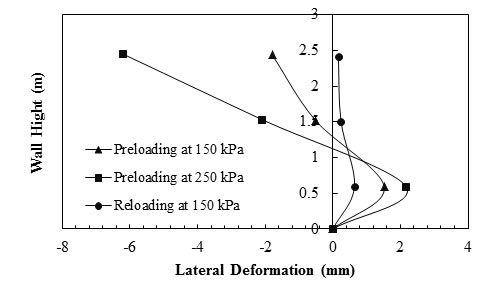
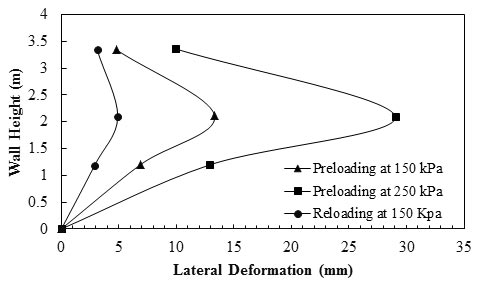
Two GRS bridge abutments were built in Black Hawk, CO, in 1997 to support a steel bridge.(23) Because the thickness of the reinforced soil abutment were different beneath the four footings directly supporting the weight of the bridge, the GRS abutment was preloaded to reduce the differential settlement between adjacent footings. The abutment was preloaded up to 35.53 psi (245 kPa) (1.6 times the design load of 21.76 psi (150 kPa)) for the square footing and 11.60 psi (80 kPa) (2 times the design load of 5.80 psi (40 kPa)) for the rectangular footing. It was found that preloading substantially reduced the differential settlement. The differential settlements at 21.76 psi (150 kPa) of the preloading cycle for the two abutments were 0.33 and 0.85 inch (8.4 and 21.6 mm). At 21.76 psi (150 kPa) in the reloading cycle, the differential settlement of both abutments was less than 0.039 inch (1 mm).(23) Measured results by Wu et al. also show that preloading reduced the lateral movement of GRS abutments (see figure 53 and figure 54).(23) At 21.76 psi (150 kPa) in the preloading cycle, the maximum lateral displacements in the west abutment (8.86 ft (2.7 m) tall) and the east abutment (17.72 ft (5.4 m) tall) were 0.06 and 0.52 inch (1.5 and 13.2 mm), respectively. These displacement values were reduced to 0.02 and 0.18 inch (0.6 and 4.5 mm), respectively, at 21.76 psi (150 kPa) in the reloading cycle. After the first reloading cycle, there was no significant reduction in the magnitude of the lateral and vertical deformations of the GRS abutments in the subsequent reloading cycles.(23)
1 ft = 0.305 m
1 inch = 25.4 mm
1 psi = 6.89 kPa
Note: This figure was created by FHWA after Wu et al.(23)
Figure 53. Graph. Lateral deformation profiles of the west abutment.
1 ft = 0.305 m
1 inch = 25.4 mm
1 psi = 6.89 kPa
Note: This figure was created by FHWA after Wu et al.(23)
Figure 54. Graph. Lateral deformation profiles of the east abutment.
Live loads may include traffic load and compaction-induced load. Few research studies have investigated the effect of live loads on bridge supports using engineered fills. Based on a three-dimensional (3D) numerical study on an integral abutment bridge, Olson et al. concluded that superstructure deflections related to live load had a secondary effect on the abutment displacement but substantially changed their rotation.(80) As a result, the critical moments at the connection between superstructure and foundation were exacerbated by live load in thermal expansion and improved in thermal contraction conditions. Chapter 10 of AASHTO LRFD Bridge Design Specifications specification states, “Transient load may be omitted for settlement analysis for cohesive soils subjected to time-dependent consolidation settlement.”(8) However, for cohesionless soils (including engineered fills), transient load may be considered in the deformations of shallow foundations and abutments and piers of bridges. For retaining walls and bridge abutments, the traditional approach is to add the live load to the dead load and consider the combined loads as a permanent dead load. For example, through analytical studies, Kim and Barker and Esmaeili and Fatollahzadeh investigated the equivalent surcharge for truck load and train load, respectively, on retaining walls and bridge abutments.(81,82) Presently, the dynamic effect of transient load on bridge supports using engineered fills has not been investigated. Moreover, there is a lack of literature on the time-dependent and live (transient) load on the stress-deformation behaviors of bridge supports in engineered fills.
Equations to compute vertical stresses at any point in a soil mass due to external vertical loadings have been developed based on the theory of elasticity. The formulas that are most widely used are the Boussinesq and Westergaard formulas.(83,84) They were first developed for point loads acting at the surface. These formulas have been integrated to obtain stresses below uniform strip loads and rectangular loads. In the practice, Boussinesq’s formulas are often preferred, as they give conservative results.
The Boussinesq formulas are based on the following assumptions:(83)
In the Westergaard formulas, the material is isotropic with finite and equal horizontal and vertical normal moduli and Poison’s ratios but with infinite horizontal shear modulus.(84) The assumptions for Westergaard’s formulas are as follows:
For engineered fills without reinforcement, the Boussinesq and Westergaard formulas can be used to determine the stress distributions inside the soil mass. In reinforced engineered fills that are used as bridge supports, the reinforced soils are no longer isotropic or homogeneous. Therefore, the Boussinesq and Westergaard formulas may not be applicable. In such a case, numerical simulations (such as FEM or finite difference method) may be used. Many past researches have studied the strain and stress distributions of the reinforcements within geosynthetic-reinforced walls. (See references 85–88.) For metallic-reinforced soils, there are three common methods used in North American practice for estimating reinforcement loads: the AASHTO coherent gravity method, the FHWA structure stiffness method, and the AASHTO simplified method. (See references 52, 89, and 36.) Limited studies have been conducted on stress distributions in reinforced soils as bridge supports, particularly in SLS. Rowe and Ho studied a continuous full-facing panel wall with a hinged toe and reinforced with extensible reinforcement in a granular backfill resting on a rigid foundation.(90) This numerical study concluded that among the parameters examined, the distribution of force was most affected by the reinforcement stiffness, density, the external Φ between facing and soil, the backfill soil internal Φ, and the rigidity of the facing.
The stress distribution can be influenced by various soil conditions (i.e., grain size distribution, strength parameters, relative density, and fine content), reinforcement characteristics (i.e., Tf, stiffness, N, and Sv), and loading conditions, some of which were investigated by Rowe and Ho.(90) However, the literature search conducted by the authors of this report suggests there is a lack of documentation and understanding of the effects of various parameters on the stress distribution in reinforced engineered fills as bridge supports in SLS.