U.S. Department of Transportation
Federal Highway Administration
1200 New Jersey Avenue, SE
Washington, DC 20590
202-366-4000
Federal Highway Administration Research and Technology
Coordinating, Developing, and Delivering Highway Transportation Innovations
| REPORT |
| This report is an archived publication and may contain dated technical, contact, and link information |
|
| Publication Number: FHWA-HRT-15-080 Date: February 2016 |
Publication Number: FHWA-HRT-15-080 Date: February 2016 |
In this chapter, methods that are widely accepted and routinely used to calculate immediate and long-term settlement of shallow foundations of bridges, vertical deformation of GRS abutments, and lateral displacement of GRS abutments are evaluated. Available methods for long-term deformations of shallow foundations on granular soils are also presented.
Various methods are available to calculate the immediate (elastic) settlement of shallow foundations. Das provided a critical review of 12 common methods on elastic settlement of shallow foundations on granular soil.(91) He grouped the methods into three categories: methods based on observed settlement of structures and full scale prototypes, semi-empirical methods based on a combination of field observations and theoretical studies, and methods based on theoretical relationships derived from the theory of elasticity. In this section, the following
five methods are presented and evaluated:
These five methods were evaluated in previous FHWA studies and a SHRP2 study.(3,12,10) The AASHTO LRFD Bridge Design Specifications recommends the use of the Hough method, which has the smallest coefficient of variance.(8,94) However, the Hough method is conservative by a factor of approximately two, which often leads to unnecessary use of deep foundations instead of spread footings to meet tolerable deformation criteria. FHWA recommends the use of the method proposed by Schmertmann because it is a rational method that considers not only the applied stress and its associated strain influence distribution with depth for various footing shapes but also the elastic properties of the foundation soils, even if they are layered. (See references 6, 7, 92, 93, and 10.)
To estimate settlements of footings in structural fills by the Schmertmann method, an assumption must be made about the standard penetration test (SPT) blow count for an SPT sampler to penetrate the second and third 6 inches into the subsoil (N-value) that is representative of the engineered fill.(92,93) The FHWA report, Spread Footings for Highway Bridges used an SPT N-value of 32 blows/ft (32 blows/0.305 m) corrected for overburden pressure as a representative value for estimating settlement in structural fills.(3) This SPT N-value corresponds to a relative density of approximately 85 percent at an overburden stress of about 2,000 psf (95.8 kPa) and approximately 97 percent RC based on the modified Proctor compaction energy.(3,18) Under such compacted conditions, and in the absence of other SPT data in structural fills, the settlement of a footing supported on structural fill can be estimated by using an assumed corrected SPT blow count ((N1)60) of 32. However, engineered fills are often compacted to a RC of 95 percent based on the modified Proctor compaction energy. For this case, (N1)60 of 23 is more appropriate.(18)
Based on the modified Schmertmann method, the immediate settlement of spread footing can be estimated by the equations found in figure 55 through figure 57.(93)

Figure 55. Equation. Immediate settlement of spread footing based on modified Schmertmann method.
Where:
Si = Immediate settlement.
C1 = Correction factor for strain relief due to soil excavation for foundation embedment, which is defined in figure 56.
C2 = Correction factor to consider creep as the time-dependent increase in settlement for t time (i.e., number of years) after construction, which is defined in figure 57.
Δp = Net uniform pressure applied at the foundation depth.
Hi= Thickness of each soil layer.
Iz = Strain influence factor.
X = Factor used to determine the value of elastic modulus.
Ei = Elastic modulus of layer i in the vertical direction.
![]()
Figure 56. Equation. Correction factor to consider foundation embedment depth.
![]()
Figure 57. Equation. Correction factor to consider creep.
The original Hough method was used to estimate immediate settlement of embankments.(84) It was based on uncorrected SPT N-values and included recommendations for cohesionless as well as cohesive soils such as sandy clay and remolded clay, respectively. AASHTO modified the Hough method and used (N1)60 to eliminate the recommendations for sandy clay and remolded clay.(9,84) However, the settlements estimated by the modified Hough method are usually overestimated by a factor of 2 or more based on the data in the FHWA report, Spread Footings for Highway Bridges.(3) Such conservative estimates may be excessive with respect to the behavior of the structures founded within, under, or near the embankment. In cases where structures are affected by embankment settlement, more refined estimates of the immediate settlements are warranted.
In the Hough method, the immediate settlement of sand under a shallow foundation is calculated by taking the summation of settlement of subdivided layers of 10 ft (3.05 m) that are influenced by the foundation load. The settlement ( ΔH) of each soil layer is calculated using the following:
![]()
Figure 58. Equation. Immediate settlement of each soil layer based on Hough method.
Where:
C = Bearing Capacity Index.
σ'0 = Initial average effective stress of the subdivided soil layer.
Δσ'v = Vertical stress increase in the subdivided soil layer due to applied foundation load.
The Peck and Bazaraa method is based on the original Terzaghi and Peck empirical equation.(95,99) The SPT blow count is corrected for overburden pressure to reflect the relative density of the soil. The immediate settlement of a footing on sand is calculated as follows:
![]()
Figure 59. Equation. Immediate settlement of footing based on Peck and Bazaraa method.
Where:
S = Settlement of footing.
Cw = Water table correction factor at depth of B/2 below footing bearing level.
CD = Embedment correction factor.
p = Footing bearing pressure.
(N1)60 can be estimated using the equations in figure 60 and figure 61 as follows:
![]()
Figure 60. Equation. SPT blow count corrected for overburden pressure less than or equal to 1,566 lb/ft2 (75 kPa)
Where N60 = Standard penetration number that is corrected based on the field conditions.
![]()
Figure 61. Equation. SPT blow count corrected for overburden pressure greater than 1,566 lb/ft2 (75 kPa)
The Burland and Burbidge method is an empirical relationship between average SPT blow count, foundation width, and foundation subgrade compressibility.(96) It is based on regression analysis of case studies. The immediate settlement of a footing on granular soil is given by the following:
![]()
Figure 62. Equation. Immediate settlement of a footing based on Burland and Burbidge method.
Where:
fs = Shape correction factor.
fl = Correction factor for thickness of sand or gravel layer.
ft = Time factor, used if t ³ 3 years.
q' = Average gross applied pressure.
Ic= Compressibility Index.
The D’Appolonia method is based on the elastic theory.(97,98) The immediate settlement of a footing on sand is given by the following:
![]()
Figure 63. Equation. Immediate settlement of a footing based on D'Appolonia method.
M = Modulus of compressibility of sand; it is determined using the empirical chart based on SPT results for both normally consolidated and over-consolidated sand; the SPT blow count in the chart is the average blow count in the depth B below the footing bearing level.(97)
μ0 = Embedment correction factor, using the chart by Christian and Carrier.(100)
μ1 = Correction factor for thickness of sand layer, using the chart by Christian and Carrier.(100)
Long-term, or time-dependent, settlement of shallow foundations on granular soils is also known as “creep” or “secondary settlement.” Crouse and Wu conducted a study to examine the long-term (greater than 6 mo) performance of seven full-scale GRS walls in the United States and Canada.(101) The walls ranged from 15 to over 40 ft (4.6 to over 12.2 m) in height and typically included surcharge loads from earth fills or highway loads. The geosynthetics were geogrid or geotextiles, and the facing consisted of concrete modular blocks, panels, or exposed surface. The creep rate of reinforcement ranged from 0.4 to 0.7 percent, with one GRS wall at 1.5 percent. Although quantitative creep rate of the GRS walls was not reported, it was found that creep rate decreased with time at a decreasing rate.(102) Adams and Nicks conducted a full-scale study on the secondary settlement of four GRS piers.(27) The results indicate that secondary settlement does occur in granular material, but the amount with GRS is still within typical tolerable limits for bridges.
Empirical equations have been proposed by previous researchers to evaluate long-term settlement of granular soils due to creep. This section presents four methods. Due to the limited data on long-term settlement of shallow foundations on granular soils, evaluation of these methods was not conducted.
The modified Schmertmann method considered creep as the time-dependent increase in settlement after construction, as shown in figure 57.(92,93)
Terzaghi, Peck, and Mesri presented the following equation for settlement due to creep (Screep):(103)
![]()
Figure 64. Equation. Settlement due to creep.
Where:
![]() = Weighted mean value of measured static cone resistance of cone penetration test (qc) between z = 0 to z0, where z is depth from the ground surface, and z0 is the depth under consideration.
= Weighted mean value of measured static cone resistance of cone penetration test (qc) between z = 0 to z0, where z is depth from the ground surface, and z0 is the depth under consideration.
Wu reported the following creep rate equation by assuming a linear relationship between the log scale of creep rate and log scale of time:(102)
![]()
Figure 65. Equation. Creep rate of shallow foundations.
Where:
εc = Creep strain (percent).
A = Reference creep rate; (dεc/dt) at t = 1 day (percent/day).
m = Creep modulus (equal to slope of log(dεc/dt) versus log(t) line; it may be obtained from PTs.
Briaud and Garland and Briaud proposed an expression of time-dependent settlement of footings in sand as follows:(104,105)
![]()
Figure 66. Equation. Time-dependent settlement of footings in sand.
Where:
s(t) = Settlement at time t.
s(t1) = Settlement at time t1, where t1 is the reference time (1 min).
n = Time dependency exponent.
Briaud reported that the model identified in figure 66 fit well with a large-scale footing test and the n value typically varied from 0.005 to 0.03 for sands.(105,106) Briaud recommended obtaining site-specific n values by creep pressure meter testing.(105) If this is not available, a value of 0.03 seems conservative for sand in most cases.
The approach for determining vertical deformation of a GRS abutment involves empirically finding the strain from an applicable PT curve.(32) The vertical strain of a GRS abutment is found from the intersection of the applied vertical stress due to the dead load and the PT design envelope for vertical strain. The vertical strain should be limited to 0.5 percent unless additional deformation is permitted.(32) The lateral strain can be then determined analytically assuming no volume change in the abutment.
The vertical displacement (ρ) of a GRS abutment with a strip footing is given by the equation in figure 67.(42) This equation is based on a solution for a relative displacement between the center of the strip footing and any arbitrary point assuming a constant stiffness with depth and a Poisson’s ratio of 0.5 for the GRS material.(107)

Figure 67. Equation. Vertical displacement of a GRS abutment with a strip footing.
Where:
π ≈ 3.1415926.
EGRS = Young’s elastic modulus of the GRS composite.
q = Applied pressure.
a = Setback distance between the face of the wall and the applied load.
b' = Width of facing block.
This section presents six methods for calculating lateral displacement of GRS walls and abutments. It is noted that these methods apply to GRS walls and abutments only. Their applicability to MSE walls or abutments remains to be verified.
For the lateral deformations of MSE walls and abutments, the FHWA specification, Design and Construction of Mechanically Stabilized Earth Walls and Reinforced Soil Slopes states the following:(37)
Christopher et al. correlated the ratio of reinforcement length and wall height (L/H) with the lateral displacement of a reinforced soil wall during construction.(89) This method is referred to as the “FHWA method.” The FHWA method was developed empirically by determining a displacement trend from numerical analysis and adjusting the curve to fit with field-measured data. The method provides an estimate of the maximum lateral displacement. In this method, an empirically derived relative displacement coefficient ( δR ) was related graphically to L/H. Based on the graphical relationship, a fourth-order polynomial equation was derived for 0.3 < L/H < 1.175 shown in figure 68.(74)
![]()
Figure 68. Equation. Displacement coefficient of a reinforced soil wall.
The maximum lateral deformation ( δmax ) of a GRS wall is as follows:
![]()
Figure 69. Equation. Maximum lateral deformation of a GRS wall with inextensible reinforcement (i.e., metallic reinforcement).
![]()
Figure 70. Equation. Maximum lateral deformation of a GRS wall with extensible reinforcement (i.e., geosynthetic reinforcement).
Wu et al. stated that figure 70 has been corrected for a wall with a different height and surcharge.(74)
The Geoservices method relies on limit equilibrium analyses to calculate the length of the required reinforcement to satisfy a suggested factor of safety with regard to three presumed external failure modes (e.g., bearing capacity failure, sliding, and overturning).(108) The method provides a procedure for calculating the lateral wall displacement. The lateral displacement is calculated by first choosing a strain limit for the reinforcement. This strain limit is usually less than 10 percent and depends on a number of factors, such as the type of wall facing, the displacement tolerances, and the type of geosynthetic to be used as reinforcement. Concrete facing panels, for example, would not allow much lateral displacement without showing signs of distress. Therefore, a low strain limit (1 to 3 percent) should be selected.(74) Once the strain limit has been selected, the method assumes a distribution of strain in the reinforcement for calculating wall movement. The maximum horizontal displacement of a GRS wall or abutment, δmax, can be calculated as follows:
![]()
Figure 71. Equation. Maximum horizontal displacement of a GRS wall or abutment based on Geoservices method.
Where εd = Strain limit.
In a study for CTI, Wu proposed a service load-based design method, referred to as the CTI method, to determine the maximum lateral displacement of a GRS wall or abutment.(109) In most cases, the designer may select a design limit strain ( εd ) of 1 to 3 percent for the reinforcement for H less than or equal to 29.52 ft (9 m). δmax can be estimated by the following empirical equation in figure 72:
![]()
Figure 72. Equation. Maximum lateral displacement of a GRS wall or abutment based on CTI method.
If δmax exceeds a prescribed tolerance for the wall, a smaller εd should be selected so that δmax of the wall will satisfy the performance requirement. Figure 72 applies only to walls with very small facing rigidity, such as wrapped-faced walls. Walls with significant facing rigidity have smaller maximum lateral displacement. For example, a modular block GRS wall has a δmax about 15 percent smaller than that calculated in figure 72.(74)
Jewell and Jewell and Milligan proposed a method for calculating wall displacement based on analysis of stresses and displacements in a reinforced soil mass.(110,111) This method only applies to a GRS wall with flexible facing (i.e., the rigidity of wall facing is ignored). Jewell and Milligan provided graphical relationships between a dimensionless displacement factor, ![]() and depth below crest of wall
and depth below crest of wall ![]() at various soils Φ and dilation angles. Where:(111)
at various soils Φ and dilation angles. Where:(111)
δh = Lateral displacement of a GRS wall or abutment with flexible facing.
Kreinf = Stiffness of reinforcement.
Pbase = Reinforcement force at the base of the wall.
Z = Depth from the crest of the wall.
δh varies with wall depth, and δmax occurs in the middle of H. Based on the Jewell and Milligan method, Wu et al. derived the following analytical expression of the lateral displacement of a GRS wall:(74)
![]()
Figure 73. Equation. Lateral displacement of a GRS wall or abutment with flexible facing.
Where:
Prm = Maximum reinforcement force at depth of influence zone (zi).
Kreinf= Stiffness of the reinforcement.
Φds = Friction angle of soil based on direct shear test.
ψ = Dilation angle of soil.
Following the theory for the Jewell and Milligan method, Wu et al. proposed an analytical model for calculating the lateral movement of a GRS wall with modular block facing.(74) This method, referred to as the “Wu method,” considers the rigidity of wall facing. Figure 74 shows the lateral displacement of a GRS wall with modular block facing, and figure 75 shows the lateral displacement of a GRS wall with modular block facing while ignoring the effect of fiction between the back of the modular block and soil.
![]()
Figure 74. Equation. Lateral movement of a GRS wall with modular block facing.
Where:
Δi = Lateral movement of a GRS wall with modular block facing.
Kh= Horizontal earth pressure coefficient.
γs = Unit weight of soil.
Z = Depth from the wall crest.
γb = Unit weight of modular block facing.
δ = Friction angle between modular block facing elements.
β = Friction angle between back face of wall and soil.
![]()
Figure 75. Equation. Lateral movement of a GRS wall with modular block facing (no friction between wall and soil).
Adams et al. presented a method for calculating lateral displacement of GRS abutments in response to a vertical load.(32) The method, referred to as the “Adams method,” conservatively assumes no volume change in a GRS abutment, which represents a worst-case scenario. The composite behavior of a properly constructed GRS mass is such that both the reinforcement and soil deform laterally together at the same strain. This composite behavior can be used to predict both the maximum lateral reinforcement strain and the maximum face deformation at a given load. The maximum lateral displacement of an abutment face can be estimated using figure 76. The lateral strain is then found using figure 77 and should be limited to 1 percent.(32)
![]()
Figure 76. Equation. Lateral displacement of GRS abutments in response to a vertical load.
Where:
DL = Lateral displacement of GRS abutments in response to a vertical load.
bq,vol= Width of the load along the top of the wall (including the setback).
Dv = Vertical settlement in the GRS abutment.
![]()
Figure 77. Equation. Lateral strain of GRS abutments in response to a vertical load.
Where:
εL = Lateral strain.
εv = Vertical strain at the top of the wall.
Note that figure 76 and figure 77 are based on the assumption of a triangular lateral deformation and a uniform vertical deformation; this assumption is based on observed deformation behavior of GRS.(32)
In this section, experimental data in the literature are applied to the deformation prediction methods presented in this chapter for evaluation purposes. In the evaluation, bias (denoted as λ), which is defined as the ratio of the measured value to the predicted value, is analyzed as a statistical variable. A λ value of 1.0 represents the prediction is the same as the measured (observed) deformation.
The arithmetic mean of λ (μλ) can be calculated as follows:
![]()
Figure 78. Equation. Arithmetic mean value.
Where:
μλ = Arithmetic mean of λ.
λi = Sampled λ value.
N0 = Total number (population) of values.
The standard deviation of λ (σλ) can be calculated as follows:

Figure 79. Equation. Standard deviation.
The coefficient of variation (COV) of λ can be calculated as follows:
![]()
Figure 80. Equation. COV.
Where:
σ = Standard deviation.
μ = Mean value.
Laboratory and field observations of immediate settlements are used to evaluate the five immediate settlement methods presented in this chapter. Table 14 shows the soil and foundation parameters of the case histories used in the evaluation.
| Case History No. |
B (m) |
L (m) |
Total Unit Weight of Soil (kN/m3) |
Depth from Ground Surface to Groundwater Table (m) |
Df (m) |
Hinc (m) |
qc (kN/m2) |
N | Reference Number |
Abutment/ Pier Designation in the Reference |
|---|---|---|---|---|---|---|---|---|---|---|
| 1 | 1.0 | 1.0 | 15.65 | 4.9 | 0.71 | 11.0 | 2,500–18,800 | 16–24 | 106 | None |
| 2 | 1.5 | 1.5 | 15.65 | 4.9 | 0.76 | 11.0 | 2,500–18,800 | 16–24 | 106 | None |
| 3 | 2.5 | 2.5 | 15.65 | 4.9 | 0.76 | 11.0 | 2,500–18,800 | 16–24 | 106 | None |
| 4 | 3.0 | 3.0 | 15.65 | 4.9 | 0.76 | 11.0 | 2,500–18,800 | 16–24 | 106 | None |
| 5 | 3.0 | 3.0 | 15.65 | 4.9 | 0.89 | 11.0 | 2,500–18,800 | 16–24 | 106 | None |
| 6 | 5.2 | 28.0 | 18.85 | 1.2 | 2.3 | 14.2 | 11,768 | 42* | 112 | Gentbrugge Ghent abutment |
| 7 | 7.0 | 36.0 | 18.85 | 1.2 | 2.3 | 14.2 | 11,768 | 42* | 112 | Gentbrugge Brussels abutment |
| 8 | 6.0 | 52.5 | 18.85 | 1.2 | 2.8 | > zi | 11,768 | 42* | 112 | Gentbrugge pier A |
| 9 | 6.0 | 52.5 | 18.85 | 2.5 | 3.6 | > zi | 11,768 | 42* | 112 | Gentbrugge pier B |
| 10 | 5.0 | 8.5 | 18.85 | 5.0 | 2.5 | > zi | 8,336 | 24* | 113 | |
| 11 | 3.0 | 10.0 | 18.85 | 4.6 | 3.0 | > zi | 12,749 | 50* | 114 | Loopem pier |
| 12 | 5.8 | 24 | 18.85 | 2.0 | 2.5 | > zi | 6,865 | 17* | 112 | Denys-Westrem abutment |
| 13 | 2.6 | 21.0 | 18.85 | 2.0 | 2.0 | > zi | 6,276 | 9* | 114 | Denys-Westrem pier |
|
1 ft = 0.305 m 1 kN/m3 = 6.37 lbf/ft3 1 kN/m2 = 20.89 lbf/ft2 * Indicates that the SPT blow count (N-value) corrected for overburden per Peck and Bazaraa.(94) Hinc = Depth below footing to (relatively) incompressible stratum (Hinc > zi indicates that the incompressible layer is located below zi). |
||||||||||
Table 15 lists the predicted and measured values of immediate settlements of shallow foundations and λ and standard normal variable (z) for each measured data point. Based on the results, the mean λ is 0.49, σ is 0.54, and COV is 1.10.
| Case History No. |
Applied Pressure (kPa) |
Measured Immediate Settlement (mm) |
Predicted Immediate Settlement (mm) |
λ (Measured/ Predicted) |
z |
|---|---|---|---|---|---|
| 1 | 315.2 | 4.3 | 19.0 | 0.23 | 0 |
| 496.4 | 7.4 | 34.0 | 0.22 | -0.19 | |
| 2 | 235.6 | 3.1 | 18.6 | 0.17 | -0.73 |
| 348.0 | 5.9 | 30.5 | 0.19 | -0.61 | |
| 444.9 | 10.6 | 41.7 | 0.25 | 0.29 | |
| 3 | 188.2 | 2.4 | 20.0 | 0.12 | -1.41 |
| 292.0 | 5.5 | 34.9 | 0.16 | -0.87 | |
| 395.8 | 10.2 | 51.1 | 0.20 | -0.5 | |
| 488.3 | 16.9 | 66.5 | 0.25 | 0.19 | |
| 4 | 130.7 | 1.6 | 14.3 | 0.11 | -1.75 |
| 390.7 | 11.4 | 56.6 | 0.20 | -0.39 | |
| 490.9 | 18.1 | 75.3 | 0.24 | 0.1 | |
| 5 | 90.7 | 1.2 | 8.3 | 0.14 | -1.2 |
| 194.7 | 3.6 | 22.9 | 0.16 | -1.02 | |
| 290.7 | 7.9 | 38.0 | 0.21 | -0.29 | |
| 390.9 | 14.9 | 55.1 | 0.27 | 0.39 | |
| 487.3 | 25.9 | 72.6 | 0.36 | 0.5 | |
| 6 | 95.8 | 9.9 | 6.1 | 1.62 | 1.41 |
| 7 | 131.7 | 11.9 | 12.1 | 0.98 | 0.87 |
| 8 | 158.0 | 7.9 | 14.4 | 0.55 | 0.61 |
| 9 | 214.5 | 4.1 | 18.8 | 0.22 | -0.1 |
| 10 | 181.9 | 11.9 | 17.9 | 0.66 | 0.73 |
| 11 | 230.8 | 21.1 | 10.6 | 1.99 | 1.75 |
| 12 | 72.8 | 11.9 | 9.3 | 1.28 | 1.02 |
| 13 | 196.3 | 33.0 | 22.1 | 1.49 | 1.2 |
| 1 psi = 6.89 kPa 1 inch = 25.4 mm |
|||||
Figure 81 shows the frequency of occurrence histogram of λ. The probability plot for λ is depicted in figure 82. The curve follows a lognormal distribution.
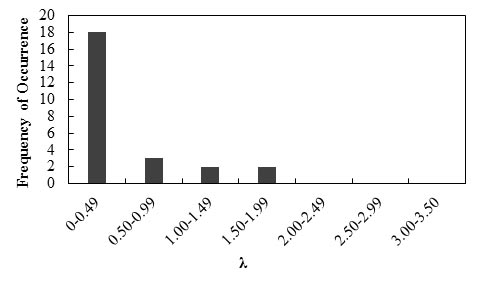
Figure 81. Graph. Frequency of occurrence histogram of λ for immediate settlements of shallow foundations using the modified Schmertmann method
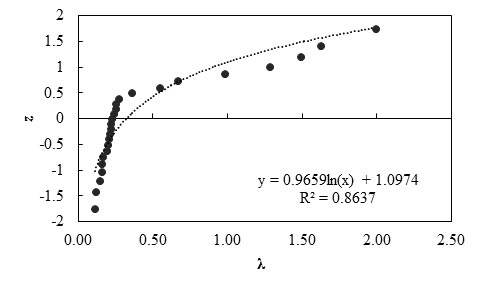
Figure 82. Graph. Probability plot for measured and predicted settlements using the modified Schmertmann method
Any interpretations of the results in this study should consider that the number of measured data points is statistically small. With this limitation, it was observed that the low mean λ (0.49) of the modified Schmertmann method indicates this method is highly conservative, and the prediction method overestimates immediate settlement of a shallow foundation by a factor of 2.04. The relatively high COV value (1.10) indicates the method has relatively low reliability.
Table 16 lists the predicted and measured values of immediate settlement of shallow foundations as well as λ and z for each measured data point. Based on the results, the mean λ is 0.49, σ is 0.31, and COV is 0.63.
| Case History No. |
Applied Pressure (kPa) |
Measured Immediate Settlement (mm) |
Predicted Immediate Settlement (mm) |
λ (Measured/ Predicted) |
z |
|---|---|---|---|---|---|
| 1 | 315.2 | 4.3 | 29.2 | 0.15 | -1.75 |
| 496.4 | 7.4 | 38.7 | 0.19 | -1.02 | |
| 2 | 235.6 | 3.1 | 19.2 | 0.16 | -1.2 |
| 348.0 | 5.9 | 25.4 | 0.23 | -0.73 | |
| 444.9 | 10.6 | 30.0 | 0.35 | -0.29 | |
| 3 | 188.2 | 2.4 | 10.4 | 0.23 | -0.87 |
| 292.0 | 5.5 | 14.9 | 0.37 | -0.19 | |
| 395.8 | 10.2 | 18.9 | 0.54 | 0.5 | |
| 488.3 | 16.9 | 22.1 | 0.76 | 0.87 | |
| 4 | 130.7 | 1.6 | 6.2 | 0.26 | -0.61 |
| 390.7 | 11.4 | 15.8 | 0.72 | 0.73 | |
| 490.9 | 18.1 | 18.9 | 0.96 | 1.2 | |
| 5 | 90.7 | 1.2 | 4.6 | 0.26 | -0.5 |
| 194.7 | 3.6 | 9.2 | 0.39 | -0.1 | |
| 290.7 | 7.9 | 13.0 | 0.61 | 0.61 | |
| 390.9 | 14.9 | 16.5 | 0.90 | 1.02 | |
| 487.3 | 25.9 | 19.6 | 1.32 | 1.75 | |
| 6 | 95.8 | 9.9 | 19.9 | 0.50 | 0.39 |
| 7 | 131.7 | 11.9 | 27.2 | 0.44 | 0.19 |
| 8 | 158.0 | 7.9 | 26.4 | 0.30 | -0.39 |
| 9 | 214.5 | 4.1 | 29.5 | 0.14 | -1.41 |
| 10 | 181.9 | 11.9 | 27.9 | 0.43 | 0.1 |
| 11 | 230.8 | 21.1 | 19.2 | 1.10 | 1.41 |
| 12 | 72.8 | 11.9 | 28.7 | 0.41 | 0 |
| 13 | 196.3 | 33.0 | 67.0 | 0.49 | 0.29 |
| 1 psi = 6.89 kPa 1 inch = 25.4 mm |
|||||
Figure 83 shows the frequency of occurrence histogram of λ. The probability plot for λ is depicted in figure 84. The curve follows a lognormal distribution.
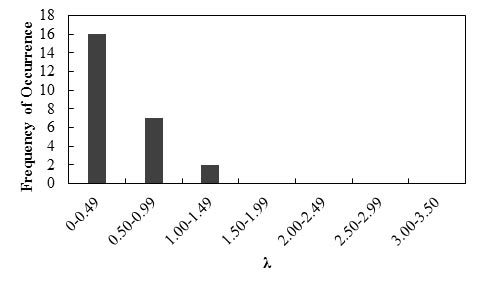
Figure 83. Graph. Frequency of occurrence histogram of λ; for immediate settlements of shallow foundations using the Hough method
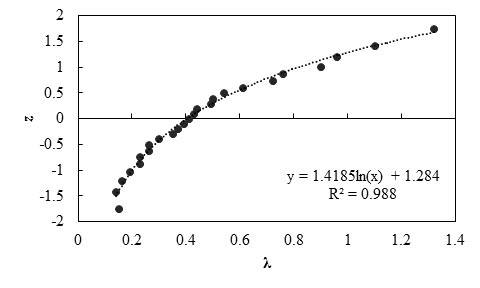
Figure 84. Graph. Probability plot for measured and predicted settlement using the Hough metho
Any interpretations of the results in this study should consider that the number of measured data points is statistically small. With this limitation, it was observed that the low mean λ (0.49) of the Hough method indicates this method is highly conservative, and the prediction method overestimates immediate settlement of a shallow foundation by a factor of 2.04. The relatively low COV value (0.63) indicates the method has fair reliability. The overestimation of the Hough method agrees with the conclusion from the FHWA report, Spread Footings for Highway Bridges, which concluded that settlements estimated by the modified Hough method are usually overestimated by a factor of 2 or more.(3)
Table 17 lists the predicted and measured values of immediate settlements of shallow foundations and λ and z for each measured data point. Based on the results, the mean λ is 0.79, σ is 0.77, and COV is 0.97.
| Case History No. |
Applied Pressure (kPa) |
Measured Immediate Settlement (mm) |
Predicted Immediate Settlement (mm) |
λ (Measured/ Predicted) |
z |
|---|---|---|---|---|---|
| 1 | 315.2 | 4.3 | 14.1 | 0.30 | -0.87 |
| 496.4 | 7.4 | 22.6 | 0.33 | -0.39 | |
| 2 | 235.6 | 3.1 | 12.2 | 0.25 | -1.02 |
| 348.0 | 5.9 | 18.3 | 0.32 | -0.5 | |
| 444.9 | 10.6 | 23.7 | 0.45 | 0 | |
| 3 | 188.2 | 2.4 | 11.1 | 0.22 | -1.41 |
| 292.0 | 5.5 | 17.5 | 0.31 | -0.61 | |
| 395.8 | 10.2 | 24.1 | 0.42 | -0.19 | |
| 488.3 | 16.9 | 29.9 | 0.57 | 0.19 | |
| 4 | 130.7 | 1.6 | 7.8 | 0.21 | -1.75 |
| 390.7 | 11.4 | 24.6 | 0.46 | 0.1 | |
| 490.9 | 18.1 | 31.2 | 0.58 | 0.29 | |
| 5 | 90.7 | 1.2 | 5.2 | 0.23 | -1.2 |
| 194.7 | 3.6 | 11.8 | 0.31 | -0.73 | |
| 290.7 | 7.9 | 18.0 | 0.44 | -0.1 | |
| 390.9 | 14.9 | 24.5 | 0.61 | 0.39 | |
| 487.3 | 25.9 | 30.8 | 0.84 | 0.5 | |
| 6 | 95.8 | 9.9 | 4.7 | 2.11 | 1.41 |
| 7 | 131.7 | 11.9 | 7.1 | 1.68 | 1.02 |
| 8 | 158.0 | 7.9 | 7.0 | 1.13 | 0.87 |
| 9 | 214.5 | 4.1 | 10.1 | 0.41 | -0.29 |
| 10 | 181.9 | 11.9 | 10.7 | 1.11 | 0.73 |
| 11 | 230.8 | 21.1 | 6.1 | 3.46 | 1.75 |
| 12 | 72.8 | 11.9 | 6.3 | 1.89 | 1.2 |
| 13 | 196.3 | 33.0 | 32.3 | 1.02 | 0.61 |
| 1 psi = 6.89 kPa 1 inch = 25.4 mm |
|||||
Figure 85 shows the frequency of occurrence histogram of λ. The probability plot for λ is depicted in figure 86. The curve follows a lognormal distribution.
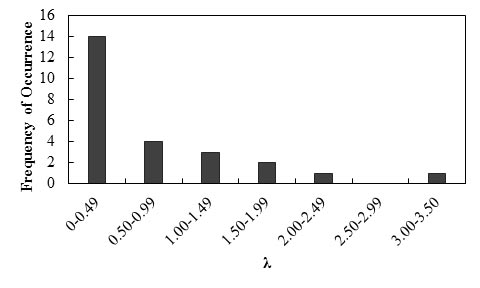
Figure 85. Graph. Frequency of occurrence histogram of λ for immediate settlements of shallow foundations using the Peck and Bazaraa method
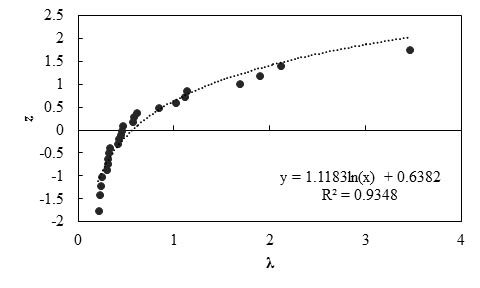
Figure 86. Graph. Probability plot for measured and predicted settlement using the Peck and Bazaraa method
Any interpretations of the results in this study should consider that the number of measured data points is statistically small. With this limitation, it was observed that the less-than-unity mean λ value (0.79) indicates the Peck and Bazaraa method is a conservative prediction method, and the prediction method overestimates the settlement of a shallow foundation by a factor of 1.26. The COV value of 0.97 indicates the method has relatively fair reliability.
Table 18 lists the predicted and measured values of immediate settlements of shallow foundations and λ and z for each measured data point. Based on the results, the mean λ is 0.62, σ is 0.49, and COV is 0.79.
| Case History No. |
Applied Pressure (kPa) |
Measured Immediate Settlement (mm) |
Predicted Immediate Settlement (mm) |
λ (Measured/ Predicted) |
z |
|---|---|---|---|---|---|
| 1 | 315.2 | 4.3 | 10.0 | 0.43 | -0.1 |
| 496.4 | 7.4 | 15.7 | 0.47 | 0 | |
| 2 | 235.6 | 3.1 | 9.9 | 0.31 | -0.73 |
| 348.0 | 5.9 | 14.6 | 0.40 | -0.39 | |
| 444.9 | 10.6 | 18.7 | 0.57 | 0.29 | |
| 3 | 188.2 | 2.4 | 11.3 | 0.21 | -1.2 |
| 292.0 | 5.5 | 17.5 | 0.31 | -0.61 | |
| 395.8 | 10.2 | 23.8 | 0.43 | -0.29 | |
| 488.3 | 16.9 | 29.3 | 0.58 | 0.39 | |
| 4 | 130.7 | 1.6 | 8.9 | 0.18 | -1.75 |
| 390.7 | 11.4 | 26.6 | 0.43 | -0.19 | |
| 490.9 | 18.1 | 33.5 | 0.54 | 0.1 | |
| 5 | 90.7 | 1.2 | 6.2 | 0.19 | -1.41 |
| 194.7 | 3.6 | 13.3 | 0.27 | -1.02 | |
| 290.7 | 7.9 | 19.8 | 0.40 | -0.5 | |
| 390.9 | 14.9 | 26.6 | 0.56 | 0.19 | |
| 487.3 | 25.9 | 33.2 | 0.78 | 0.87 | |
| 6 | 95.8 | 9.9 | 6.6 | 1.50 | 1.41 |
| 7 | 131.7 | 11.9 | 11.2 | 1.06 | 1.2 |
| 8 | 158.0 | 7.9 | 11.1 | 0.71 | 0.61 |
| 9 | 214.5 | 4.1 | 15.0 | 0.27 | -0.87 |
| 10 | 181.9 | 11.9 | 17.4 | 0.68 | 0.5 |
| 11 | 230.8 | 21.1 | 8.6 | 2.45 | 1.75 |
| 12 | 72.8 | 11.9 | 11.9 | 1.00 | 1.02 |
| 13 | 196.3 | 33.0 | 43.3 | 0.76 | 0.73 |
| 1 psi = 6.89 kPa 1 inch = 25.4 mm |
|||||
Figure 87 shows the frequency of occurrence histogram of λ. The probability plot for λ is depicted in figure 88. The curve follows a lognormal distribution.
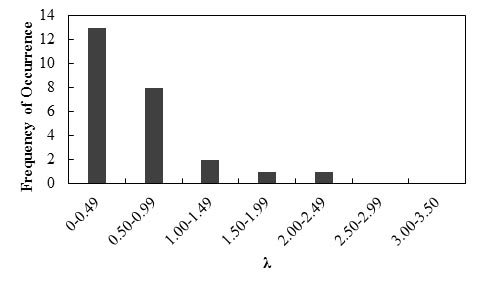
Figure 87. Graph. Frequency of occurrence histogram of λ for immediate settlements of shallow foundations using the Burland and Burbidge method
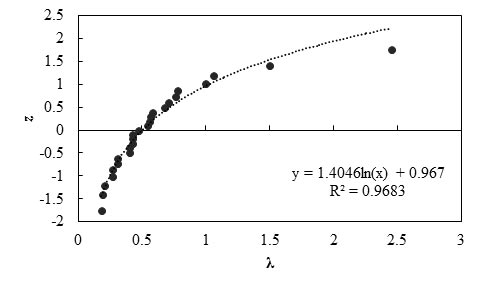
Figure 88. Graph. Probability plot for measured and predicted settlement using the Burland and Burbidge method
Any interpretations of the results in this study should consider that the number of measured data points is statistically small. With this limitation, it was observed that the less-than-unity mean λ value (0.62) indicates that the Burland and Burbidge method is a conservative prediction method, and the prediction method overestimates the settlement of a shallow foundation by a factor of 1.64. The relatively low COV value (0.79) indicates the method has fair reliability.
Table 19 lists the predicted and measured values of immediate settlement of shallow foundations and λ and z for each measured data point. Based on the results, the mean λ is 1.11, σ is 0.85, and COV is 0.77.
| Case History No. |
Applied Pressure (kPa) |
Measured Immediate Settlement (mm) |
Predicted Immediate Settlement (mm) |
λ (Measured/ Predicted) |
z |
|---|---|---|---|---|---|
| 1 | 315.2 | 4.3 | 4.4 | 0.98 | 0.29 |
| 496.4 | 7.4 | 6.9 | 1.07 | 0.5 | |
| 2 | 235.6 | 3.1 | 5.0 | 0.62 | -0.61 |
| 348.0 | 5.9 | 7.4 | 0.80 | -0.19 | |
| 444.9 | 10.6 | 9.5 | 1.12 | 0.61 | |
| 3 | 188.2 | 2.4 | 6.8 | 0.35 | -1.02 |
| 292.0 | 5.5 | 10.5 | 0.52 | -0.73 | |
| 395.8 | 10.2 | 14.3 | 0.71 | -0.29 | |
| 488.3 | 16.9 | 17.6 | 0.96 | 0.19 | |
| 4 | 130.7 | 1.6 | 5.6 | 0.29 | -1.75 |
| 390.7 | 11.4 | 16.6 | 0.69 | -0.39 | |
| 490.9 | 18.1 | 20.9 | 0.87 | 0 | |
| 5 | 90.7 | 1.2 | 3.8 | 0.32 | -1.41 |
| 194.7 | 3.6 | 8.1 | 0.44 | -0.87 | |
| 290.7 | 7.9 | 12.0 | 0.66 | -0.5 | |
| 390.9 | 14.9 | 16.2 | 0.92 | 0.1 | |
| 487.3 | 25.9 | 20.2 | 1.28 | 0.73 | |
| 6 | 95.8 | 9.9 | 5.4 | 1.83 | 0.87 |
| 7 | 131.7 | 11.9 | 5.8 | 2.05 | 1.02 |
| 8 | 158.0 | 7.9 | 9.4 | 0.84 | -0.1 |
| 9 | 214.5 | 4.1 | 12.0 | 0.34 | -1.2 |
| 10 | 181.9 | 11.9 | 11.3 | 1.05 | 0.39 |
| 11 | 230.8 | 21.1 | 6.2 | 3.40 | 1.75 |
| 12 | 72.8 | 11.9 | 3.6 | 3.31 | 1.41 |
| 13 | 196.3 | 33.0 | 14.1 | 2.34 | 1.2 |
| 1 psi = 6.89 kPa 1 inch = 25.4 mm |
|||||
Figure 89 shows the frequency of occurrence histogram of λ. The probability plot for λ is depicted in figure 90. The curve follows a lognormal distribution.
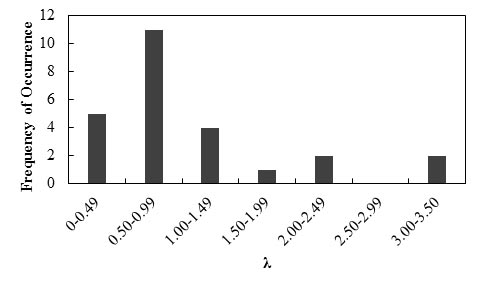
Figure 89. Graph. Frequency of occurrence histogram of λ for immediate settlements of shallow foundations using the D’Appolonia method
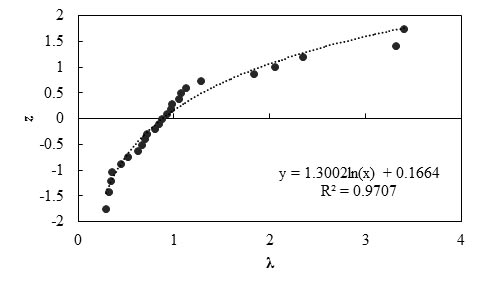
Figure 90. Graph. Probability plot for measured and predicted settlement using the D’Appolonia method
Any interpretations of the results in this study should consider that the number of measured data points is statistically small. With this limitation, it was observed that the slightly higher-than-unity mean λ value (1.11) indicates the D’Appolonia method is a slightly unconservative prediction method, and the predicted immediate settlement is on average 91 percent of the actually measured settlement of a shallow foundation. The relatively low COV value (0.77) indicates the method has fair reliability.
Table 20 summarizes the statistical analyses of the five prediction methods for immediate settlement of shallow foundation on granular soils. Any interpretations of the results in this study should consider that the number of measured data points is statistically small. With this limitation, it was observed that four of the five methods (modified Schmertmann, Hough,
Peck and Bazaraa, and Burland and Burbidge) overestimate immediate settlement, while the D’Appolonia method slightly underestimates immediate settlement. In comparison, the D’Appolonia method is the most accurate method with the mean λ the closest to unity and relatively small COV, followed by the Peck and Barazaa method and the Burland and Burbidge method. Both the modified Schmertmann method and the Hough method overestimate immediate settlement of shallow foundations on granular soils by a factor of approximately 2.
| Statistical Parameters |
Modified Schmertmann Method |
Hough Method |
Peck and Barazaa Method |
Burland and Burbidge Method |
D’Appolonia Method |
|---|---|---|---|---|---|
| Mean λ | 0.49 | 0.49 | 0.79 | 0.62 | 1.11 |
| σ | 0.54 | 0.31 | 0.77 | 0.49 | 0.85 |
| COV | 1.10 | 0.63 | 0.97 | 0.79 | 0.77 |
A similar FHWA study was conducted by Gifford to evaluate the five methods based on the observed deformations of 34 bridge foundations, and their statistical results are listed in table 21 for comparison.(3) With the acknowledgement of the statistically small data set, Gifford concluded the following:(3)
| Statistical Parameters |
Modified Schmertmann Method* |
Hough Method** |
Peck and Barazaa Method* |
Burland and Burbidge Method** |
D’Appolonia Method* |
|---|---|---|---|---|---|
| Mean λ | 0.74 | 0.69 | 1.21 | 1.14 | 1.33 |
| σ | 0.28 | 0.49 | 0.55 | 1.69 | 0.94 |
| COV | 0.38 | 0.70 | 0.45 | 0.79 | 0.7 |
| *Based on 10 bridge foundations. **Based on 24 bridge foundations. |
|||||
In this section, the empirical equation by Adams et al. for predicting vertical deformation of GRS walls and abutments is evaluated using field observation data.(32) To calculate the vertical displacement of a GRS wall, the composite Young’s modulus of the GRS wall (EGRS) is needed. The equation by Holtz and Lee is used to calculate the GRS composite Young’s modulus (see figure 91).(115) In deriving this equation for the GRS composite Young’s modulus, it is assumed that the stress-strain behavior of the soil and reinforcement follows Hooke’s Law and that the deformation of the composite material is uniform.
![]()
Figure 91. Equation. Elastic modulus of GRS composite
Where:
Es = Elastic modulus of soil.
tR= Thickness of reinforcement.
Since Sv - tR ≈ Sv and ER = J/tR, where J is the stiffness of the reinforcement, then figure 91 can be simplified as follows:
![]()
Figure 92. Equation. Elastic modulus of GRS composite (modified equation)
Where Ecomp is the elastic modulus of GRS composite. Given q, b', a, H, and EGRS, the vertical displacement can be calculated using figure 67. Table 22 presents the parameters used for the evaluation.
| No. | H (m) |
a (m) |
b' (m) |
Sv (m) |
EGRS (kN/m2) |
Reference Number |
Wall Designations in the References |
|---|---|---|---|---|---|---|---|
| 1 | 4.65 | 0.15 | 0.91 | 0.2 | 62,731 | 70 | Wall section A |
| 2 | 4.65 | 0.15 | 0.91 | 0.2 | 62,669 | 70 | Wall section B |
| 3 | 4.35 | 1.5 | 1.0 | 0.3–0.6 | 20,253 | 75 | Wall section nonwoven |
| 4 | 4.35 | 1.5 | 1.0 | 0.3–0.6 | 20,653 | 75 | Wall section woven |
| 5 | 7.62 | 0.2 | 2.44 | 0.2 | 240,147 | 116 | |
| 6 | 5.9 | 1.35 | 3.81 | 0.4 | 62,700 | 63 | Wall section 800 |
| 7 | 5.9 | 1.35 | 3.81 | 0.4 | 62,700 | 63 | Wall section 400 |
| 8 | 4.5 | 1.35 | 3.81 | 0.4 | 62,700 | 63 | Wall section 200 |
|
1 ft = 0.305 m 1 kN/m2 = 20.89 lbf/ft2 |
|||||||
Table 23 lists the predicted and measured values of the vertical deformation predictions of GRS walls and abutments and λ and z for each data point. Based on the results, the mean λ is 7.31, σ is 5.73, and COV is 0.78.
| Case History No. |
Applied Pressure (kPa) |
Measured Vertical Displacement (mm) |
Predicted Vertical Displacement (mm) |
λ (Measured/ Predicted) |
z |
|---|---|---|---|---|---|
| 1 | 100 | 14.4 | 1.9 | 7.58 | 0 |
| 200 | 32.7 | 3.9 | 8.38 | 0.11 | |
| 300 | 55.4 | 5.8 | 9.55 | 0.43 | |
| 400 | 75.5 | 7.8 | 9.68 | 0.55 | |
| 2 | 100 | 25.6 | 1.9 | 13.47 | 0.97 |
| 200 | 58.9 | 3.9 | 15.10 | 1.15 | |
| 300 | 103.1 | 5.8 | 17.78 | 1.38 | |
| 400 | 158.9 | 7.8 | 20.37 | 1.73 | |
| 3 | 50 | 3.5 | 3.2 | 1.09 | -1.38 |
| 100 | 7.7 | 6.5 | 1.18 | -1.15 | |
| 150 | 50.6 | 9.7 | 5.22 | -0.21 | |
| 180 | 115.6 | 11.7 | 9.88 | 0.68 | |
| 200 | 161.5 | 13.0 | 12.42 | 0.81 | |
| 4 | 50 | 4.5 | 3.2 | 1.41 | -0.81 |
| 100 | 18.2 | 6.3 | 2.89 | -0.32 | |
| 150 | 60.4 | 9.5 | 6.36 | -0.11 | |
| 180 | 95.8 | 11.4 | 8.40 | 0.21 | |
| 200 | 113.0 | 12.7 | 8.90 | 0.32 | |
| 5 | 195 | 5.1 | 2.2 | 2.32 | -0.55 |
| 260 | 8.2 | 2.9 | 2.83 | -0.43 | |
| 6 | 115 | 3.0 | 5.4 | 0.56 | -1.73 |
| 7 | 115 | 7.0 | 5.4 | 1.30 | -0.97 |
| 8 | 115 | 7.0 | 4.6 | 1.52 | -0.68 |
| 1 psi = 6.89 kPa 1 inch = 25.4 mm |
|||||
Figure 93 shows the frequency of occurrence histogram of λ. The probability plot for λ is depicted in figure 94. The curve follows a lognormal distribution.
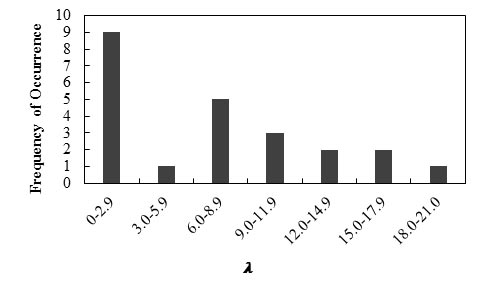
Figure 93. Graph. Frequency of occurrence histogram of λ of vertical displacement of abutments and GRS walls
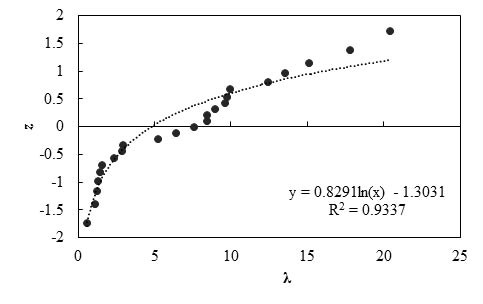
R2 = Coefficient of determination.
Figure 94. Graph. Probability plot for measured and predicted vertical displacement of abutments and GRS walls
Any interpretations of the results in this study should consider that the number of measured data points is statistically small. With this limitation, it was observed that the high mean λ value (7.31) indicates this prediction method for vertical deformations of GRS walls and abutments is unconservative. It should be noted that the accuracy of this method is affected by the accuracy in determination of the Young’s modulus of the composite material. Since the proposed equation by Holtz and Lee (see figure 91) is associated with simplifying assumptions, its accuracy also depends on the accurate estimation of Young’s moduli of the reinforcement and soil.(115) Any error in these estimations may lead to error in the prediction results.
In this section, field observations of lateral displacements of GRS walls and abutments are applied to the six methods presented previously to evaluate their conservativeness, accuracy, and reliability. Table 24 presents the parameters used for the evaluation.
| Case History No. |
H (m) |
L (m) |
Sv (m) |
Φ (Degree) |
ψ (Degree) |
Facing Type | Reference Number |
Wall Designations in the References |
|---|---|---|---|---|---|---|---|---|
| 1 | 3.6 | 2.5 | 0.6 | 41(DS) | 11 | CMU | 71 | Wall 1 |
| 2 | 3.6 | 2.5 | 0.6 | 41(DS) | 11 | CMU | 71 | Wall 2 |
| 3 | 3.6 | 2.5 | 0.9 | 41(DS) | 11 | CMU | 71 | Wall 3 |
| 4 | 4.0 | 3.0 | 0.4 | 32(DS) | 14 | Wrap around | 117 | N/A |
| 5 | 6.0 | 3.6 | 0.6 | 40(PS) | 11 | CMU | 118 | Wall 1 |
| 6 | 6.0 | 3.6 | 0.6 | 30(PS) | 11 | CMU | 118 | Wall 2 |
| 7 | 6.0 | 3.6 | 0.6 | 30(PS) | 11 | CMU | 118 | Wall 3 |
| 8 | 6.0 | 3.6 | 0.6 | 20(PS) | 11 | CMU | 118 | Wall 4 |
| 9 | 4.0 | 3.0 | 0.4 | 33(TT) | 3 | Wrap around | 119 | N/A |
| 10 | 3.6 | 2.5 | 0.6 | 41(DS) | 11 | CMU | 76 | Wall 5 |
| 11 | 5.3 | 2.0 | 0.5 | 40 | 10 | Wrap around | 120 | N/A |
| 12 | 7.62 | 3.2–4.4 | 0.2 | — | — | CMU | 116 | N/A |
| 13 | 4.35 | 1.3–3.6 | 0.3–0.6 | — | — | CMU | 75 | Woven wall |
| 14 | 4.35 | 2.7–3.6 | 0.3–0.6 | — | — | CMU | 75 | Nonwoven wall |
| 15 | 5.9 | 8–12 | 0.4 | — | — | CMU | 63 | Wall section 800 |
| 16 | 5.9 | 8–12 | 0.4 | — | — | CMU | 63 | Wall section 400 |
| 17 | 4.5 | 8–12 | 0.4 | — | — | CMU | 63 | Wall section 200 |
| 18 | 4.65 | 3.15 | 0.2 | — | — | CMU | 70 | Wall section A |
| 19 | 4.65 | 3.15 | 0.2 | — | — | CMU | 70 | Wall section B |
|
1 ft = 0.305 m — Indicates the values are not provided. DS = Direct shear test. PS = Plain strain test. TT = Triaxial test. N/A = No wall designation was provided. |
||||||||
Table 25 lists the predicted and measured values of the lateral displacements of GRS walls and abutments and λ and z for each data point. Based on the results, the mean λ is 0.12, σ is 0.10, and COV is 0.83.
| Case History No. |
Measured Maximum Lateral Displacement (mm) |
Predicted Maximum Lateral Displacement (mm) |
λ (Measured/ Predicted) |
z |
|---|---|---|---|---|
| 1 | 5.2 | 48.4 | 0.11 | 0.11 |
| 2 | 7.9 | 48.4 | 0.16 | 0.6 |
| 3 | 6.0 | 48.4 | 0.12 | 0.35 |
| 4 | 15.7 | 50.6 | 0.31 | 1.34 |
| 5 | 3.2 | 94.6 | 0.03 | -0.6 |
| 6 | 8.4 | 94.6 | 0.09 | -0.35 |
| 7 | 1.2 | 94.6 | 0.01 | -1.34 |
| 8 | 2.6 | 94.6 | 0.03 | -0.91 |
| 9 | 5.1 | 50.6 | 0.10 | -0.11 |
| 10 | 12.8 | 48.4 | 0.26 | 0.91 |
| 1 inch = 25.4 mm | ||||
Figure 95 shows the frequency of occurrence histogram of λ. The probability plot for λ values using the FHWA method is depicted in figure 96. The curve follows a lognormal distribution.
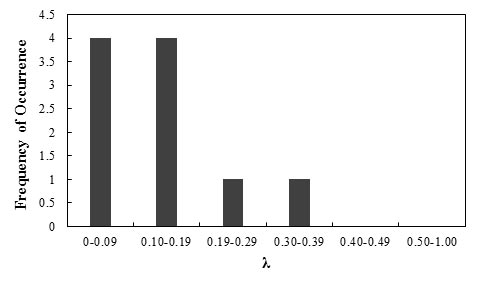
Figure 95. Graph. Frequency of occurrence histogram of λ for the lateral displacement of GRS walls and abutments using the FHWA method
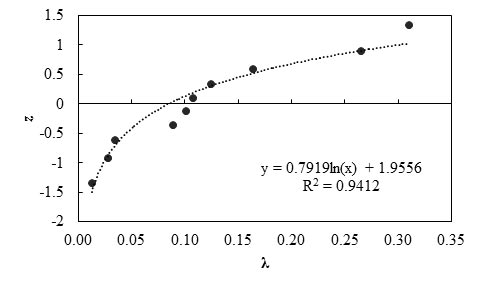
Figure 96. Graph. Probability plot for measured and predicted lateral displacement of GRS walls using the FHWA method.
Any interpretations of the results in this study should consider that the number of measured data points is statistically small. With this limitation, it was observed that the lower-than-unity mean λ (0.12) of the FHWA method indicates the method is highly conservative, and the predictions significantly overestimate the lateral deformations by a factor of 8.33. The relatively low COV value (0.83) indicates a fair reliability of this method.
Table 26 lists the predicted and measured values of the lateral displacements of GRS walls and abutments and λ and z for each data point. Based on the results, the mean λ is 1.38, σ is 1.59, and COV is 1.15.
| Case History No. |
Elevation (m) |
Measured Lateral Displacement (mm) |
Predicted Lateral Displacement (mm) |
λ (Measured/ Predicted) |
z | Notes |
|---|---|---|---|---|---|---|
| 1 | 3.3 | 1.5 | 0.7 | 2.11 | 0.84 | Results are obtained at EOC |
| 2.7 | 5.1 | 2.4 | 2.12 | 0.98 | ||
| 2.1 | 5.2 | 3.0 | 1.74 | 0.55 | ||
| 1.5 | 5.0 | 8.9 | 0.56 | -0.35 | ||
| 0.9 | 3.7 | 7.4 | 0.51 | -0.5 | ||
| 0.3 | 2.4 | 6.9 | 0.34 | -1.06 | ||
| 2 | 3.3 | 6.3 | 4.5 | 1.39 | 0.40 | Results are obtained at EOC |
| 2.7 | 8.0 | 5.9 | 1.35 | 0.30 | ||
| 2.1 | 6.4 | 6.9 | 0.93 | 0.11 | ||
| 1.5 | 4.7 | 12.3 | 0.38 | -0.98 | ||
| 0.9 | 3.8 | 9.9 | 0.39 | -0.91 | ||
| 0.3 | 1.2 | 7.2 | 0.17 | -1.46 | ||
| 3 | 3.1 | 2.1 | 9.4 | 0.22 | -1.33 | Results are obtained at EOC |
| 2.2 | 6.0 | 8.7 | 0.69 | -0.25 | ||
| 1.3 | 5.2 | 8.4 | 0.62 | -0.3 | ||
| 0.5 | 2.1 | 6.6 | 0.32 | -1.14 | ||
| 4 | 3.6 | 0.8 | 0.0 | N/A | N/A | Results are obtained at EOC |
| 2.8 | 9.8 | 7.2 | 1.36 | 0.35 | ||
| 2 | 15.7 | 9.6 | 1.64 | 0.45 | ||
| 1.2 | 8.6 | 0.9 | 9.56 | 2.09 | ||
| 0.4 | 13.1 | 6.0 | 2.18 | 1.14 | ||
| 9 | 3.6 | 0.2 | 0.2 | 1.33 | 0.25 | Results are obtained at EOC |
| 2.8 | 5.1 | 7.3 | 0.67 | -0.21 | ||
| 2 | 4.2 | 9.6 | 0.44 | -0.78 | ||
| 1.2 | 2.3 | 3.0 | 0.76 | 0.02 | ||
| 0.4 | 2.8 | 6.0 | 0.47 | -0.60 | ||
| 10 | 3.3 | 3.9 | 5.0 | 0.78 | 0.07 | Results are obtained at EOC |
| 2.7 | 9.9 | 13.4 | 0.74 | -0.07 | ||
| 2.1 | 11.4 | 15.9 | 0.72 | -0.11 | ||
| 1.5 | 12.6 | 13.4 | 0.94 | 0.16 | ||
| 0.9 | 8.1 | 16.4 | 0.49 | -0.55 | ||
| 0.3 | 1.9 | 6.3 | 0.30 | -1.23 | ||
| 11 | 4.5 | 81.5 | 47.5 | 1.72 | 0.5 | Results are obtained under 84 kPa of applied pressure |
| 4 | 82.1 | 44.0 | 1.87 | 0.66 | ||
| 3.5 | 82.7 | 42.5 | 1.95 | 0.72 | ||
| 3 | 78.2 | 44.0 | 1.78 | 0.60 | ||
| 2.5 | 71.1 | 33.5 | 2.12 | 1.06 | ||
| 2 | 60.3 | 28.5 | 2.12 | 0.91 | ||
| 1.5 | 45.1 | 21.5 | 2.10 | 0.78 | ||
| 1 | 31.5 | 11.0 | 2.86 | 1.23 | ||
| 0.5 | 18.9 | 6.5 | 2.91 | 1.33 | ||
| 12 | 6.5 | 8.0 | 2.1 | 3.81 | 1.60 | Results are obtained under 131 kPa of applied pressure |
| 5.9 | 8.0 | 2.6 | 3.08 | 1.46 | ||
| 5.1 | 14.0 | 2.2 | 6.36 | 1.79 | ||
| 13 | 3.8 | 83.3 | 111.3 | 0.75 | -0.02 | Results are obtained under 190 kPa of applied pressure |
| 2.6 | 57.7 | 46.6 | 1.24 | 0.21 | ||
| 1.5 | 21.6 | 30.2 | 0.71 | -0.16 | ||
| 0.6 | 7.2 | 15.7 | 0.46 | -0.66 | ||
| 14 | 3.8 | 106.7 | 244.2 | 0.44 | -0.72 | Results are obtained under 190 kPa of applied pressure |
| 2.6 | 96.9 | 182.2 | 0.53 | -0.45 | ||
| 1.5 | 21.8 | 53.6 | 0.41 | -0.84 | ||
| 0.6 | 0.9 | 8.8 | 0.10 | -1.79 | ||
| 15 | 2.4 | 1.1 | 19.8 | 0.06 | -2.09 | Results are obtained under 115 kPa of applied pressure |
| 4 | 4.0 | 23.8 | 0.17 | -1.60 | ||
| 4.8 | 4.0 | 7.4 | 0.54 | -0.40 | ||
|
1 ft = 0.305 m 1 inch = 25.4 mm 1 psi = 6.89 kPa N/A = not applicable since the predicted value is zero. |
||||||
Figure 97 shows the frequency of occurrence histogram of λ. The probability plot for λ value obtained based on the result of the Geoservices method is depicted in figure 98. The curve follows a lognormal distribution.
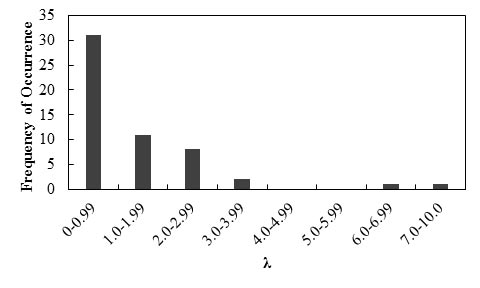
Figure 97. Graph. Frequency of occurrence histogram of λ for the lateral displacement of GRS walls and abutments using the Geoservices method
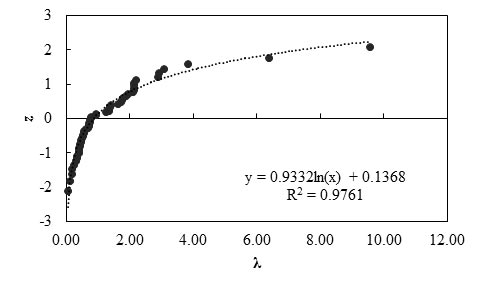
Figure 98. Graph. Probability plot for measured and predicted lateral displacement of GRS walls using the Geoservices method
Any interpretations of the results in this study should consider that the number of measured data points is statistically small. With this limitation, it was observed that the greater-than-unity value of the mean λ (1.38) indicates the Geoservices method is an unconservative prediction method, and the predicted lateral displacement is on average 72 percent of the actually measured lateral displacements. The relatively high COV value (1.15) indicates a relatively low reliability of this method.
Table 27 lists the predicted and measured values of the lateral displacements of GRS walls and abutments and λ and z for each data point. Based on the results, the mean λ is 0.59, σ is 0.64, and COV is 1.08.
| Case History No. |
Elevation (m) |
Measured Lateral Displacement (mm) |
Predicted Lateral Displacement (mm) |
λ (Measured/ Predicted) |
z | Notes |
|---|---|---|---|---|---|---|
| 1 | 3.3 | 1.5 | 1.4 | 1.07 | 1.33 | Results are obtained at EOC |
| 2.7 | 5.1 | 4.7 | 1.09 | 1.46 | ||
| 2.1 | 5.2 | 5.9 | 0.88 | 1.06 | ||
| 1.5 | 5.0 | 17.3 | 0.29 | -0.4 | ||
| 0.9 | 3.7 | 14.4 | 0.26 | -0.72 | ||
| 0.3 | 2.4 | 13.5 | 0.18 | -1.33 | ||
| 2 | 3.3 | 6.3 | 8.7 | 0.72 | 0.78 | Results are obtained at EOC |
| 2.7 | 8.0 | 11.5 | 0.70 | 0.60 | ||
| 2.1 | 6.4 | 13.4 | 0.48 | 0.11 | ||
| 1.5 | 4.7 | 23.8 | 0.20 | -1.14 | ||
| 0.9 | 3.8 | 19.3 | 0.20 | -1.06 | ||
| 0.3 | 1.2 | 13.9 | 0.09 | -1.79 | ||
| 3 | 3.1 | 2.1 | 18.3 | 0.11 | -1.6 | Results are obtained at EOC |
| 2.2 | 6.0 | 16.8 | 0.36 | -0.21 | ||
| 1.3 | 5.2 | 16.3 | 0.32 | -0.35 | ||
| 0.5 | 2.1 | 12.8 | 0.16 | -1.46 | ||
| 4 | 3.6 | 0.8 | 0 | N/A | N/A | Results are obtained at EOC |
| 2.8 | 9.8 | 15.4 | 0.64 | 0.4 | ||
| 2 | 15.7 | 20.5 | 0.77 | 0.91 | ||
| 1.2 | 8.6 | 1.9 | 4.53 | 2.09 | ||
| 0.4 | 13.1 | 12.8 | 1.02 | 1.23 | ||
| 9 | 3.6 | 0.2 | 0.3 | 0.67 | 0.5 | Results are obtained at EOC |
| 2.8 | 5.1 | 15.6 | 0.33 | -0.3 | ||
| 2 | 4.2 | 20.5 | 0.20 | -0.91 | ||
| 1.2 | 2.3 | 6.4 | 0.36 | -0.16 | ||
| 0.4 | 2.8 | 12.8 | 0.22 | -0.84 | ||
| 10 | 3.3 | 3.9 | 5.4 | 0.72 | 0.72 | Results are obtained at EOC |
| 2.7 | 9.9 | 14.5 | 0.68 | 0.55 | ||
| 2.1 | 11.4 | 17.2 | 0.66 | 0.45 | ||
| 1.5 | 12.6 | 14.5 | 0.87 | 0.98 | ||
| 0.9 | 8.1 | 17.7 | 0.46 | -0.02 | ||
| 0.3 | 1.9 | 6.8 | 0.28 | -0.50 | ||
| 11 | 4.5 | 81.5 | 190.0 | 0.43 | -0.11 | Results are obtained under 84 kPa of applied pressure |
| 4 | 82.1 | 176.0 | 0.47 | 0.07 | ||
| 3.5 | 82.7 | 170.0 | 0.49 | 0.16 | ||
| 3 | 78.2 | 176.0 | 0.44 | -0.07 | ||
| 2.5 | 71.1 | 134.0 | 0.53 | 0.30 | ||
| 2 | 60.3 | 114.0 | 0.53 | 0.25 | ||
| 1.5 | 45.1 | 86.0 | 0.52 | 0.21 | ||
| 1 | 31.5 | 44.0 | 0.72 | 0.66 | ||
| 0.5 | 18.9 | 26.0 | 0.73 | 0.84 | ||
| 12 | 6.5 | 8.0 | 7.3 | 1.10 | 1.10 | Results are obtained under 131 kPa of applied pressure |
| 5.9 | 8.0 | 8.8 | 0.91 | 1.14 | ||
| 5.1 | 14.0 | 7.6 | 1.84 | 1.79 | ||
| 13 | 3.8 | 83.3 | 180.4 | 0.46 | 0.02 | Results are obtained under 190 kPa of applied pressure |
| 2.6 | 57.7 | 104.2 | 0.55 | 0.35 | ||
| 1.5 | 21.6 | 77.7 | 0.28 | -0.55 | ||
| 0.6 | 7.2 | 36.6 | 0.20 | -1.06 | ||
| 14 | 3.8 | 106.7 | 398.2 | 0.27 | -0.6 | Results are obtained under 190 kPa of applied pressure |
| 2.6 | 96.9 | 338.5 | 0.29 | -0.45 | ||
| 1.5 | 21.8 | 121.0 | 0.18 | -1.23 | ||
| 0.6 | 0.9 | 22.6 | 0.04 | -2.09 | ||
| 15 | 2.4 | 1.1 | 3.2 | 0.34 | -0.25 | Results are obtained under 115 kPa of applied pressure |
| 4 | 4.0 | 15.2 | 0.26 | -0.66 | ||
| 4.8 | 4.0 | 16.4 | 0.24 | -0.78 | ||
|
1 ft = 0.305 m 1 inch = 25.4 mm 1 psi = 6.89 kPa N/A = not applicable since the predicted value is zero. |
||||||
Figure 99 shows the frequency of occurrence histogram of λ. The probability plot for λ value obtained based on the result of the CTI method is depicted in figure 100. The curve follows a lognormal distribution.
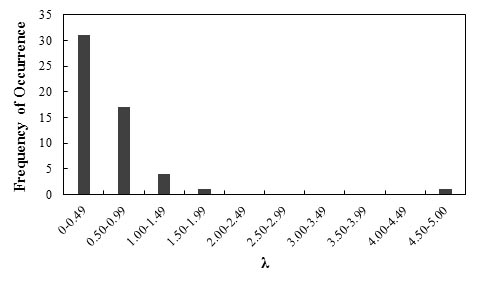
Figure 99. Graph. Frequency of occurrence histogram of λ for the lateral displacement of GRS walls and abutments using the CTI method
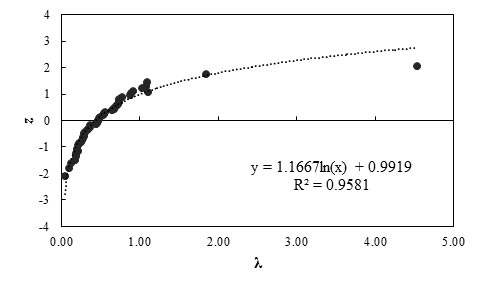
Figure 100. Graph. Probability plot for measured and predicted lateral displacement of GRS walls using the CTI method
Any interpretations of the results in this study should consider that the number of measured data points is statistically small. With this limitation, it was observed that the lower-than-unity mean λ (0.59) indicates the CTI method is a conservative prediction method, and it overestimates the lateral deformation by a factor of 1.69. The relative high COV value (1.08) indicates a relatively low reliability of this method.
Table 28 lists the predicted and measured values of the lateral displacements of GRS walls and abutments and λ and z for each data point. Based on the results, the mean λ is 0.74, σ is 0.59, and COV is 0.80.
| Case History No. |
Elevation (m) |
Measured Lateral Displacement (mm) |
Predicted Lateral Displacement (mm) |
λ (Measured/ Predicted) |
z | Notes |
|---|---|---|---|---|---|---|
| 4 | 3.6 | 0.79 | 6.0 | 0.13 | -1.28 | Results are obtained at EOC |
| 2.8 | 9.8 | 14.0 | 0.70 | 0.25 | ||
| 2.0 | 15.7 | 16.7 | 0.94 | 0.67 | ||
| 1.2 | 8.6 | 14.2 | 0.61 | 0 | ||
| 0.4 | 13.1 | 6.4 | 2.05 | 1.28 | ||
| 9 | 3.6 | 0.2 | 5.9 | 0.03 | -1.65 | Results are obtained at EOC |
| 2.8 | 5.1 | 13.8 | 0.37 | -0.67 | ||
| 2.0 | 4.2 | 16.4 | 0.26 | -0.84 | ||
| 1.2 | 2.3 | 14.0 | 0.16 | -1.04 | ||
| 0.4 | 2.8 | 6.3 | 0.44 | -0.52 | ||
| 11 | 4.5 | 81.5 | 36.1 | 2.26 | 1.65 | Results are obtained under 84 kPa of applied pressure |
| 4 | 82.1 | 62.6 | 1.31 | 1.04 | ||
| 3.5 | 82.7 | 82.1 | 1.01 | 0.84 | ||
| 3 | 78.2 | 94.8 | 0.82 | 0.52 | ||
| 2.5 | 71.1 | 98.0 | 0.73 | 0.39 | ||
| 2 | 60.3 | 94.2 | 0.64 | 0.13 | ||
| 1.5 | 45.1 | 83.2 | 0.54 | -0.13 | ||
| 1 | 31.5 | 62.3 | 0.51 | -0.25 | ||
| 0.5 | 18.9 | 39.1 | 0.48 | -0.39 | ||
|
1 ft = 0.305 m 1 inch = 25.4 mm 1 psi = 6.89 kPa |
||||||
Figure 101 shows the frequency of occurrence histogram of λ. The probability plot for λ value obtained based on the results of theJewell-Milligan method is depicted in figure 102. The curve follows a lognormal distribution.
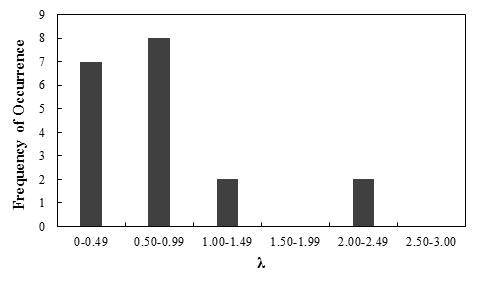
Figure 101. Graph. Frequency of occurrence histogram of λ for the lateral displacement of GRS walls and abutments using the Jewell-Milligan method
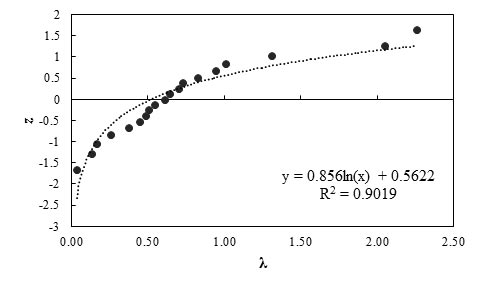
Figure 102. Graph. Probability plot for measured and predicted lateral displacement of GRS walls using the Jewell-Milligan method
Any interpretations of the results in this study should consider that the number of measured data points is statistically small. With this limitation, it was observed that the lower-than-unity mean λ (0.74) indicates the Jewell-Milligan method is a conservative prediction method, and it overestimates lateral deformation by a factor of 1.35. The relative low COV value (0.80) indicates the method has fair reliability.
Table 29 lists the predicted and measured values of the lateral displacements of GRS walls and abutments and λ and z for each data point. Based on the results, the mean λ is 0.24, σ is 0.12, and COV is 0.50.
| Case History No. |
Elevation (m) |
Measured Lateral Displacement (mm) |
Predicted Lateral Displacement (mm) |
λ (Measured/ Predicted) |
z | Notes |
|---|---|---|---|---|---|---|
| 1 | 3.3 | 1.5 | 4.7 | 0.3191 | 0.56 | Results are obtained at EOC |
| 2.7 | 5.1 | 13.8 | 0.3696 | 1.18 | ||
| 2.1 | 5.2 | 18.4 | 0.2826 | 0.42 | ||
| 1.5 | 5.0 | 18.7 | 0.2674 | 0.32 | ||
| 0.9 | 3.7 | 14.5 | 0.2552 | 0.19 | ||
| 0.3 | 2.4 | 5.9 | 0.4068 | 1.49 | ||
| 1 | 3.3 | 9.3 | 40.7 | 0.2285 | 0.11 | Results are obtained at 30 kPa of applied pressure |
| 2.7 | 7.2 | 43.3 | 0.1663 | -0.37 | ||
| 2.1 | 6.5 | 41.5 | 0.1566 | -0.42 | ||
| 1.5 | 5.2 | 35.3 | 0.1473 | -0.61 | ||
| 0.9 | 3.3 | 24.5 | 0.1347 | -0.83 | ||
| 0.3 | 1.4 | 9.1 | 0.1538 | -0.46 | ||
| 1 | 3.3 | 31.6 | 88.9 | 0.3555 | 0.89 | Results are obtained at 70 kPa of applied pressure |
| 2.7 | 31.3 | 82.0 | 0.3817 | 1.27 | ||
| 2.0 | 25.6 | 70.8 | 0.3616 | 1.1 | ||
| 1.5 | 15.5 | 56.1 | 0.2763 | 0.37 | ||
| 1.1 | 11.1 | 45.9 | 0.2418 | 0.15 | ||
| 0.5 | 4.7 | 23.5 | 0.2000 | -0.11 | ||
| 2 | 3.3 | 6.27 | 9.4 | 0.6670 | 2.12 | Results are obtained at EOC |
| 2.7 | 7.98 | 27.5 | 0.2902 | 0.46 | ||
| 2.1 | 6.41 | 36.8 | 0.1742 | -0.32 | ||
| 1.5 | 4.68 | 37.3 | 0.1255 | -1.1 | ||
| 0.9 | 3.83 | 29.0 | 0.1321 | -0.96 | ||
| 0.3 | 1.22 | 11.9 | 0.1025 | -1.49 | ||
| 2 | 3.3 | 11.4 | 81.8 | 0.1394 | -0.71 | Results are obtained at 30 kPa of applied pressure |
| 2.7 | 11.5 | 86.6 | 0.1328 | -0.89 | ||
| 2.0 | 10.5 | 81.9 | 0.1282 | -1.03 | ||
| 1.5 | 7.1 | 69.1 | 0.1027 | -1.37 | ||
| 1.1 | 8.0 | 58.6 | 0.1365 | -0.77 | ||
| 0.5 | 3.9 | 32.0 | 0.1219 | -1.18 | ||
| 2 | 3.3 | 46.5 | 177.3 | 0.2623 | 0.28 | Results are obtained at 70 kPa of applied pressure |
| 2.7 | 57.9 | 164.3 | 0.3524 | 0.77 | ||
| 2.0 | 50.6 | 140.7 | 0.3596 | 1.03 | ||
| 1.4 | 37.0 | 110.9 | 0.3336 | 0.66 | ||
| 1.1 | 32.6 | 91.8 | 0.3551 | 0.83 | ||
| 0.5 | 15.8 | 46.1 | 0.3427 | 0.71 | ||
| 3 | 3.1 | 2.07 | 9.2 | 0.2250 | 0.06 | Results are obtained at EOC |
| 2.2 | 6.00 | 20.2 | 0.2970 | 0.51 | ||
| 1.3 | 5.24 | 20.0 | 0.2620 | 0.24 | ||
| 0.5 | 2.14 | 10.4 | 0.2058 | -0.02 | ||
| 10 | 3.3 | 3.9 | 8.2 | 0.4756 | 1.83 | Results are obtained at EOC |
| 2.7 | 9.9 | 24.0 | 0.4125 | 1.64 | ||
| 2.1 | 11.4 | 32.0 | 0.3563 | 0.96 | ||
| 1.5 | 12.6 | 32.5 | 0.3877 | 1.37 | ||
| 0.9 | 8.1 | 25.2 | 0.3214 | 0.61 | ||
| 0.3 | 1.9 | 10.3 | 0.1845 | -0.19 | ||
| 10 | 3.3 | 10.4 | 69.5 | 0.1496 | -0.51 | Results are obtained at 30 kPa of applied pressure |
| 2.7 | 10.6 | 74.1 | 0.1430 | -0.66 | ||
| 2.1 | 7.8 | 71.1 | 0.1097 | -1.27 | ||
| 1.5 | 6.1 | 59.9 | 0.1018 | -1.64 | ||
| 0.8 | 3.5 | 37.7 | 0.0928 | -1.83 | ||
| 0.5 | 1.7 | 25.7 | 0.0661 | -2.12 | ||
| 10 | 3.3 | 27.5 | 151.0 | 0.1821 | -0.24 | Results are obtained at 70 kPa of applied pressure |
| 2.7 | 29.7 | 140.9 | 0.2108 | 0.02 | ||
| 2.1 | 25.0 | 122.6 | 0.2039 | -0.06 | ||
| 1.5 | 18.3 | 96.5 | 0.1896 | -0.15 | ||
| 0.8 | 10.1 | 57.1 | 0.1769 | -0.28 | ||
| 0.5 | 5.4 | 36.6 | 0.1475 | -0.56 | ||
|
1 ft = 0.305 m 1 inch = 25.4 mm 1 psi = 6.89 kPa |
||||||
Figure 103 shows the frequency of occurrence histogram of λ. The probability plot for the λ value obtained based on the result of the analytical model is depicted in figure 104. The curve follows a lognormal distribution.
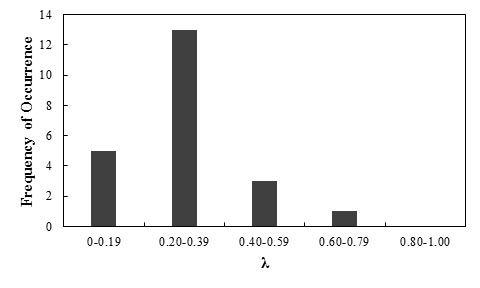
Figure 103. Graph. Frequency of occurrence histogram of λ for the lateral displacement of GRS walls and abutments using the Wu method
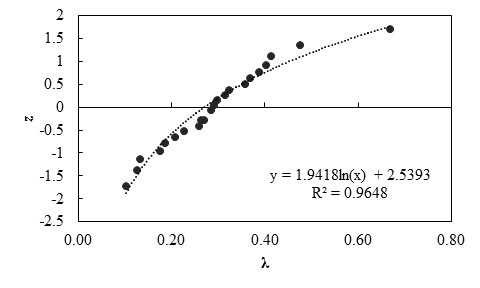
Figure 104. Graph. Probability plot for measured and predicted lateral displacement of GRS walls using the Wu method
Any interpretations of the results of this study should consider that the number of measured data points is statistically small. With this limitation, it was observed that the lower-than-unity mean λ (0.24) indicates the Wu method is a conservative prediction method, and it overestimates lateral deformation by a factor of 4.17. The low COV value (0.50) indicates the method has good reliability.
Table 30 lists the predicted and measured values of the lateral displacements of GRS walls and abutments and λ and z for each data point. Based on the results, the mean λ is 1.13, σ is 0.41, and COV is 0.36.
| Case History No. |
Applied Pressure (kPa) |
Measured Lateral Displacement (mm) |
Predicted Lateral Displacement (mm) |
λ (Measured/ Predicted) |
z | Notes |
|---|---|---|---|---|---|---|
| 11 | 84 | 82.7 | 73.4 | 1.13 | -0.10 | None |
| 12 | 131 | 14.3 | 15.2 | 0.94 | -0.29 | None |
| 13 | 0 | 8.6 | 11.4 | 0.75 | -0.50 | Results are obtained at EOC |
| 14 | 0 | 11.1 | 15.3 | 0.73 | -0.74 | Results are obtained at EOC |
| 15 | 115 | 10 | 5.6 | 1.79 | 1.43 | None |
| 16 | 115 | 9 | 12.7 | 0.71 | -1.02 | None |
| 17 | 115 | 7 | 16.0 | 0.44 | -1.43 | None |
| 18 | 207 | 23.4 | 16.3 | 1.44 | 0.74 | None |
| 475 | 57.3 | 41.8 | 1.37 | 0.50 | ||
| 19 | 214 | 36.4 | 27.5 | 1.32 | 0.29 | None |
| 317 | 57.8 | 45.4 | 1.27 | 0.10 | ||
| 414 | 113.4 | 69.2 | 1.64 | 1.02 | ||
|
1 psi = 6.89 kPa 1 inch = 25.4 mm |
||||||
Figure 105 shows the frequency of occurrence histogram of λ. The normal probability plot for λ value obtained based on the results of the Adams method is depicted in figure 106. The curve follows a normal distribution.
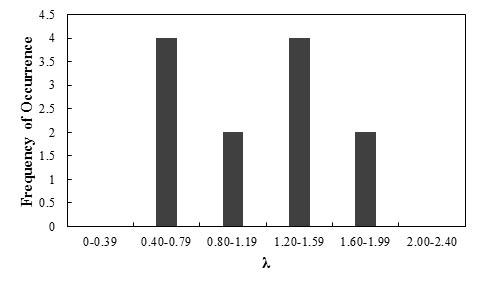
Figure 105. Graph. Frequency of occurrence histogram of λ for the lateral displacement of GRS walls and abutments using the Adams method
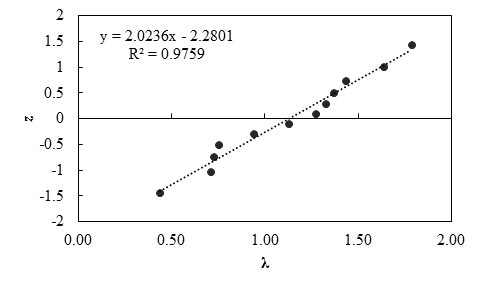
Figure 106. Graph. Probability plot for measured and predicted lateral displacement of GRS walls using the Adams method
Any interpretations of the results of this study should consider that the number of measured data points is statistically small. With this limitation, it was observed that the slightly higher-than-unity mean λ (1.13) indicates the Adams method is a slightly unconservative prediction method, and the predicted lateral displacement is on average 88 percent of the actually measured lateral deformation. The low COV value (0.36) indicates the method has good reliability.
Table 31 summarizes the statistical analyses of the six prediction methods for lateral displacement of GRS abutments and walls. The Adams method is the most accurate method for predicting the maximum lateral displacement of GRS walls and abutments with the mean λ the closest to unity and small COV. The Jewell-Milligan method is a conservative and relatively accurate method for predicting the lateral displacement of GRS walls and abutments with negligible facing rigidity. For predicting the displacement of GRS walls and abutments with CMU facing block, the CTI method may also be used, although it may overestimate lateral deformations by a factor of 1.69 with relatively low reliability.
| Statistical Parameters |
FHWA Method |
Geoservices Method |
CTI Method |
Jewell- Milligan Method |
Wu Method |
Adams Method |
|---|---|---|---|---|---|---|
| Mean λ | 0.12 | 1.38 | 0.59 | 0.74 | 0.24 | 1.13 |
| σ | 0.10 | 1.59 | 0.64 | 0.59 | 0.12 | 0.41 |
| COV | 0.38 | 1.15 | 1.08 | 0.80 | 0.50 | 0.36 |