U.S. Department of Transportation
Federal Highway Administration
1200 New Jersey Avenue, SE
Washington, DC 20590
202-366-4000
Federal Highway Administration Research and Technology
Coordinating, Developing, and Delivering Highway Transportation Innovations
| REPORT |
| This report is an archived publication and may contain dated technical, contact, and link information |
|
| Publication Number: FHWA-HRT-14-020 Date: January 2015 |
Publication Number: FHWA-HRT-14-020 Date: January 2015 |
The technical information sheets in this appendix describe traffic engineering treatments shown to affect speed or speeding-related crashes on rural or suburban roadways. They describe each treatment and, along with a photograph, show the deployment condition. Design and construction specifications, safety and operational effectiveness, and cost are also described for each treatment. For ease of reference the treatments are presented in the following order:
Source: FHWA
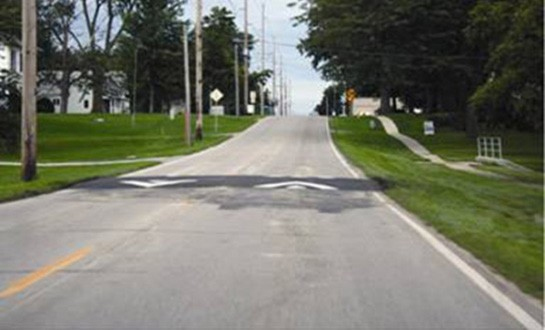
Figure 141. Photo. Speed table.(53)
Speed tables are midblock traffic calming devices that raise the entire wheelbase of a vehicle to reduce its traffic speed. Where applied, speed tables may be designed as raised midblock crossings, often in conjunction with curb extensions.(99)
Speed tables are longer than speed humps and flat-topped, with a typical height of 3 to 3.5 inches and a length of 22 ft. Vehicle operating speeds for streets with speed tables range from 25 to 45mph.(99)
No published safety evaluation for speed tables was identified.
Speed tables have been shown to reduce 85th percentile speeds by 4 mph (-14 percent) in small, rural towns and 9 mph (-24 percent) on rural, residential streets.(52,54)
The cost to construct a speed table ranges from $2,000 to $15,000.(100)
Source: City of Sparks Public Works: Traffic Division, Reno, NV
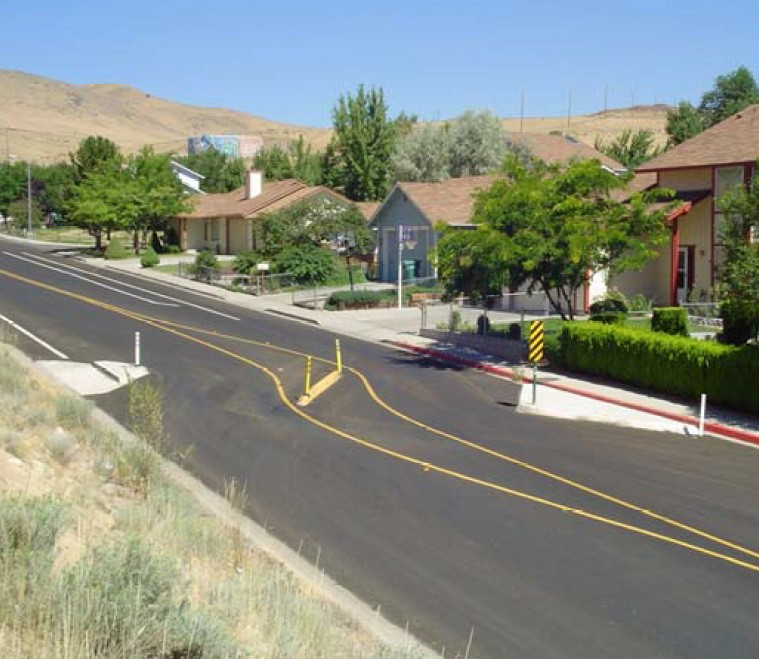
Figure 142. Photo. Lateral shift.(101)
A lateral shift is a curb extension that shifts travel lanes to one side of the road for an extended distance and then back to the other side.(102)
A lateral shift generally includes a center island with curbing, which prohibits vehicles from entering the opposing lane. They may also incorporate landscaping the in center island.(101) The curb can be constructed from different materials, such as concrete, granite, or asphalt, depending on the desired appearance.
No published safety evaluation for a lateral shift was found.
Lateral shifts from the installation of raised traffic islands have been shown to reduce 85th-percentile speeds by 11 mph (-25 percent).(102)
The cost to construct a lateral shift can vary significantly, which is mainly dependent on the type of material (i.e., concrete or granite), size of the offset, and the length of the transition.(101)
Source: Alfredo Garcia
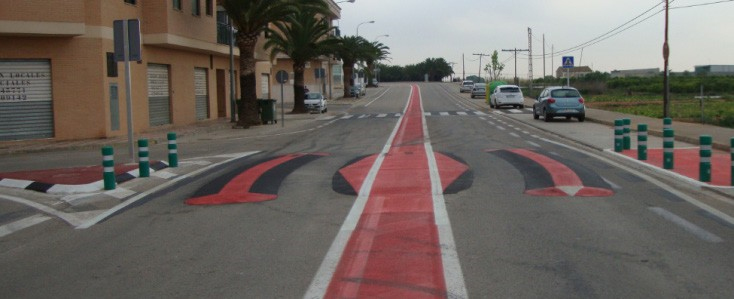
Figure 143. Photo. Speed kidney.(103)
A speed kidney is a longitudinal speed bump that takes the shape of a kidney that lowers vehicle speeds by forcing the driver to choose one of two slow vehicle paths.(103)
The design consists of a curved speed bump in the middle-right of the travel lane and is complemented by an oval speed bump with the centerline as the long axis. This design forces the driver to take one of two vehicle trajectories. One is to continue in a straight line, causing lower speeds through mounting the speed bump with either one or two wheels. The other is following the curved path to avoid mounting the bump. This curved path leads to lower speeds as well.(103)
No published safety evaluation for this treatment was found.
The safety kidney has been found to reduce 85th percentile speeds by 11.2 mph in urban and rural areas.(103)
Costs are similar to those of speed humps and speed tables and are between $2,000 and $15,000.(103,100)
Source: FHWA
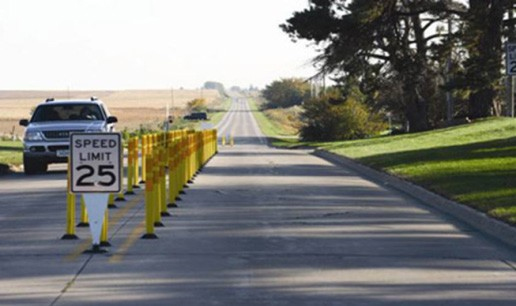
Figure 144. Photo. Tubular channelizers.(53)
Tubular channelizers are 3-ft tall yellow markers placed on either side of the centerline to create an island. These can reduce lane width.(53)
The 3-ft tall channelizers, mounted on either side of the centerline, are spaced at 4 ft within the tapers, while the rest of the markers are spaced at 8 ft. A speed limit sign can be mounted to indicate the desired speed for this portion of the roadway.(53)
No published safety evaluation for this treatment was found.
Channelizers have been shown to reduce 85th percentile speeds by 1 mph on main rural roads.(53)
The cost to construct tubular channelizers is estimated to be between $5,000 and $12,000. The reason for the high cost is that the tubes are often struck by vehicles and must be replaced.(53)
Source: FHWA
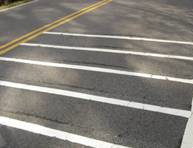
Figure 145. Photo. Transverse rumble strips.(104)
Transverse rumble strips are raised or grooved patterns installed perpendicular to the direction of travel on the roadway travel lane or shoulder pavements.(105) Typically installed on rural roadways that have low volume and infrequent traffic control devices, rumble strips provide an audible and tactile warning of a downstream decision point.(106) They are different than centerline and edge-line rumble strips, which are located off the travel lanes.
Designs for transverse rumble strips can vary greatly from site to site. Grooved rumble strips are typically 0.5 inches deep and 4 inches wide. Raised rumble strips typically range from 0.38 to 0.75 inches high and 4 inches wide.(107) They can either be placed as continuously or intermittently spaced sets of strips; spacing can vary based on operating speeds.(108)
Elvik and Vaa estimated the following CMFs for transverse rumble strips(109):
Transverse rumble strips are shown to reduce speeds between 0.6 and 2.0 mph on rural highways.(105,106)
The cost estimate to install transverse rumble strips ranged from $0.10 to $0.60 per linear ft. The cost varies based on the length of the project, whether the surface is concrete or asphalt, and if they are installed as a standalone project or part of a larger project.(110)
Source: FHWA
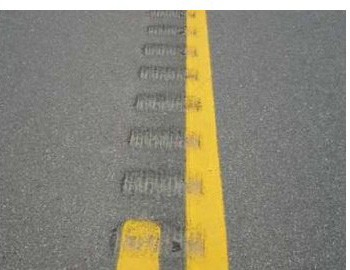
Figure 146. Photo. Longitudinal rumble strips.(111)
Longitudinal rumble strips are raised or grooved patterns on the inside edge of the normal travel lane. These rumble strips have the ability to narrow effective lane width.(111)
Longitudinal rumble strips can be placed on both the centerline and shoulder. Typical dimensions of rumble strips are 7 by 16 by ⅝ inches. The spacing is 12 inches center to center. The rumble strips should be milled, but can also be rolled in.(111)
Numerous safety studies prove the effectiveness of longitudinal rumble strips. Some studies have found that the treatment can reduce injury crashes by 14 percent, severe crashes by 18 percent, fatal and serious crashes by 67 percent, and overall crashes by 20 percent. (See references 112 through 115.)
Longitudinal rumble strips have been found to reduce 85th percentile speeds by 4.5 mph.(63)
The cost to install rumble strips ranges between $500 and $3,000 per mi).(111)
Converging Chevron Marking Pattern
This pattern is not MUTCD compliant and requires FHWA experimental permission.
Source: Iowa State University
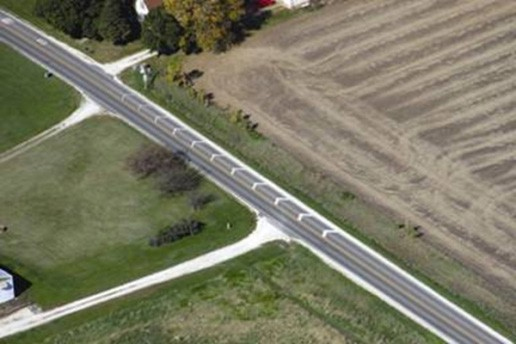
Figure 147. Photo. Converging chevron marking pattern.(52)
The converging chevron pavement marking pattern involves installing a series of white chevrons on the road surface. The spacing width of the chevrons and the space between them decreases as the driver travels through the pattern. This pattern creates the illusion that the vehicle is traveling faster than the vehicle’s actual speed and that the road is narrowing, which causes the driver to slow down.
Use the decreasing velocity linear equation shown in to determine spacing between each pair of bars:

Figure 148. Equation. Decreasing velocity linear equation
Where:
L = distance between successive pair of transverse bar pairs pair1 and pair2 (ft)
v1 = speed at pair 1 (ft/s) (speed at the first pair is the transition zone speed; speed at the last pair is the entrance posted speed limit)
v2 = speed at pair 2
tb = perception reaction time (0.5 s)
a = deceleration rate (ft/s2)
Converging chevron pavement markings were shown to reduce crashes by as much as 43percent.(116)
Studies of the effectiveness of converging chevron pavement marking patterns show the potential to reduce 85th percentile speeds by 11 to 24 percent.(116) An FHWA study reported a 3-mph reduction in 85th percentile speeds.(53)
The cost to implement chevron pavement markings can range between $100 and $200 per marking.(117) Maintenance of converging chevrons involves regular repainting of the markings to maintain visibility.(53)
Source: Virginia Center for Transportation Innovation and Research
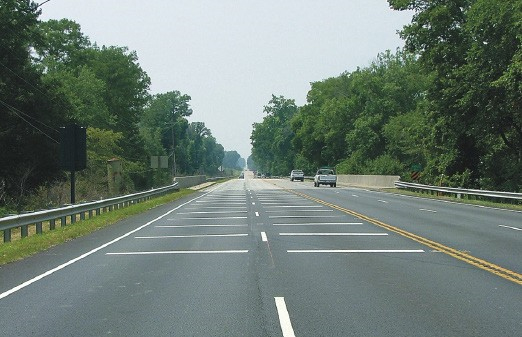
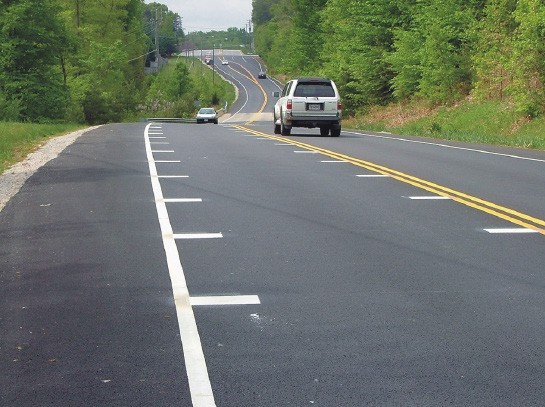
Figure 149. Photo. Transverse markings.(75)
Transverse markings are a series of white transverse bars―either flat or raised―placed across the center of the lane and spaced progressively closer together to create the illusion that driver speed is increasing.(118)
The design for transverse markings can vary from site to site. Meyer tested three different layouts of transverse markings.(119) One involved installing 20 bars of consistent width and spacing intended to warn drivers. The next layout had varied width and spacing to create the illusion of traveling faster. The third, for work zones, installed four sets of six bars.
Although there are estimates of CMFs for transverse markings on roundabout approaches, no high-quality safety evaluation of transverse markings was found.
Transverse marking have been shown to marginally reduce 85th percentile speeds, 0.2 mph (0.3) on rural, horizontal curves.(118) Their application on rural highways has shown a decrease in 85th percentile speeds by the following amounts:
The cost to construct or install transverse pavement marking varies based on the material (i.e., paint or thermoplastics), the number of transverse bars, and the width of each bar. Traffic paint can be as low as $0.10/ft, and the price of wet reflective tape can range between $1 and $2/ft.(121) Generally, the cost of a single installation will be less than $2,500.(53) The maintenance needed for transverse markings is regular painting of the markings to maintain visibility.(53)
Source: Virginia Center for Transportation Innovation and Research
Figure 150. Photo. Optical speed bars.(75)
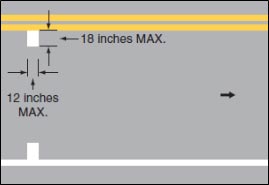
OSBs are transverse markings with progressively reduced spacing installed on the roadway within a lane in a pattern to give drivers the impression that their speed is increasing. OSB can be used on the whole roadway (transverse) or just on the edges (peripheral).
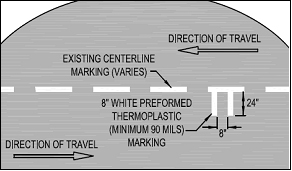
Peripheral optical bars, 12 by 18 inches in size, must be installed on both sides of the lane perpendicular to the centerline, edge line, or lane line. Peripheral optical bars cannot be used in lanes that do not have a longitudinal line (centerline, edge line, or lane line) on both sides of the lane (in accordance with 2009 MUTCD, Part 3B. 22).(122) The spacing of the bars decreases to maintain a 4-bar/s spacing. The length of the segment also needs to provide a minimum of 4 s of driving time within the OSBs.(104) Mohave County, AZ, used a variation of the MUTCD design . In this design, two 24- by 8-inch bars, spaced 8 inches apart, were placed perpendicular to the centerline.
Source: FHWA
Figure 151. Illustration. Peripheral Design (2009 MUTCD, Part 3B. 22).(122)
Source: Mohave County Public Works, Arizona
Figure 152. Illustration. Peripheral Design Variation, Mohave County, AZ.
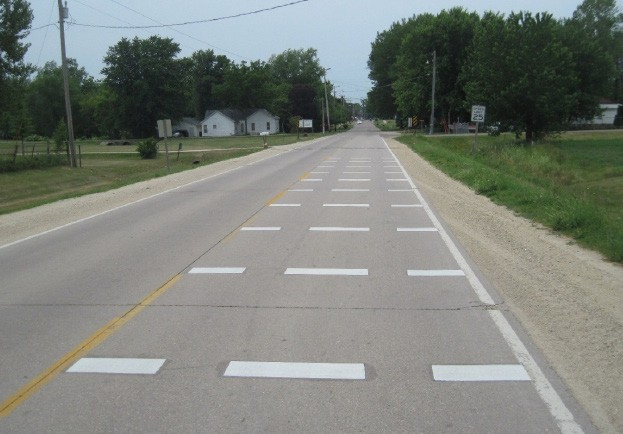
A variation to the typical transverse bars was used by Iowa.(123) This design consisted of three horizontal bars spaced at intervals so that drivers can position their vehicles within the wheel paths.
Spacing between each pair of bars is determined using a decreasing velocity linear equation.(76)
Source: Iowa State University
Figure 153. Photo. OSB Variation, Iowa State University.(124)
No published safety evaluation for OSBs was found.
Peripheral Speed Bars have been shown to reduce 85th percentile speeds by the following amounts:
The cost to implement is approximately $8/ft2. The maintenance for transverse markings requires regular painting of the markings to maintain visibility.(53)
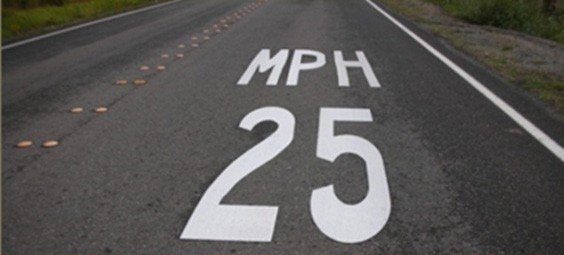
Source: Iowa State University
Figure 154. Photo. Speed limit pavement legend.(126)
A speed limit pavement legend places pavement markings at regularly spaced intervals to remind drivers of the speed limit. The speed limit pavement legend can be placed as a standalone treatment, at the end of converging chevrons, or in combination with lane-narrowing measures.(53)
No specific design details (i.e., width and height) were found for the speed limit pavement legend.
No published safety evaluation for speed limit pavement legends was found.
Studies indicate that speed limit pavement legends can reduce 85th percentile speeds by 1 mph (‑1 percent) on rural, main roadways.(53)
The cost to install speed limit pavement legends varies based on how often the legend is applied but generally is less than $2,500. The maintenance needed for speed limit pavement legends is regular repainting of the legend to maintain visibility.(53)
Enhanced Speed Limit Legend with Colored Surfacing
The colored outline is not MUTCD compliant and requires FHWA experimental permission.
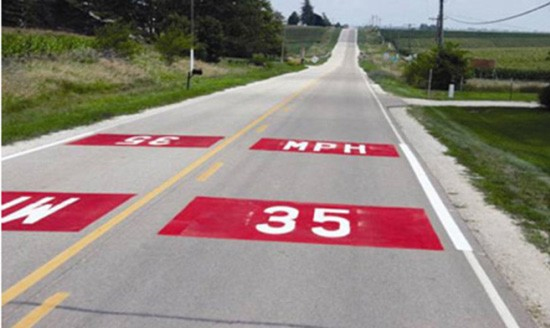
Source: Iowa State University
Figure 155. Photo. Enhanced speed limit legend with colored surfacing.(123)
An enhanced speed limit legend with colored surfacing involves the same treatment as the speed limit pavement legend, except the legend is surrounded by an additional colored box. The legends are spaced at regular intervals to remind drivers of the speed limit.(53)
The red-colored surface was used to evaluate the effectiveness of enhanced speed limit legends. A large red rectangle (9.5 by 12 ft) was placed around the on-pavement speed limit markings, which were 35 mph at the test sites. The edge line was also widened to 8 inches along the treatment to enhance visibility.(53)
No published safety evaluation for enhanced speed limit legends with colored surfacing was found.
Studies show that enhanced speed limit legends with colored surfacing can reduce 85th-percentile speeds by 2 mph (-4 percent) on rural, main roadways.(53)
The cost to enhanced speed limit legends with colored surfacing varies based on how often the legend is applied, but generally is less than $2,500. The maintenance required is regular repainting of the legend to maintain visibility; the red background has been shown to fade quickly, so there may need to be an accelerated repainting cycle.(53)
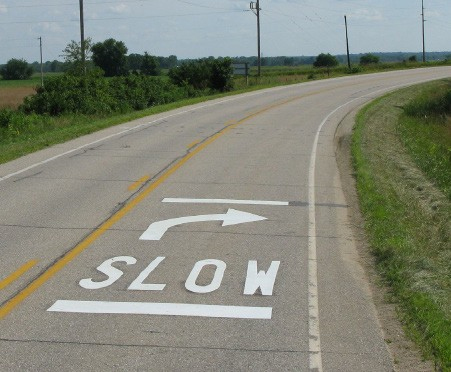
Source: Iowa State University
Figure 156. Photo. Slow pavement legend.(52)
A pavement marking legend is installed in the travel lane to indicate SLOW—the driver should reduce speed.
One study installed the SLOW pavement marking prior to a horizontal curve. The word SLOW was installed approximately 220 ft upstream of the PC of a horizontal curve. The marking consisted of the word SLOW in 8-ft-high white letters. There was also an 8-ft-high arrow installed above the word SLOW. In addition to these two markings, an 18-inch-wide white line was installed perpendicular to the road, at the beginning and end of the marking.(127)
No published safety evaluation for installing SLOW pavement legends was found.
SLOW pavement legends have been shown to increase 85th percentile speeds by 1 mph, but they have also been shown to decrease 85th percentile speeds by 2 mph.(53,129)
The cost to install a SLOW pavement legend is less than $2,500. The maintenance needed for the pavement legend is regular repainting to maintain visibility.(53)
Zigzag pavement markings are not included in MUTCD.
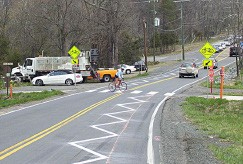
Source: Virginia Center for Transportation Innovation and Research
Figure 157. Photo. Zigzag pavement markings.(61)
A painted zigzag line in the center of the travel lane is used to indicate upcoming pedestrian crossings or horizontal curves.(61)
The zigzag extends 500 ft from the crosswalk or beginning of the curve. The width of the painted line should be larger than the centerline and edge lines, meaning 6 inches should suffice for 4‑inch edge and centerline markings. The lateral width of the zigzag is 4 ft, smaller than typical vehicle track widths to avoid paint wear from traffic. The length of one line in the zigzag is 12 ft. The zigzag should be painted white.(61)
No published safety evaluation for this treatment was found.
The zigzag markings have been found to reduce 85th percentile speeds by up to 1.3 mph in suburban areas.(61)
Initial costs for the pavement markings are estimated to be $2,850, including labor and materials. The total cost over 5 years should be expected to be $5,700, assuming reapplication of the lines in 2 to 3 years.(61)
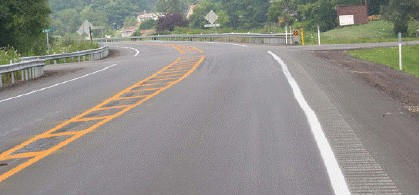
Source: FHWA
Figure 158. Photo. Painted medians.(128)
Typically used at intersections, painted medians are flush medians marked with painting that separate opposing traffic lanes.(122)
Widths of painted medians vary depending on available right-of-way. Markings consist of edge lines and cross hatching and should be implemented in accordance with Section 3B.03 of the MUTCD.(122)
This treatment has been found to reduce fatal crashes on rural and urban roads by 20 percent.(129)
No published speed evaluation for this treatment was found.
Costs are typically between $10,000 and $30,000 per intersection, but they can range as high as $70,000.(130)
Add Shoulder Markings to Narrow Lane
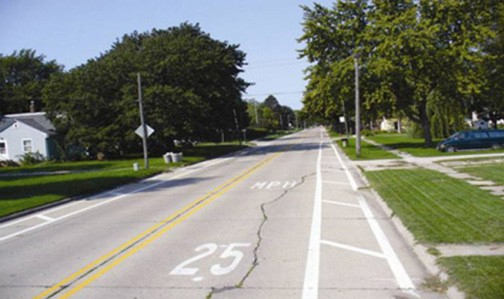
Source: FHWA
Figure 159. Photo. Add shoulder markings to narrow lane.(53)
Installing wide edge line and crosshatch markings creates a shoulder on both sides of the roadway to reduce lane widths.
In the study that evaluated this treatment, an existing two-lane roadway that was 36 ft wide from curb to curb was reduced to single 10.5-ft lanes in both directions. This was accomplished by using wide edge line and crosshatching. The study suggested that it may be more effective to reduce the lane width even more, or it may be necessary to install physical barriers because there are no consequences for crossing the pavement markings.(53)
No published safety evaluation for adding shoulder markings to narrow lanes was found.
Adding shoulder markings to narrow lanes has had minimal effects on 85th percentile speeds, with an increase of 0.5 mph.(53)
Traffic paint can be as low as $0.10/ft and the price of wet reflective tape can range between $1and $2/ft.(121) Generally, the cost will be less than $2,500.(53) The maintenance needed for shoulder markings is regular repainting of the markings to maintain visibility.(53)
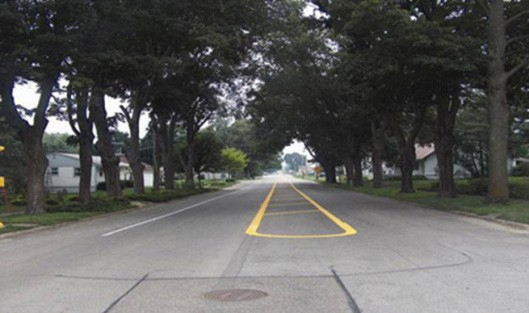
Source: FHWA
Figure 160. Photo. Add centerline and edge line.(53)
Installation of median and shoulder pavement markings reduces lane widths.
The pavement markings can vary from site to site, based on the characteristics of each site and the intended purpose. One study added a 10-ft-wide painted center island and added a 6-inch edge line to separate the travel lane from the 8-ft parking lane. The lane widths decreased from approximately 16 to 11 ft in each direction).(53)
Studies show that adding centerline and edge line pavement markings can reduce fatal and injury crashes by 8.6 percent.(48) There are many CMFs for different edge line and shoulder treatments. Installing edge lines on tangents and curves has the following CMFs:(131)
Adding a centerline and edge line have been shown to reduce 85th percentile speeds by the following amounts:
The cost to install centerline and edge line pavement markings can be as low as $0.10/ft for paint, but the price of wet reflective tape can range between $1 and $2/ft.(121) Generally, the cost will be less than $2,500.(53) The maintenance needed for shoulder markings is regular painting of the markings to maintain visibility.(53)
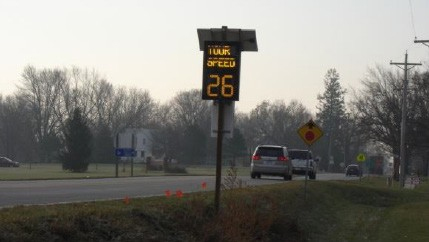
Source: Iowa State University
Figure 161. Photo. Speed feedback sign.(126)
A speed feedback sign is a dynamic sign that displays the speed of approaching vehicles.(53)
Speed feedback signs vary based on the site. Most signs display the text, YOUR SPEED along with the measured speed of the approaching vehicle.(53)
No published safety evaluation for speed feedback signs was found.
Studies indicate that speed feedback signs can reduce 85th percentile speeds by the following amounts:
The cost to install a speed feedback sign can range from $5,000 to $12,000.(53)
Source: Clemson University
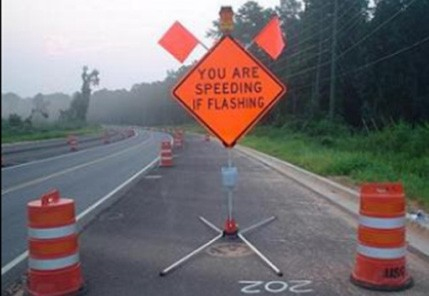
Figure 162. Photo. Speed-activated warning sign. (133)
A speed-activated warning sign consists of a fixed-message, speed-activated sign that triggers a flashing beacon when a predetermined speed threshold is exceeded. The speed-activated sign is a 4- by 4-ft corrugated plastic reflective sign with 6-inch lettering reading “YOU ARE SPEEDING IF FLASHING.” To increase the speed-activated sign’s visibility, two 1- by 1-ft orange plastic flags were added.
The design of speed-activated warning signs can vary from one site to another, depending on the intended purpose of the sign. The sign shown above and the one used by Mattox et al. was a
4- by 4-ft corrugated plastic reflective sign with 6-in lettering reading YOU ARE SPEEDING IF FLASHING.(131) A beacon atop the sign flashes when a vehicle exceeds a certain threshold.(133) This is a temporary sign; however, there are also permanent speed-activated signs.
No published safety evaluation for speed-activated warning signs was found.
Speed-activated warning signs are shown to reduce 85th percentile speeds by the following amounts:
The cost to install the sign used by Mattox et al. was approximately $1,500.(133) Other, more permanent installations can cost between $5,000 and $12,000.(53)
Speed-Activated Speed Limit Reminder Sign
Source: SWARCO Traffic Ltd
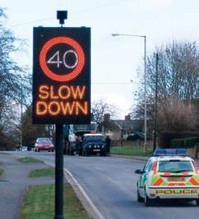
Figure 163. Photo. Speed-activated speed limit reminder sign.
A speed-activated-speed limit reminder sign is an electronic speed-limit sign activated by an approaching vehicle.
The vehicle-actuated fiber-optic 30-mph sign was installed 624 meters (680 yd) prior to a 20‑mph zone.(136)
No published safety evaluation for speed-activated speed limit reminder signs was found.
Studies show that speed-activated speed limit reminder signs can reduce 85th percentile speeds by 5 mph on major roads.(136)
The cost to install a speed-activated speed limit reminder sign is comparable to other electronic signs with radar, which can range between $2,000 and $12,000.(53)
Source: FHWA
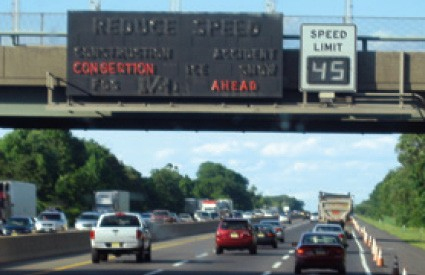
Figure 164. Photo. Variable speed limit sign.(137)
A variable speed limit sign is an electronic message sign that displays dynamic information related to the speed limit. These signs can indicate a reduced speed limit during wet or low-light weather conditions, which may improve safety by decreasing the risks associated with vehicles traveling at speeds higher than appropriate for the conditions.(137)
Variable speed limit signs can be used in place of static speed limit signs placed to the right of the shoulder, or they can be mounted over the individual lanes of a multilane highway and individual lanes can have varying speed limits. A variable speed limit for wet conditions is justified when adverse weather conditions cause traffic problems, when there is a higher crash rate than expected for similar segments, the regular occurring safe speed limit is at least 10 mph less than the normal speed limit, or there are conditions when stopping distance exceeds available sight distance.
The following CMF for variable speed limit signs has been estimated:
Variable speed limit signs have been shown to reduce 85th percentile speeds by the following amounts:
The cost to install a single variable speed limit sign is between $5,000 and $12,000, similar to speed feedback signs.(53) The cost to install variable speed limits on a multilane highway is significantly higher than the cost of the overhead structure.
Transverse Pavement Markings with Speed Feedback Sign
Source: FHWA
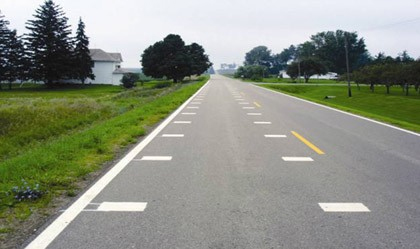
Figure 165. Photo. Transverse pavement markings with speed feedback sign.(53)
Transverse pavement markings are placed at the entrance to a community. Speed feedback signs were placed immediately downstream of the transverse pavement markings.(53)
The markings are 12 inches wide by 18 inches long (perpendicular to roadway edge). Spacing between the bars decreases approaching the neighborhood, which can cause the driver to slow down because the visual sense is one of speeding up. A static speed feedback sign is placed at the end of the markings. These signs display YOUR SPEED and show the current vehicle speed.(53)
No published safety evaluation for this treatment was found.
This combination of treatments has been found to reduce 85th percentile speeds by 4 mph.(53)
The cost of this treatment is estimated to range between $5,000 and $12,000, with regular painting being the most significant maintenance concern.(53)
Source: FHWA
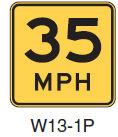
Figure 166. Photo. Advisory speed limit sign.(122)
This treatment entails installing a static yellow advisory speed limit sign to provide drivers with advisory speeds for less than ideal roadway conditions.(122)
Use the sign as a supplement to another advisory sign, such as for a turn or horizontal curve. Size is typically either 18 by18 inches or 24 by 24 inches. Install the sign following the guidelines set forth for the advisory speed limit sign (W13-1P) and the follo wing signs: W13-2, W13-3, W13-6, and W13-7, in the MUTCD.(122)
Published CMFs indicate that advisory speed limit signs installed in combination with horizontal alignment warning signs can affect safety as follows(109):
Installing an advisory speed limit sign has been found to reduce 85th percentile speeds by 15percent.(142)
A 30-inch advisory speed limit sign with engineer-grade reflective sheeting costs approximately $50.(143)
Colored border is not MUTCD compliant and requires FHWA experimental permission.
Source: Texas Transportation Institute
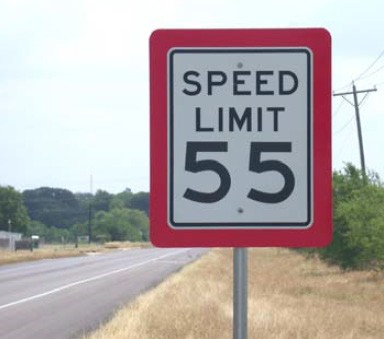
Figure 167. Photo. Red border speed limit sign.(144)
A red border speed limit sign is a standard speed limit sign with an added red border. The red border is designed to increase the visibility of the sign, and drivers may recognize an increased sense of importance because of the enhanced red border.(59)
Two different red border signs have been used. The first is a standard speed limit sign (R2-1) that adds 6 inches to the height and width that allows for a 3-inch red border to be added around the existing speed limit sign. The second red border sign removed the black border from the standard speed limit sign and replaced it with a 1-inch red border along with the 3-inch border from the first red border sign. This sign had a 4-inch red border.(58)
No published safety evaluation for installing red border speed limit signs was found.
Red border speed limit signs have been shown to reduce 85th percentile speeds by 3 mph on two-lane highways.
The cost to install a red border speed limit sign is similar to a standard speed limit sign plus the cost to modify the sign.
One-Direction Large Arrow (W1-6) Sign
Source: KLS Engineering, LLC
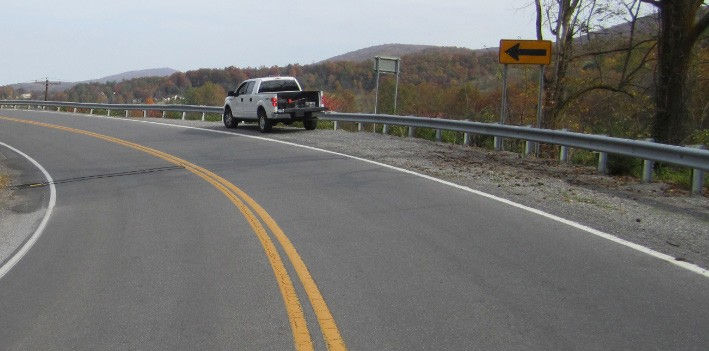
Figure 168. Photo. One-direction large arrow (W1-6) sign.
A one-direction large arrow sign (W1-6) is placed on a horizontal curve to alert drivers that they are approaching a horizontal curve and its direction.
A one-direction large arrow sign (W1-6) is designed in accordance with the MUTCD. For a single lane or multilane road, a W1-6 sign is 48 by 24 inches. On an expressway or freeway, a W1-6 sign is 60 by 30 inches. A one-direction large arrow sign is placed on the outside of a curve at a right angle to oncoming traffic. As with any warning sign, a W1-6 sign has a yellow background with a black arrow.(122)
No published safety evaluation for installing a one-direction large arrow was found.
One-direction large arrows have been shown to have no effect (0 mph speed reduction) on 85th percentile speeds of vehicles on rural, horizontal curves.(118)
The cost to install a one-direction large arrow sign is less than $500.(145)
Add Flashers to Existing Curve Warning Sign
Source: KLS Engineering, LLC
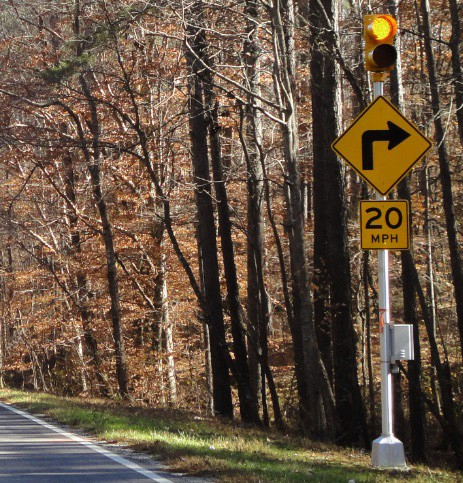
Figure 169. Photo. Add flashers to existing curve warning sign.
Six-inch flashing amber lights are added to an existing curve warning sign.(118)
Two flashing amber lights are added to an existing curve warning sign.
No published safety evaluation for adding flashers to an existing curve warning signs was found.
Adding flashers to an existing curve warning sign has been shown to increase 85th percentile speeds by 1 mph.(118)
The cost to add flashing lights to an existing sign is less than $500.(145)
Add Flags to Existing Curve Warning Sign
Source: University of Kentucky
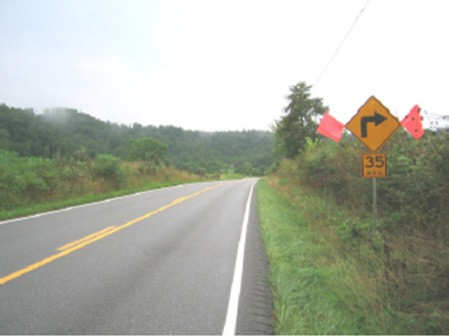
Figure 170. Photo. Curve warning sign with flags.(118)
Red flags are added to an existing curve warning sign to attract driver attention.
Two red flags are added to an existing curve warning sign.
No published safety evaluation for adding flags to an existing curve warning signs was found.
Adding flags to an existing curve warning sign has been shown to reduce 85th percentile speeds by 0.3 mph.(118)
The cost to add flags to an existing sign is less than $500.
Combination Horizontal Alignment/Advisory Sign
Source: FHWA
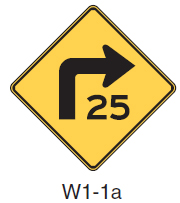
Figure 171. Photo. Combination horizontal alignment/advisory sign.(122)
A sign containing both a curve or turn ahead and advisory speed is installed prior to a horizontal curve.
A combination Turn/Advisory Speed (W1-1a) and a combination Curve/Advisory Speed (W1-2a) are designed in accordance with the MUTCD. These signs can used to supplement the advanced horizontal alignment warning sign and advisory speed plaque, but they should not be used alone or used as a substitute for a horizontal alignment warning sign and advisory speed plaque. Install the W1-1a and W1-2a sign at the beginning (PC) of the turn or curve, if installed. For a single lane or multilane road, W1-1a and W1-2a signs are 36 by 36 inches. On an expressway or freeway, W1-1a and W1-2a signs are 48 by 48 inches. As with any warning sign, W1-1a and W1-2a signs have a yellow background and black arrows/text.(122)
The following CMFs for combination Turn/Advisory Speed and combination Curve/Advisory Speed signs have been estimated:(109)
Speed Reduction Effectiveness:
Installing a combination Turn/Advisory Speed or combination Curve/Advisory Speed sign has been shown to increase 85th percentile speeds by 0.2 mph.(146)
The cost to install a combination Turn/Advisory Speed or combination Curve/Advisory Speed sign is less than $500.(145)
Source: Iowa State University
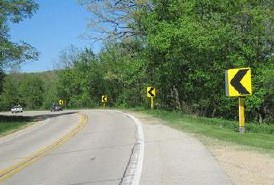
Figure 172. Photo. Chevron sign.(52)
Installing chevron alignment signs (W1-8) on a horizontal curve provides additional guidance and emphasis for a change in horizontal alignment.
Install chevron alignment signs in accordance with the MUTCD. For a single lane or multilane road, a W1-8 sign is 18 by 24 inches. On an expressway, a W1-8 sign is 30 by 36 inches. On an expressway, a W1-8 sign is 36 by 48 inches. Install chevron alignment signs at a minimum height of 4 ft. The spacing of the signs depends on the curve radius and is guided by Table 2C-6 in the MUTCD. As with any warning sign, a W1-8 sign has a yellow background with a black arrow.(122)
The following CMFs for chevrons have been estimated (all four-star):(147)
Chevron alignment signs have been shown to reduce 85th percentile speeds on rural horizontal curves by the following amounts:
The cost to install a chevron alignment sign is less than $500.(145)
Curve Warning Sign and Chevron Sign and Flashing Beacons
Source: Michigan Department of Transportation
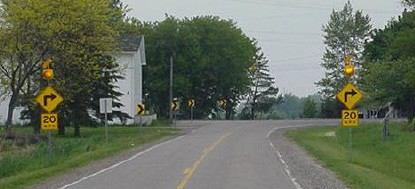
Figure 173. Curve warning sign and chevron sign and flashing beacons.
Curve warnings signs are placed on the approach to a horizontal curve. These are supplemented with flashing beacons to attract the driver’s attention and chevrons to delineate the curve.(104)
Refer to MUTCD guidelines for Curve Warning Signs (W1-1, W1-2) and Chevron Alignment Signs (W1-8). Also refer to MUTCD, Chapter 4L, for proper use of flashing warning beacons.(104,122)
There are many safety benefits of this signage combination, including numerous crash modification factors. Some published CMFs indicate a reduction of 40 percent in all types of crashes on rural roads. The treatment was also found to reduce all types of crashes under wet conditions by 47 percent.(150)
No published speed evaluation for this treatment was found.
Costs for this treatment vary depending on the number of chevron signs (W1-8) installed― 10chevron signs typically cost $500. The cost of the curve warning sign (W1-2) can vary based on size and quality but should not exceed $500. A solar-powered yellow beacon should cost about $2,200, more if solar power is not used.(104,117)
Curve Warning Sign and Chevron Sign
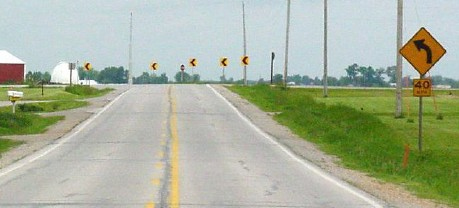
Source: Tom Welch
Figure 174. Photo. Curve warning sign and chevron sign.
Curve warnings signs are placed on the approach to a horizontal curve. These are supplemented with chevrons placed along the curve.(104)
Refer to 2009 MUTCD Section 2C.10 for Curve Warning Signs (W1-1, W1-2) and Chevron Alignment Signs (W1-8) guidelines.
There are many safety benefits of this signage combination. In general, this treatment has a CMF of 0.60, indicating a 40-percent reduction in all crashes on rural roads. This combination of signage can also reduce nighttime crashes on rural horizontal curves by 40.8 percent (CMF = 0.592).(150)
No published speed evaluation for this treatment was found.
Costs for this treatment vary depending on the number of chevron signs (W1-8) installed. Ten chevron signs typically cost $500. The curve warning sign (W1-1, W1-2) can vary based on size and quality. In total, the cost (including the chevrons) should be less than $1,000.(104,117)
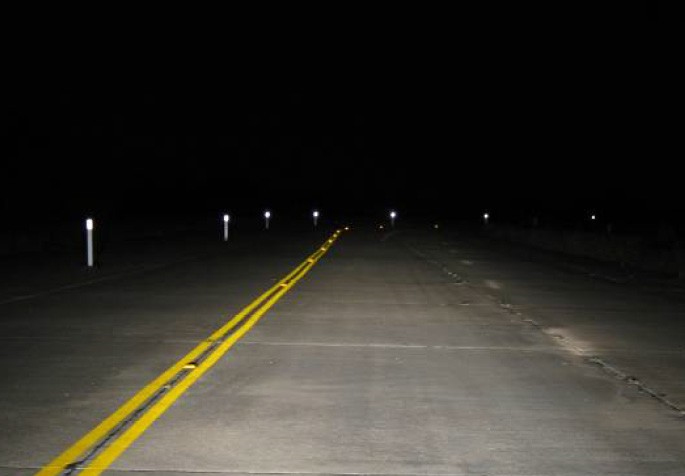
Source: Texas Transportation Institute
Figure 175. Photo. Delineator post.(151)
Delineator posts are retroreflective devices mounted above the roadway surface and along the side of the roadway in a series to emphasis the roadway alignment and guide drivers. They provide the benefit that they remain visible when the road is wet.(122)
The retroreflective element of a delineator has a minimum 3-inch height. On mainline tangent sections, the distance between delineators should be between 200 and 530 ft. The distance between delineators on horizontal curves is determined by the radius of the curve, which Table 3F-1 in the MUTCD shows. Delineators are typically placed between 2 and 8 ft beyond the shoulder edge.(122)
The following CMFs are estimated for delineator posts:(109)
There are also reports of a 30-percent reduction in crash after installing delineator posts.(38)
Delineator posts have been shown to slightly increase 85th percentile speeds by 0.5 mph on rural, horizontal curves.(118) They have also been shown to reduce 85th percentile speeds by 7percent.(142)
The cost to install a delineator post is approximately $30−$50 per delineator.(145)
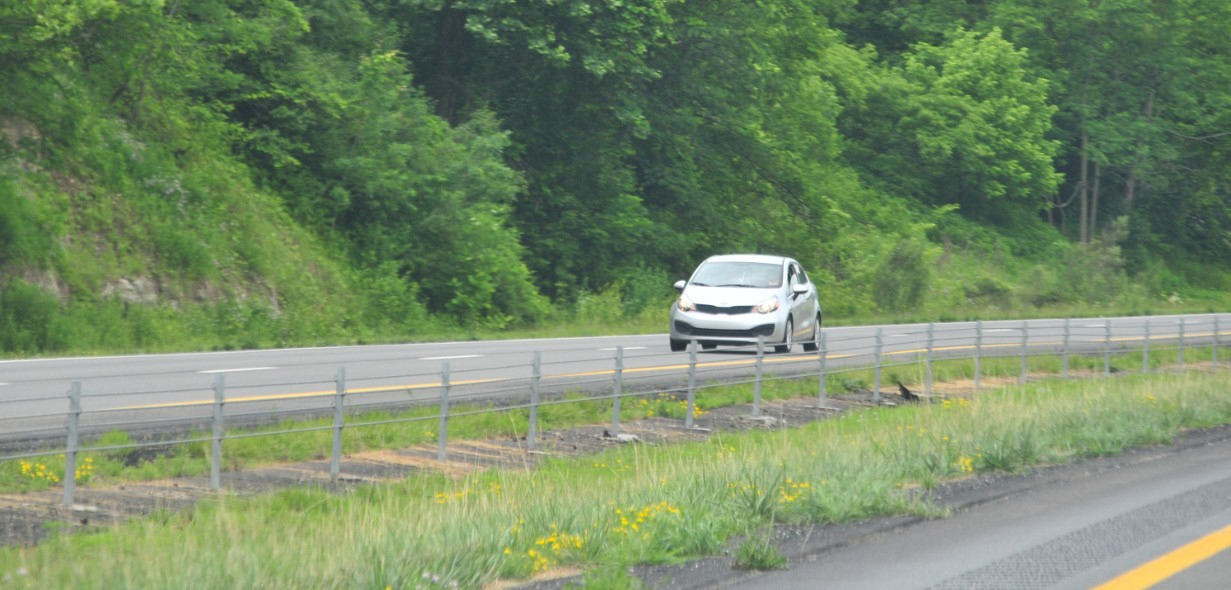
Source: KLS Engineering, LLC
Figure 176. Photo. Median barriers.
A median barrier is a physical barrier used to separate opposing traffic.(152)
Many types of barriers can be used in this setting, including tubular channelizers, cable barriers, guiderail, and concrete barriers. These barriers are placed along the centerline of the roadway to separate traffic. Refer to AASHTO roadside design guidance for complete specific design details.(153)
Median barriers have been found to reduce fatal crashes by 50 percent in both urban and rural settings.(152) There are numerous CMFs regarding median barriers that depend on the type of barrier used. In general, simply adding a median barrier reduces fatal crashes on rural roadways by 43 percent (CMF = 0.57) and injury crashes by 30percent (CMF = 0.70).(109)
No published speed evaluation for this treatment has been found.
Costs vary based on barrier used. Typical costs range from $50,000 to $300,000 for cable barriers, $83,000 to $600,000 for guardrail, and $120,000 to $2.7 million for concrete barriers.(153)
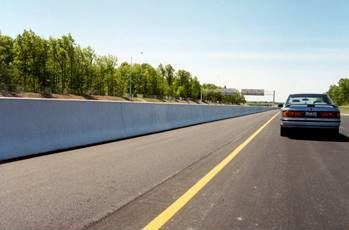
Source: KLS Engineering, LLC
Figure 177. Photo. Roadside barriers.
Roadside barriers are placed along the side of the road to safely redirect vehicles from roadside hazards.(154)
Multiple types of roadside barriers can be used. These include flexible barriers such as cable barriers, semi-rigid barriers such as guardrail, and rigid barriers such as concrete barriers. Design should conform to AASHTO design guidance.(28)
This treatment is found to reduce crashes by 40 percent in both urban and rural areas.(155) The following CMFs related to roadside barriers have been published:(109)
No published speed evaluation for this treatment was found.
Costs vary based on barrier used. Typical costs range from $50,000 to $300,000 for cable barriers, $83,000 to $600,000 for guardrail, and $120,000 to $2.7 million for concrete barriers.(153)
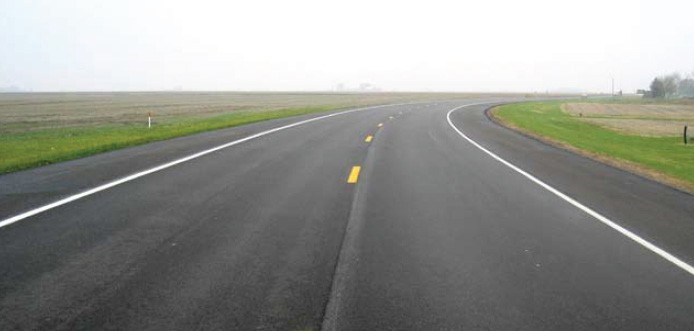
Source: FHWA
Figure 178. Photo. Lane widening.(48)
Lane widening, as indicated, increased the width of a travel lane.
Lanes can be widened by adding paved width to the cross section.
The safety effectiveness of lane widening is based on original and new lane width. Research shows that in urban and rural environments, increases in lane width from 9 to 10 ft result in a 13-percent reduction in crashes. A change from 10 to 11 ft results in a 19-percent reduction in crashes. Finally, an increase from 11 to 12 ft only results in a 5-percent reduction.(129) Published CMFs exist but are not listed here because they are contingent on original and modified lane width.
No published speed evaluation for this treatment was found.
Costs vary significantly based on right-of-way acquisition, pavement design, etc. Refer to the local transportation agency for more accurate cost estimation for road construction and modification in the area.
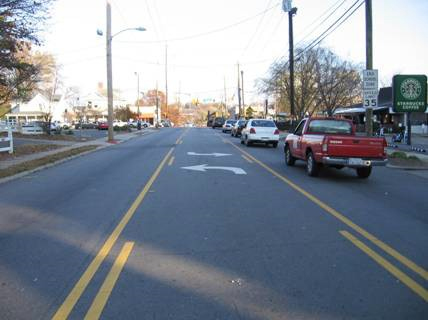
Source: FHWA
Figure 179. Photo. Two-way left-turn lane.(156)
A TWLTL is a wide, painted center turning lane that also functions as a median.(156)
A TWLTL ranges between 10 and 16 ft wide. The edges are marked by a solid yellow line on the side of traffic and a broken yellow line on the inside. Opposing left-turn arrows are also painted at regular intervals along the length of the lane.(28)
TWLTLs have been found to reduce crashes on rural two-lane roads by 29 percent.(156) The following are estimated CMFs for TWLTL:(157)
TWLTLs have been found to reduce 85th percentile speeds by 12.6 km/h (7.8 mph) on rural and suburban roads.(71)
Costs vary depending on State, with Arkansas, North Carolina, and California finding costs between $425,000 and $500,000 per mi to build, while the cost in Illinois was $1.78 million per mi. Maintenance costs are negligible compared with these prices.(156)
Additional Lane (or Road Duplication)
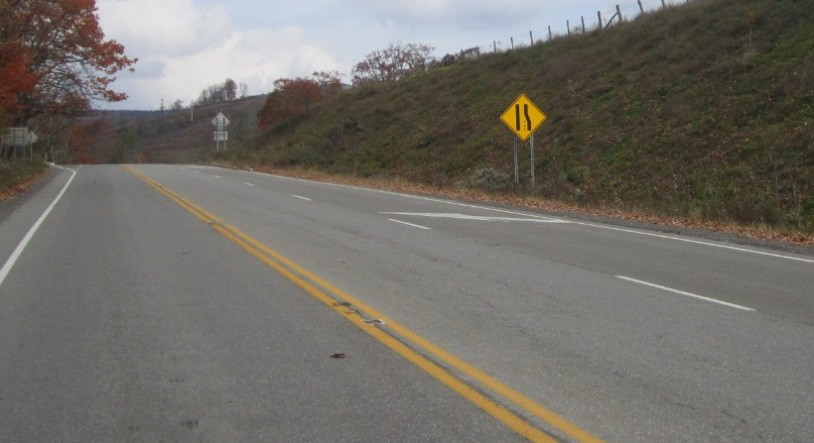
Source: KLS Engineering, LLC
Figure 180. Photo. Additional lane.
Adding an extra lane in one (or both) directions to provide an opportunity for fast-moving vehicles to pass slower moving ones. These can be classified as climbing lanes or passing lanes.(28)
The additional travel lane should have the same characteristics of the existing travel lanes. If the intended function of the travel lane is as a truck climbing lane, the design should be based on guidelines in the AASHTO Green Book. Similarly, the Green Book can provide guidance if the lane’s intended function is as a passing lane.(28)
This treatment has been found to reduce crashes on rural roads by between 25 and 50percent.(152,129)
No published speed evaluation for this treatment was found.
Costs vary significantly based on right-of-way acquisition, pavement design, etc. Refer to the local transportation agency for accurate cost estimation for road construction in the area.
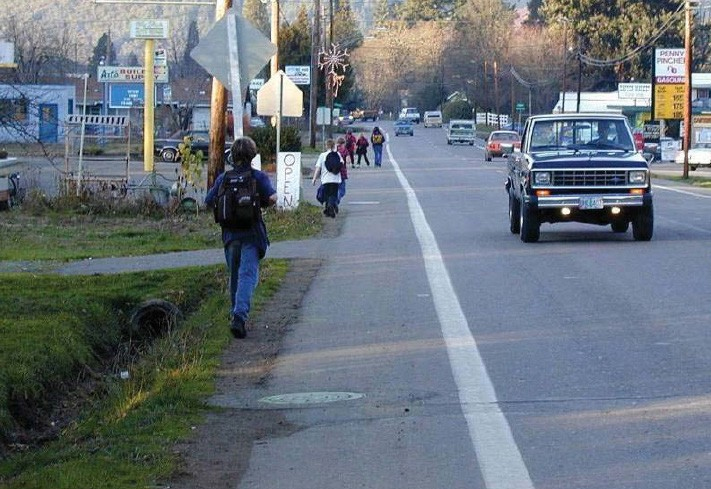
Source: FHWA
Figure 181. Photo. Paving shoulder.(158)
The addition of a paved shoulder provides a paved surface for an errant vehicle to recover and return to the roadway.(155)
The preferred width of a paved shoulder is between 6 and 8 ft at a slope steeper than the travel lane. For example, if a travel lane has a 2-percent cross slope, then the shoulder should be at least 4 percent. Delineate the shoulder with a painted edge line.(28)
A paved shoulder has been found to reduce crashes on urban and rural roadways by 30percent.(155) Published CMFs exist for this treatment. These factors vary based on the previous shoulder before paving and the dimensions of the new shoulder.
No published speed evaluation for this treatment was found.
The cost to construct a paved shoulder ranges from $18.47/yd2 to $111.19/yd2. This price range is so diverse because the cost is based on materials used and pavement depth.(159)
Source: KLS Engineering, LLC
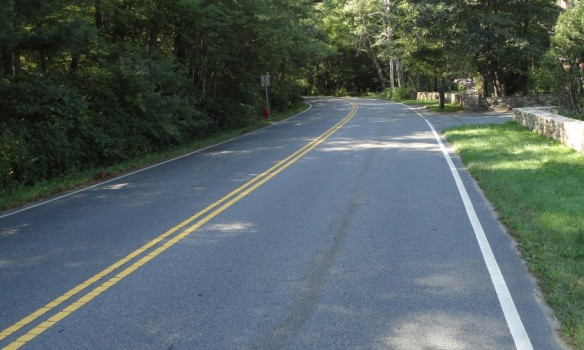
Figure 182. Photo. Road surface.
Road surface upgrades are pavement resurfacing projects, mainly performed to support the structural strength of the roadway.(160)
Designs for roadway resurfacing projects are context sensitive. Depth and material should be based on traffic loading, environment, local and state agency guidelines, etc. Refer to the local transportation agency for specific pavement resurfacing guidelines.
Multiple studies have quantified the safety effect of roadway surface upgrades. One study found the surface upgrades can reduce crashes by 35 percent on urban and rural roads.(155) Another study has found a 33-percent reduction in crashes on rural roads.(160)
No published speed evaluations for this treatment have been found.
Costs for roadway surface upgrades are extremely variable. The cost is based on depth of resurfacing, material, whether or not the old surface is to be milled, etc.
Source: Iowa State University
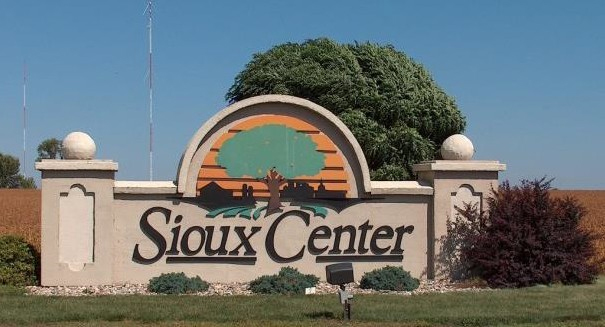
Figure 183. Photo. Gateway treatment.
Gateway treatments are a combination of signage and aesthetics that convey entrance to a community.(126,53)
Common tools used in gateway treatments include welcome signs, textured pavements, and pavement markings. Most are placed on the roadside, but some can span over the roadway.(126,53)
Published CMFs indicate a 2-percent reduction in crashes (CMF = 0.98) resulting from gateway treatments.(161)
Gateway treatments have been shown to reduce 85th percentile speeds by 2 mph.(53)
The cost to construct a gateway treatment can vary greatly, depending on the design of the sign. For example, an intricate gateway treatment may cost almost $10,000, including labor and materials.(55)