Implementation of Electronic Right-of-Way Management Systems Versus Paper Systems
3 Key Findings
An initial literature review of various agencies' practices revealed that the level of automation and the use of systems varies widely from largely paper-based systems to systems in which both internal and external users can access and show information on a map. The age of systems also varies significantly between agencies. In most cases, agencies with older systems are considering upgrading their systems. The technologies used for the systems also vary from in‑house systems to commercially available systems. Agencies generally do not have a well-documented feasibility analysis and have not documented actual benefits. Costs for some of the implementations are easily available, but most were not available through the review of existing literature.
Agencies tend to move from paper-based systems to stand-alone tools or ad-hoc solutions and then later to a web-based system. One of the focus areas is converting existing paper-based right-of-way plans to electronic plans and storing them in a robust document management system. Such systems allow for easy access to plans that can otherwise be difficult to catalog, maintain, and retrieve-while occupying a lot of space. Another area of recent focus is integrating available data with GIS information, thus providing the capabilities to view information on a map. This allows agencies to view surrounding properties and make more informed right-of-way decisions.
The research team sent an initial survey to 114 individuals across 62 agencies-which included 50 state DOTs and 12 LPAs-that was designed to identify agencies that are either using electronic right-of-way management systems or paper-based systems on a daily basis. The team received responses from a total of 29 individuals spanning across 24 agencies. Twenty one of the responses were received from state DOTs while the other three were from LPAs. These agencies were as follows:
- Alaska DOT&PF
- Alabama DOT
- Arkansas State Highway and Transportation Department
- Arizona DOT
- Colorado DOT
- Dallas County (TX) Public Works
- Idaho Transportation Department
- Kentucky Transportation Cabinet
- Maricopa County (AZ) Public Works
- Maryland SHA
- Minnesota DOT
- Mississippi DOT
- Nevada DOT
- New Jersey DOT
- North Dakota DOT
- Ohio DOT
- Oklahoma DOT
- Oregon DOT
- Pennsylvania DOT
- Polk County (FL)
- South Dakota DOT
- South Carolina DOT
- Tennessee DOT
- West Virginia DOT
A copy of the initial agency questionnaire is included in Appendix A.
Type of System Used
Exhibit 1 summarizes the 29 individual survey responses on the types of systems used by agencies. As indicated by the responses, a majority of the agencies use a hybrid - a combination of electronic and paper-based system.
Exhibit 1: Type of System
Type of System |
# of Respondents[1] |
Paper-Based |
7 |
Electronic |
3 |
Hybrid |
19 |
Length of Time Current Agency System Has Been Implemented
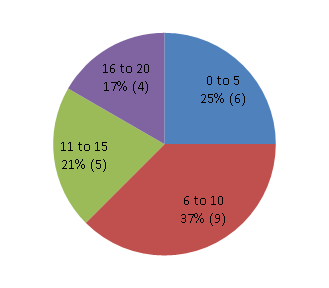
Exhibit 2 presents how long the systems have been in place at the 24 various agencies. As indicated in the responses, a quarter of the agencies indicated that a new system has been implemented in the last 5 years. On the other hand, 38 percent of the agencies indicated that the system in use is over 10 years old.
Exhibit 2: Length of Time Current Agency System Has Been Implemented (in Years)
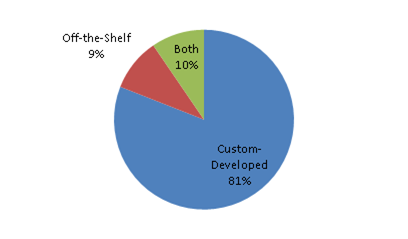
Most agencies using an electronic or hybrid system responded that the system in use is custom-developed versus based on a COTS solution as shown in Exhibit 3.
Exhibit 3: System Development Approach for Electronic Systems, Custom vs. COTS[2]
Business Functions
A key portion of the survey focused on the business functions supported by the right-of-way information management system. Exhibit 4 identifies the top five business functions supported by an integrated right-of-way information management system.
Exhibit 4: Business Functions Supported by Electronic/Hybrid Right-of-way Management System
Response |
Percent[3] |
Appraisal |
73% |
Negotiation |
68% |
Acquisition |
64% |
Relocation |
64% |
Property Management |
64% |
In addition to the five business functions identified above, survey respondents also indicated that the following business functions were supported by the electronic systems in use at one or more agencies:
- Comparable sales
- Contract management
- Demolition
- Eminent domain
- Environmental services
- Excess land and demolition
- Aspects of financial management
- Permitting
- Rail
- Right-of-way mapping/surveying
- Title abstracts
- Utility relocation
In addition, two-thirds of respondents reported that their right-of-way information management system was integrated with at least one other system, including geographic information system (44 percent), document management system (63 percent), and financial management system (63 percent).
Only six agencies (five state DOTs and one LPA) reported concrete data related to the cost of implementation and only four agencies (all state DOTs) reported concrete data on the annual cost to maintain their electronic system. The implementation costs ranged from $26,000 to $6.5 million, while annual maintenance costs varied between $60,000 and $150,000.
It is important to note that many agencies had difficulty reporting these types of numbers, as cost data either has not been documented or is not readily available.
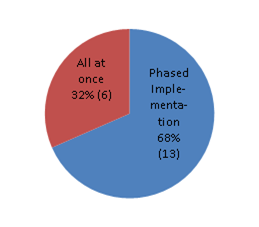
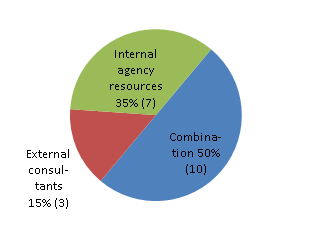
Most agencies used a phased implementation approach, meaning the electronic system was implemented over a longer period of time and across several phases. This allowed for easier integration of the new system into the current workflow and resulted in better adoption by the end-user. Fifty percent of agencies used a combination of internal resources and external consultants to implement the new system, as illustrated in Exhibit 5.
Exhibit 5: Implementation Approach for Electronic Right-of-way Systems
Phased vs. All at Once*
Internal vs. External*
The survey also looked at two important components related to implementation-both the challenges faced and benefits realized by the agencies. Exhibit 6 outlines typical implementation challenges. Exhibit 7 summarizes the expected benefits of the system implementation identified by the survey respondents. A comprehensive list of implementation challenges and key benefits can be found in the Key Benefits, Challenges, and Lessons Learned section below.
Exhibit 6: Implementation Challenges When Implementing a Right-of-way System
Response |
Percent[4] |
Difficulties with data conversion from the existing automated or manual systems |
76% |
Obtaining a sufficient level of end-user involvement |
59% |
Change management and overcoming resistance throughout the agency |
47% |
Balancing resources (i.e., time, money, and IT support) to be able to improve system |
41% |
Ensuring adequate technical and end-user support |
24% |
Ensuring appropriate executive sponsorship and support |
12% |
Exhibit 7: Anticipated Benefits from Implementation of a Right-of-way System
Response |
Percent[5] |
Decrease in data entry and access redundancy |
89% |
Improved documentation and consistent/standardized reporting |
78% |
Decrease in time it takes to perform tasks |
78% |
More efficient utilization of current staff or reduction in staffing |
78% |
Improved oversight |
67% |
Increased access to information both internally within agency and by the public |
56% |
Improved customer service and public relations |
33% |
Use of Paper-based Systems
The seven agencies that do not use an electronic or hybrid system were asked to provide information on why they are using a paper system instead of some form of an electronic system. Some of the key responses included:
- One agency has been working on acquiring a new system since at least 2005, but funding constraints have limited implementation
- Current system meets the agency's needs
- Agency is slow to adapt to new technologies
- Limited resources available from agency information technology department
- Requirement for original signature on documents
- Cost to acquire and implement software versus demonstrated business needs
Based on the web-based survey responses, the research team used the following selection criteria to select nine agencies to conduct follow-up interviews with, which included:
- At least one local public agency using electronic and one local public agency using a paper system
- Agencies who recently implemented or upgraded their system
- Agencies who conducted a cost/benefit analysis
A copy of the detailed questionnaire is included in Appendix A.
Exhibit 8 identifies the agencies selected for detailed follow-up and the rationale for the selection.
Exhibit 8: Agencies Selected for Detailed Follow-up and Rationale for Selection
Agency |
Key Agency Properties/Criteria |
Idaho Transportation Department |
Undergoing new system implementation |
Kentucky Transportation Cabinet |
Prepared business case analysis |
Maricopa County (AZ) |
LPA using an electronic system |
Maryland SHA |
Prepared business case analysis |
Minnesota DOT |
Uses electronic system that was customized for use |
Polk County (FL) |
LPA using a paper system |
South Dakota DOT |
Uses paper system |
Tennessee DOT |
Prepared business case analysis |
West Virginia DOT |
Recently developed new automated system
Developed business case as a part of overall statewide ERP business case |
Agencies were asked to provide basic information about their system, including the business functions and processes supported by the system, and details about the implementation process. Exhibit 9 provides an overview of agency responses. More detailed case study write-ups for each agency are included in Appendix C.
Exhibit 9: Systems Overview
Agency |
System In Use |
System Type |
Custom or Off the Shelf? |
Size of Program |
Number of Users |
Implementation Cost |
Annual Maintenance Cost |
Integrations |
Idaho Department of Transportation |
PAECETrak - implementation in progress |
Electronic |
Off the shelf |
200 parcels per year, with acquisitions valued at over $20 million in FY 2011 and 2012; 21 relocations in FY 2012 and 20 relocations in FY 2011, with relocation costs of $1.2 million and $580,000 respectively per fiscal year. |
9+ |
$560,000 |
$75,000 |
ProjectWise |
Kentucky Transportation Cabinet |
Right-of-way and Utilities Management System (RWMS) |
Hybrid |
Custom-developed |
1,800-2,000 parcels per year, $20-25 million in acquisition costs per year |
<200 users |
$300,000-400,000 |
0.5 FTE |
None |
Maricopa County |
Real Estate Acquisition Application |
Electronic |
Custom-developed |
300-600 parcels per year, $9-21 million in acquisition costs per year |
8+ |
$26,000 |
~$1,000 during six month period |
None |
Maryland State Highway Department |
Office of Real Estate Management System (OREMS) |
Electronic |
Custom-developed |
Acquired average of 360 parcels; $15.6 million average annual acquisition and relocation cost |
N/A |
$2.6 million |
$150,000 |
GIS |
Minnesota Department of Transportation |
Right-of-way Electronic Acquisition Land Management System (REALMS) |
Electronic |
Framework purchased from Virginia DOT |
400-600 acquisitions per year |
50-75 users |
$2.8 million |
5-6 staff members |
GIS and SWIFT |
Polk County |
-- |
Paper |
Custom-developed |
60 parcels per year |
N/A |
N/A |
6 FTEs |
None |
South Dakota Department of Transportation |
Landowner Database Inventory System; Property Management System |
Hybrid |
Custom-developed in-house |
600-1100 parcels a year, $8-12 million in acquisition costs per year |
N/A |
$198,000 |
N/A |
GIS |
Tennessee Department of Transportation |
Integrated ROW Information System (IRIS) - implementation in progress |
Electronic |
Custom-developed |
1,002 acquisitions in 2012; $43.9 million in compensation costs and $2.3 million in residential and non-residential costs |
150 users |
$1 million |
Includes costs of department overhead, server overhead, disaster recovery |
PeopleSoft PPRM, FileNet, Edison, GIS |
West Virginia Department of Transportation |
Agile Assets RWUR Module |
Electronic |
Custom-developed |
$20 million in acquisition costs per year |
125 users |
$3 million |
$250,000 |
GIS, EMC Documentum, WV's geocoding system |
There were several key benefits, challenges, and lessons learned that emerged from the literature search and surveys of state agencies that are outlined below.
Key Benefits
Key benefits that agencies have reported obtaining from the implementation of a right-of-way management information system include the following:
- Elimination of duplicate data entry into multiple applications/systems
- Faster generation and improved accuracy of required forms
- Improved access to management information for analysis and decision-making
- Increased access to information by internal staff, external stakeholders, and the general public
- Reduction in time required by end users to document information in the system
- Increased utilization of current staff resources and increased efficiency with limited staff resources since information does not have to be "chased" down
- Enhanced management and tracking of encroachment permits
- Improved management and tracking of the negotiation and acquisition processes including ensuring that these processes are properly documented to meet all federal and state requirements
- Increased efficiency in determining relocation eligibility and in the management of relocation payments
- Enhanced property management capabilities including improved collection rates for rent and lease payments
- Increased consistency and standardization of documentation among all District offices
- Improved tracking of utility relocation activities including better visibility to the status of relocation activities and earlier identification of potential issues
- Improved customer service and public relations
- Improved program oversight
- Reduction in risk and increased efficiency in completing right-of-way and utility relocation functions to meet planned letting dates
For agencies with a paper-based system, a primary benefit cited was the cost savings realized from gaining some business process efficiencies and improved access to information, while not purchasing an electronic system. A paper-based system may work well for agencies that have a small right-of-way program, but there are also significant benefits to having an electronic system, especially from the perspective of document storage.
Implementation challenges encountered during implementation of new right-of-way management systems include the following:
- Difficulties with data conversion from the existing automated or manual system
- Obtaining a sufficient level of end-user involvement
- Change management and overcoming resistance throughout the agency
- Balancing resources (i.e., time, money, and IT support) to be able to improve system
- Ensuring adequate technical and end-user support
- Ensuring appropriate executive sponsorship and support
- Overcoming silos during system development to ensure a cross section of people from lower level to higher management are involved in the process
- Lack of budget set aside for future maintenance and improvements to the system
- Need for significant amount of knowledge transfer to the vendor team on right-of-way processes and requirements
These challenges are further explored in the Risks and Barriers to Implementation section of the Report. Also see Exhibit 6.
Lessons Learned
The key lessons identified during the implementation of new right-of-way management systems include the following:
- Ensure business processes are clearly documented and reflect the most current practices before beginning implementation
- Evaluate in-house versus off-the-shelf products as part of selecting an implementation approach, as there are clear advantages and disadvantages inherent in both possible approaches
- Ensure appropriate executive sponsorship and support for the new system
- A strong implementation team (including both consultants and internal staff) is critical to a successful implementation process
- Obtain a sufficient level of end user involvement throughout the entire project lifecycle
- Ensure both headquarters and regional/district staff are involved in system development
- Ensure there is adequate planning for and time and resources devoted to data conversion from the existing automated or manual systems
- Provide adequate levels of end user training that is delivered on a "just in time" basis prior to system implementation
- Ensure adequate technical and end-user support for the new system
- Develop and implement a plan to continue to modify, enhance, and grow the new system versus assuming the initial system go-live is the end of the implementation process
- Plan a program that will meet not only present needs, but which is scalable to meet future needs as well
- Use automated systems to increase client service relationships by creating a transparent acquisition reporting method-schedule and costs can be tracked more easily and clients are better able to see what the cost and schedule drivers within an acquisition process are
- Involve all of the district offices during the implementation process to help them develop a degree of ownership of the implementation effort-input from the district staff was critical in creating a robust system that met everyone's needs
- Prepare a detailed contract with a clearly defined scope to ensure the system implementation vendor fully understands what it is delivering and avoid any misinterpretations
[1] Based on number of respondents as responses from some agencies were inconsistent
[2] Based on percent of respondents who responded using electronic or hybrid systems
[3] Based on percent of respondents who responded using electronic or hybrid systems
[4] Based on percent of respondents who responded using electronic or hybrid systems
[5] Based on percent of respondents who responded using electronic or hybrid systems


