Implementation of Electronic Right-of-Way Management Systems Versus Paper Systems
4 Business Case Analysis
The information gathered from the literature search and case studies, combined with the research team's prior experience with implementing major information systems in state DOTs was used to develop a potential business case for establishing a case for implementing a new right-of-way management system for two development alternatives:
- Commercial-off-the-shelf solution
- Custom-developed solution performed by an external systems integrator for the agency
The intent of the business case analysis performed during this project is to provide an example business case analysis that can be adapted by a state DOT and customized to that agency's particular business environment to help establish the case for implementing a new right-of-way management system. The research team prepared the business case analysis in this report for a hypothetical mid-size state DOT. However, the methodology and templates utilized to perform the analysis are transferrable and adaptable for use by an agency contemplating investing in a new right-of-way management system.
Three of the agencies inter-viewed (Idaho Department of Transportation, Tennessee Department of Transportation, and the West Virginia Depart-ment of Transportation) were in the process of or had recently implemented COTS solutions.
A more detailed description of the two alternatives included in the analysis and the estimated cost of these alternatives are provided in the sections below.
There are currently several COTS packages available in the marketplace that can provide some or most of the functionality required in an electronic right-of-way management system. Typically, many agencies find that no COTS solution completely meets all of their needs. Therefore, it is expected that some degree of customization of the COTS solution is usually required.
The potential advantage of a COTS solution with a limited number of custom extensions is that the initial cost to implement the COTS solution (the commercial software plus some customized add-ons) may be less expensive than developing a custom solution from scratch. However, this assumption is highly dependent on the cost of acquiring the COTS licenses. In addition, the COTS solution still requires design and development of any required interfaces with other agency systems and any custom programs needed to support conversion of data from existing systems. Another advantage of the COTS solution is that the agency, as long as it pays the annual software maintenance fees, will continue to receive product upgrades; whereas in a custom solution, the agency's IT staff or a contractor hired by the agency would be responsible for any upgrades or enhancements to the system.
Project activities for the implementation of a COTS solution can generally be divided into four phases: (1) Pre-implementation Planning phase, (2) System Implementation phase, (3) Project Management phase, and (4) Organizational Change Management phase. The Project Management and Organizational Change Management phases span the full lifecycle of the project. The suggested task/activities in each phase are described below.
Pre-implementation Planning Phase
The suggested task/activities in the Pre-implementation Planning phase are as follows:
- Initiate the project, including developing a project charter, a project management plan to outline management processes to be followed during the project, and the initial project work plan. A project kick-off meeting with all key stakeholders should also be conducted.
- Review and document the agency's current or "As-Is" business processes. Typically, this is done by developing a series of process flows and brief narratives for each major business process or sub-process and identifying issues or bottlenecks with each process.
- Conduct several business process re-engineering sessions to prepare "To-Be" business process flows which address key issues or bottlenecks defined during the As-Is documentation efforts.
- Define system requirements to reflect the proposed To-Be processes. Requirements typically consist of the following:
- - Functional requirements include the required capabilities within the new right-of-way management solution to support the needs of the business. The functional requirements will be organized logically by major business process and sub-process.
- - An initial list of data that should be included in an electronic right-of-way information management system, as developed by the research team in Task 5, can be found in Appendix D. This list is organized by major business process and sub-process and identifies potential sources for accessing or collecting the relevant data.
- General requirements include capabilities that cut across functional areas, such as ease of use, common look and feel, security, work flow, audit trails, archiving, document management (if desired in the right-of-way solution itself), online help, and user documentation among others.
- Management analysis and reporting requirements include user requirements for a robust, easy-to-use reporting environment within the right-of-way system itself and for the capability of the new right-of-way software to integrate with other business intelligence and reporting environments utilized by the agency. These requirements will include both standard reports available within the software solution and ad-hoc reporting capabilities.
- Interface requirements include requirements to integrate with existing or planned agency systems such as the agency's financial management system, project management system, document management system, or geographic information system (GIS) environment.
- Conversion requirements include requirements to migrate data from one or more existing agency systems to the new system.
- Prepare a request for proposal (RFP) to select the COTS solution and the systems integrator. We have assumed that the agency will select the COTS solution and the systems integrator in a single RFP process as currently in the right-of-way COTS market most software vendors do their own product implementations versus some other types of application systems where multiple systems integrators may implement a COTS product and the agency may obtain a better price by first selecting the COTS software solution and then bidding out the implementation services separately.
- Review proposals, conduct software demonstrations for all or a short list of proposers, and select the COTS solution and the systems integrator to implement the COTS solution.
- Complete required contract negotiations.
System Implementation Phase
The suggested task/activities in the System Implementation phase are as follows:
- Initiate implementation phase, including preparing the updated work plan for implementation reflecting the selected systems integrator's proposed approach and timeline for conducting the implementation and holding an implementation phase kick-off meeting.
- Confirm system requirements, which is designed to have the systems integrator/software vendor review and confirm its understanding of the requirements with the agency staff.
- Provide training on the selected COTS solution for agency staff on working on the project team.
- Configure the selected COTS solution.
- Conduct an initial testing session often called a conference room pilot or CRP to validate the fit of the software against the requirements.
- Identify gaps between the COTS solution and the agency's requirements and propose solutions to address the gaps.
- Design and develop required customizations to address any gaps; design and develop custom reports and design and develop interface and conversion programs.
- Conduct system test to verify individual system functions (for example appraisal, acquisition, and negotiation).
- Conduct integration test to test the inter-relationships between major business functions (for example managing a parcel across the appraisal, acquisition, and negotiation processes) and interfaces with other systems.
- Execute Mock Conversion 1, which usually occurs just prior to the integration test.
- Prepare for and conduct user acceptance test-it is recommended that this be an agency-led activity and that the testing involves additional staff who have not been involved in the day-to-day project development activities.
- Execute Mock Conversion 2, which usually occurs just prior to the user acceptance test.
- Prepare training materials and user procedures-typically, this material will be developed by customizing and enhancing the software vendor's base materials to meet the needs of the specific agency.
- Conduct end-user training-typically, it is recommended that the systems integrator teach one or two classes as a pilot and then the remaining end-user training is conducted by agency personnel who have been a part of the research team. Training may also be offered before user acceptance test as a way of validating the effectiveness of the training with any user acceptance testers who are new to the system.
- Execute the final data conversion and cutover the system to a production status.
- Provide post production support for a period of time, such as 60 days, in which the research team stays together as a unit prior to turning the system over to the ongoing post production support team. This period typically constitutes the system acceptance period and proceeds final payment for the implementation services to the systems integrator.
Project Management Phase
The Project Management phase tasks are performed throughout the project, and the tasks include:
- Manage performance of all project activities
- Maintain the project work plan
- Prepare project status reports
- Manage potential project scope changes that may arise
- Conduct Project Steering Committee meetings
- Manage the project budget and financial plan
Organizational Change Management Phase
Organizational Change Management phase tasks are performed throughout the project, and the tasks include:
- Identify impacts of the new system on the organization
- Plan for and proactively manage the implementation of these changes throughout the project lifecycle including a structured stakeholder engagement and communications plan for central office and field staff
- Manage and implement user training program on both the new system and new business procedures
Exhibit 10 provides a representative timeline for the implementation of a COTS solution. The total project duration is 29 months from project initiation through post production support. This includes all the time required for procurement of the COTS solution and systems integration services.
For purposes of this analysis, we are showing functionality being deployed in a single implementation step. Alternatively, an agency could stage deployment of functionality by business function or major process-for example, implement the appraisal, negotiation, and acquisition functions first and other functions at a later point.
Exhibit 10: Potential Timeline for COTS Implementation
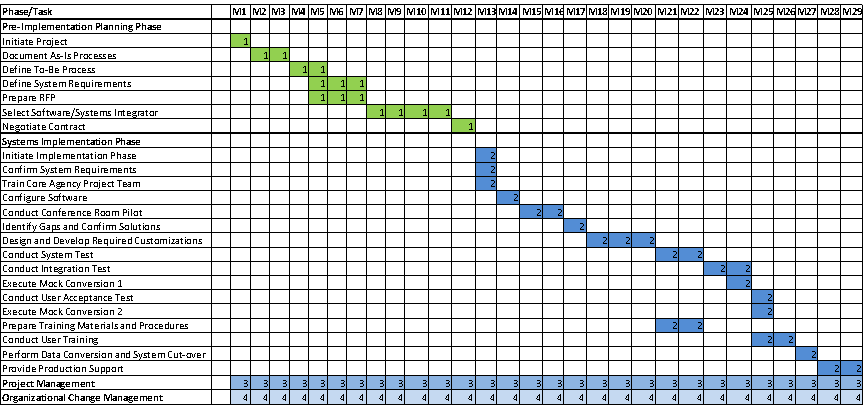
Legend
| 1 |
Anticipated duration of Pre-implementation Planning, Project Management, and Organizational Change tasks |
| 2 |
Anticipated duration of Systems Implementation tasks |
| 3 |
Anticipated duration of Project Management tasks |
| 4 |
Anticipated duration of Organizational Change Management |
Cost Estimate
The cost estimate for a COTS solution hosted by the agency itself on-site or in a state-managed data center includes the following components:
- External consultant (if utilized) to support the Pre-implementation Planning phase-A cost of $250,000 has been assumed in Year 1.
- Initial cost of acquiring software licenses-Licensing cost was assumed to be $500,000 with the license acquired at the start of the System Implementation phase in Year 2.
- Software maintenance cost, which is typically 20 to 22 percent of the cost of the initial software licenses for the entire seven-year period being modeled. Model was developed at 20 percent of original software license cost escalated 2 percent per year for Year 2 through Year 7.
- Systems integration services to configure and test the COTS solution; develop required custom extensions; develop interface and conversion programs; deploy the new system and support the system for the 60 day post production/system acceptance period. For this analysis, we are assuming an 80‑percent fit between the selected software and the agency's requirements with customizations needed to address the identified gaps between the COTS solution and the agency's requirements. Based on recent experience of the research team, systems integration cost has been assumed to be $1.8 million, with this expenditure across two fiscal years. Sixty percent of the cost is allocated to Year 2 and 40 percent of the cost is allocated to Year 3.
- Managed services support for one year following implementation by a scaled down vendor team working closely to transition the system to the agency's IT staff. Cost is estimated at $365,000 based on one FTE staff member from the systems integrator. This cost is split between Year 3 (60 percent) and Year 4 (40 percent). We would typically recommend that this support period include an upgrade to the most current release of the software vendor's solution prior to the end of the managed services period.
- Incremental hardware (additional servers or other components) or other technical infrastructure (operating system software, database management system software, etc.) specifically required to support the new right-of-way system. For purposes of this analysis, incremental cost of additional technical infrastructure is assumed to be $100,000.
- Maintenance on the hardware and other technical infrastructure components, which is assumed to be 15 percent of the acquisition cost for the incremental hardware and software. This cost is also escalated 2 percent per year through the technology refresh in Year 5 and then again for Year 6 and Year 7 using the cost of the technology refresh as the new base cost for escalation purposes.
- One complete refresh of the hardware and technical infrastructure in Year 5 of the seven-year planning period. For purposes of this analysis, the cost of the technical refresh is assumed to be $100,000 in Year 5.
- Agency staff cost during the project-Typically, we would allocate to the project the cost of any agency staff assigned to the project full-time or near full-time where it is necessary to backfill their current regular assignment. In some situations where the backfill is going to be performed by an external resource, we would include the additional cost associated with backfilling for the person with a consultant in the project budget. The cost of staff participating in project workshops, reviewing project deliverables, and participating in testing and other activities on a part-time basis is usually not included in the project budget. For purposes of this analysis, we have assumed one agency business staff member and one agency IT staff member at a fully loaded rate of $75/hour during Pre-implementation Planning and two business staff members and two IT staff members at the same fully loaded rates during the System Implementation phase for a cost of $1,248,000. This cost assumes two FTE staff members during Year 1 for the Pre-implementation Planning phase at a cost of $312,000 and three FTE staff members during Year 2 and Year 3 for the System Implementation phase at a cost of $468,000 per year.
- Agency staff cost to support the system during production operations-This includes both the business side lead or system power user and the agency IT staff supporting the solution. We have included a 50‑percent FTE business staff person at $75/hour and a 50‑percent FTE IT staff member for the balance of the seven-year planning period with a cost of $936,000. This represents a cost of $156,000 per year in Year 4 and Year 5 for ongoing support; a cost of $468,000 in Year 6 to support an increased staffing level of two business staff and two IT staff during a planned upgrade of the system to the next version of the COTS software; and a cost of $156,000 in Year 7 for a continuation of routine ongoing support.
- Systems integration support for one major upgrade at approximately Year 6 of the seven‑year planning window-This cost is assumed to be approximately 40 percent of the original implementation cost or $750,000.
- Agency staff cost during the major upgrade-This staffing is modeled at the same levels and cost factors as during the initial system implementation.
Exhibit 11 outlines the proposed cost for the COTS alternative. The initial cost to implement the solution defined as the project cost and the first year of operations (Year 1 through Year 3) is $4.3 million. The seven-year total cost of ownership is $6.78 million.
Exhibit 11: Cost Estimate for COTS Implementation
Cost Element |
Total |
Year 1 |
Year 2 |
Year 3 |
Year 4 |
Year 5 |
Year 6 |
Year 7 |
Pre-implementation planning consultant |
$250,000 |
$250,000 |
|
|
|
|
|
|
COTS software licenses |
$500,000 |
|
$500,000 |
|
|
|
|
|
COTS software maintenance |
$630,812 |
|
$100,000 |
$102,000 |
$104,040 |
$106,121 |
$108,243 |
$110,408 |
Systems integration services |
$1,800,000 |
|
$1,080,000 |
$720,000 |
|
|
|
|
anaged services support |
$365,000 |
|
|
$219,000 |
$146,000 |
|
|
|
Hardware and other technical infrastructure |
$100,000 |
|
$100,000 |
|
|
|
|
|
Hardware and infrastructure maintenance |
$92,730 |
|
$15,000 |
$15,300 |
$15,606 |
$15,918 |
$15,300 |
$15,606 |
Hardware refresh |
$100,000 |
|
|
|
|
$100,000 |
|
|
Agency staff cost during project |
$1,248,000 |
$312,000 |
$468,000 |
$468,000 |
|
|
|
|
Agency staff cost to support system ongoing |
$936,000 |
|
|
|
$156,000 |
$156,000 |
$468,000 |
$156,000 |
Systems integration services for upgrade |
$750,000 |
|
|
|
|
|
$750,000 |
|
Total Cost |
$6,772,542 |
$562,000 |
$2,263,000 |
$1,524,300 |
$421,646 |
$378,039 |
$1,341,543 |
$282,014 |
Several of the agencies inter-viewed had implemented custom solutions, some developed internally and some developed with the assistance of a third party systems integrator. Agencies with custom solutions included the Kentucky Transportation Cabinet, Maricopa County, Maryland State Highway Administration, and the Minnesota Department of Transportation.
The second alternative is the custom development of a new right-of-way information management system by an external systems integrator on behalf of the agency. The most obvious benefit of this alternative is the ability to custom build a solution that can specifically meet all of the agency's defined requirements. While this may seem desirable from an operational point of view, this approach typically takes longer given the time required to design, develop and implement the solution. The cost to build may also be higher depending on the difference between the development cost and the cost to purchase licenses for the COTS product. In addition, typically, we would consider a custom developed solution to be more risky from an information technology project delivery perspective. However, if an extensive amount of customization of the COTS solution is going to be required to meet an agency's requirements, it may become more practical and potentially even less costly and less risky to custom develop a solution rather than to purchase a COTS solution and then extensively customize the COTS solution.
Project activities for the development of a custom solution can generally be divided into two phases: Pre-implementation Planning and System Implementation. The activities under Pre-implementation Planning phase are similar to those under the COTS alternative, while the System Implementation phase involves much more custom development and system build out. There is also a Project Management phase and a Change Management phase which span the full lifecycle of the project. The suggested tasks/activities in each phase are outlined below.
Pre-implementation Planning Phase
Tasks during Pre-implementation Planning include:
- Initiate the project, including developing a project charter, a project management plan to outline management processes to be followed during the project, and the initial project work plan. A project kick-off meeting with all key stakeholders should also be conducted.
- Review and document the agency's current or "As-Is" business processes.
- Conduct several business process re-engineering sessions to prepare "To-Be" business process flows which address key issues or bottlenecks defined during the As-Is documentation efforts.
- Define system requirements (as described for the COTS alternative above) to reflect the proposed To-Be processes.[6]
- Prepare an RFP to select the systems integrator to develop and implement the custom solution.
- Review proposals, conduct interviews of all proposers or a short list and the select systems integrator to build the custom solution.
- Complete required contract negotiations.
System Implementation Phase
Tasks during System Implementation include:
- Initiate implementation phase.
- Confirm system requirements to validate that the systems integrator fully understands the agency's requirements.
- Prepare a system design which documents the screens, reports, and data structures within the proposed system.
- Detail design, code and unit test the custom programs required for the system, as well as any interface and data conversion programs.
- Conduct system test.
- Execute Mock Conversion 1.
- Conduct integration test.
- Execute Mock Conversion 2.
- Prepare for and conduct user acceptance test.
- Prepare training materials, user procedures, and detailed technical documentation for the new system. These materials will need to be developed from scratch as the system is being developed.
- Conduct end-user training; as with the COTS solution, typically it is recommended that the systems integrator teach one or two classes as a pilot and then the remaining training is conducted by agency personnel who have been a part of the research team.
- Execute the final data conversion and cut-over the system.
- Provide post-production support for a period of time, such as 60 days, in which the research team stays together as a unit prior to turning the system over to the post-production support team. As with the COTS alternative, this 60‑day window serves as the system acceptance period for the agency
Project Management Phase
The Project Management phase tasks are performed throughout the project and the tasks include:
- Manage performance of all project activities
- Maintain the project work plan
- Prepare project status reports
- Manage potential project scope changes that may arise
- Conduct Project Steering Committee meetings
- Manage the project budget and financial plan
Organizational Change Management Phase
Organizational Change Management phase tasks are performed throughout the project, and the tasks include:
- Identify impacts of the new system on the organization
- Plan for and proactively manage the implementation of these changes throughout the project lifecycle, including a structured stakeholder engagement and communications plan for central office and field staff
- Manage and implement user training program on both the new system and new business procedures
Please note that an agency could elect to phase its implementation, in which case the System Implementation phase activities could be repeated for various functional areas-for example, Appraisal, Negotiation, and Acquisition are implemented in one phase, Relocation in a second phase, and then Property Management in a third phase at a later time.
In addition, these implementation tasks/activities are outlined following what is known as a "waterfall" methodology. An alternative approach would be to use an "Agile" methodology in which sections of a system are designed, developed, and unit tested in a series of short two- to three-week "sprints" and then sets of functionality developed across several sprints are tested and deployed into production in a series of software releases. Increasingly, more systems are being developed following an Agile methodology.
Exhibit 12 provides a representative timeline for the implementation of a COTS solution. The anticipated duration is slightly longer than the COTS alternative at 31 months from project initiation through post-production support.
Exhibit 12: Potential Timeline for Custom Implementation
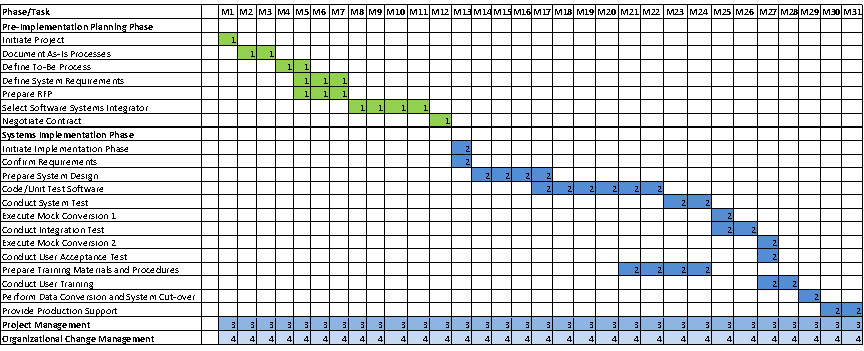
Legend
| 1 |
Anticipated duration of Pre-implementation Planning, Project Management, and Organizational Change tasks |
| 2 |
Anticipated duration of Systems Implementation tasks |
| 3 |
Anticipated duration of Project Management tasks |
| 4 |
Anticipated duration of Organizational Change Management |
Cost Estimate
The cost estimate for a custom solution developed by a systems integrator and hosted by the agency includes the following components:
- External consultant (if utilized) to support the Pre-implementation Planning phase-A cost of $250,000 has been assumed in Year 1.
- Systems integration services to configure test and deploy the new system and support the system for the 60‑day acceptance period-This is estimated based on the research team's prior experience as 16,000 hours of effort at $175/hour. The cost is divided evenly between Year 2 and Year 3.
- Managed services support for one year following implementation by a scaled-down vendor team working closely to transition the system to the agency's IT staff-Cost is estimated at $365,000 based on one FTE staff member from the systems integrator. This cost is split between Year 3 (40 percent) and Year 4 (60 percent). The relative allocation of the cost of this item by year is based on the target go-live date for the custom alternative in Year 3. This go-live date occurs later in the year for the custom alternative than it does for the COTS alternative meaning that more of the managed services support for the custom alternative will continue into Year 4 than was the case for the COTS alternative.
- Incremental hardware (additional servers or other components) or other technical infrastructure (operating system software, database management system software, etc.) specifically required to support the new right-of-way system-For purposes of this analysis, incremental cost of additional technical infrastructure is assumed to be $100,000 in Year 2.
- Maintenance on the hardware and other technical infrastructure components, which is assumed to be 15 percent of the acquisition cost of the incremental hardware and other technical infrastructure-This cost is also escalated 2 percent per year through the technology refresh in Year 5 and then again for Year 6 and Year 7 using the cost of the technology refresh as the new base cost for escalation purposes.
- One complete refresh of the hardware and technical infrastructure in Year 5 of the seven-year planning period-For purposes of this analysis, the cost of the technical refresh is assumed to be $100,000 in Year 5.
- Agency staff cost-The methodology is similar to the COTS alternative. For purposes of this analysis, we have one agency business staff member and one IT staff member at $75/hour during Pre-implementation Planning and two business staff members and two IT staff members during the System Implementation phase with a cost of $1,248,000. This cost assumes two FTE staff members during Year 1 for the Pre-implementation Planning phase at a cost of $312,000 and three FTE staff members during Year 2 and Year 3 for the System Implementation phase at a cost of $468,000 per year.
- Agency staff cost to support the system during production operations-This includes both the business side system champion or power user and the agency IT staff supporting the solution. We have included a 50‑percent FTE business staff person at $75/hour and one FTE IT staff member for the balance of the seven-year planning period. The IT support is assumed to be higher in the custom alternative than the COTS alternative as there will be a need for the agency to add to or enhance the system versus applying new software releases from the COTS vendor. The total cost of agency staff to operate and maintain the system is $936,000. This represents a cost of $234,000 per year in Year 4 through Year 7.
Exhibit 13 outlines the proposed cost for the custom development alternative. The initial cost to implement the solution defined as the project cost and the first year of operations (Year 1 through Year 3) is $4.6 million. The seven-year total cost of ownership is $5.9 million. The total cost of ownership is very similar to the total cost of ownership of the COTS alternative since while it costs more to develop the custom solution there are no reoccurring software licensing costs.
Exhibit 13: Cost Estimate for Custom Implementation
Cost Element |
Total |
Year 1 |
Year 2 |
Year 3 |
Year 4 |
Year 5 |
Year 6 |
Year 7 |
Pre-implementation planning consultant |
$250,000 |
$250,000 |
|
|
|
|
|
|
Systems integration services |
$2,800,000 |
|
$1,400,000 |
$1,400,000 |
|
|
|
|
Managed services support |
$365,000 |
|
|
$146,000 |
$219,000 |
|
|
|
Hardware and other technical infrastructure |
$100,000 |
|
$100,000 |
|
|
|
|
|
Hardware and infrastructure maintenance |
$92,730 |
|
$15,000 |
$15,300 |
$15,606 |
$15,918 |
$15,300 |
$15,606 |
Hardware refresh |
$100,000 |
|
|
|
|
$100,000 |
|
|
Agency staff cost during project |
$1,248,000 |
$312,000 |
$468,000 |
$468,000 |
|
|
|
|
Agency staff cost to support system ongoing |
$936,000 |
|
|
|
$234,000 |
$234,000 |
$234,000 |
$234,000 |
Total Cost |
$5,891,730 |
$562,000 |
$1,983,000 |
$2,029,300 |
$468,606 |
$349,918 |
$249,300 |
$249,606 |
This section analyzes the benefits to be realized from implementing a new electronic right-of-way management system. All the tangible and intangible benefits addressed in this section are based on implementing functionality to support core right-of-way business processes, including Appraisal, Acquisition, Negotiation, Relocation, and Property Management.
There are two key benefit terms that are used in this analysis:
- Tangible benefits-Any benefits that can be quantified and expressed in monetary terms are considered to be tangible benefits. The result of tangible benefits may be, for example, increased revenue, streamlined production (improved efficiency), and reinvestment opportunities in terms of an agency's overall capital program (more projects or output with the same capital budget) or its right-of-way program budget.
- Intangible benefits-Any benefits that cannot be assigned a specific dollar value or otherwise quantified are considered to be intangible benefits. These benefits are expressed in terms of improved mission performance, improved decision making, more reliable or usable information, and improved "good will" (e.g., perceptions of agency performance by the governor, the Legislature, and the general public). Many public goods and services are difficult to reliably and precisely quantify in dollar units. However, intangible benefits are vital to understanding the total outcome of implementing a new right-of-way information system.
This subsection identifies anticipated tangible benefit streams. These tangible benefit streams have been established based on the experience of the research team and information obtained through the agency surveys and interviews.
Given the limited (almost non-existent) available research data on the actual benefits achieved from the implementation of a right-of-way management system in a transportation agency, we would recommend that the agency achieve a consensus on a set of benefit assumptions within their agency through the use of the "Delphi" method-that is consulting with a series of subject matter experts within their agency and potentially in other peer agencies on their opinion on what is a reasonable and conservative benefit stream and then use these agreed to benefit stream assumptions as the basis for constructing a business case. An agency can use the potential benefit streams documented in this report as a starting point for these collaborative discussions, adding or removing benefit streams or making adjustments in savings assumption based on their specific agency environments.
The research team suggests for agency consideration the following potential quantifiable benefit streams:
- An increase in the overall efficiency and effectiveness of the delivery of the agencies capital program as measured by a reinvestment opportunity of 1/2 percent of the annual capital program resulting from a reduction in delays in meeting project letting dates due to delays in acquiring right-of-way; this reinvestment opportunity allows an agency to deliver more projects or more value within projects (outputs/outcomes) from the same level of capital budget dollars
- Enhanced ability to monitor, control, and report on the performance of the delivery of the agency's right-of-way program as measured by a reinvestment opportunity in the form of a 2‑percent annual savings in the cost of parcel acquisitions
- Improved efficiency and effectiveness in the delivery of the right-of-way program as a result of standardization and automation as measured by a reinvestment opportunity in the form of a 3‑percent savings in total staff cost (both internal staff and external appraisers and consultants) to deliver the agency's right-of-way program
- Improved management of the relocation program as measured by a reinvestment opportunity in the form of a 2‑percent savings in the total relocation benefits paid out per year by the program
- More timely and effective property management as measured by a reinvestment opportunity of a 2‑percent savings in the total annual cost (internal and external) to perform property management activities
Exhibit 14 outlines these potential benefit streams on an annualized basis for a hypothetical transportation agency with a $400 million capital program, annual property acquisition cost of $40 million, and annual relocation costs of $4 million.
Exhibit 14: Potential Tangible Benefit Streams
Anticipated Benefit Stream |
Estimated Benefit |
Reinvestment opportunity based on a 1/2 % annual savings in capital program based on annual program size of $400 million |
$2,000,000 |
Reinvestment opportunity resulting from a 2 % annual savings in the cost of parcel acquisitions based on annual parcel acquisition costs of $40 million |
$800,000 |
Reinvestment opportunity resulting from a 3% annual savings in staff cost to deliver the right-of-way program (exclusive of property management) based on a total internal and external cost of $5 million |
$150,000 |
Reinvestment opportunity resulting from a 2% annual savings in relocation program costs based on an annual relocation program size of $4 million |
$80,000 |
Reinvestment opportunity resulting from a 2% annual savings in staff cost to perform property management activities based on a total internal and external cost of $400,000 |
$8,000 |
Total Estimated Annual Benefits |
$3,038,000 |
Intangible Benefits
This sub-section outlines potential intangible benefits from the implementation of a new right-of-way management system. Potential intangible benefits include:
- Re-engineering and standardizing work processes through the application of new technology
- Consolidating potentially duplicate systems
- More effectively meeting current agency business requirements and providing a platform for more easily addressing changes in agency business needs in the future
- Reducing business risk in terms of complying with changes to regulatory requirements
- Strengthening internal controls within the agency's right-of-way function
- Improving customer service to agency partners and employees
- Implementing standardized reporting capabilities with timely and accurate data
- Implementing electronic workflow and approval capabilities for many right-of-way business functions
- Eliminating or significantly reducing the number of silo or off-line systems within the agency's right-of-way function
- Accurately capturing and securely storing agency data
- Incorporating mobile technologies to allow employees or consultants to interact with the new system in the field
- Incorporating self-service functionality for partners and suppliers, resulting in reduced manual entry being required into the new system by agency employees
- Providing solid performance measurement capabilities
- Providing the ability to interface with various existing and future agency financial management, project management, document management, and GIS systems/applications
- Implementing a solution which is easy to learn, use, and maintain
- Implementing a solution which utilizes a current state of the practice technologies and, as a result, is easier to maintain and enhance to address changing business needs
This section documents the proposed return on investment analysis from the implementation of a new right-of-way management system for a transportation agency. For purposes of this analysis, the realization of the anticipated benefit stream has been staged as follows:
- No benefits during the implementation period or in the first year after implementation
- 25 percent of the potential benefit stream achieved in the next full year following implementation (Year 4 based on the project timelines)
- 50 percent of the potential benefit stream achieved in the second full year following implementation (Year 5 based on the project timelines)
- 100 percent of the potential benefit stream achieved in the third full year following implementation and all remaining years (Year 6 and Year 7 based on the project timelines)
Exhibit 15 presents the return on investment analysis for the COTS alternative. It shows a cumulative net benefit of $1.58 million with a payback early in Year 7 or 4 years after the initial system implementation is complete. Exhibit 16 presents the return on investment analysis for the custom development alternative. It shows a total cumulative net benefit of $2.5 million with a payback in Year 7 or 4 years after the initial system implementation is complete.
Exhibit 15: Return on Investment Analysis and Payback for COTS Alternative
Cost Element |
Total |
Year 1 |
Year 2 |
Year 3 |
Year 4 |
Year 5 |
Year 6 |
Year 7 |
Reinvestment opportunity based on a 1/2 % annual savings for a capital program size of $400 million per year |
$5,500,000 |
|
|
|
$500,000 |
$1,000,000 |
$2,000,000 |
$2,000,000 |
Reinvestment opportunity resulting from a 2% annual savings in the cost of parcel acquisitions for a $40 million per year acquisition program |
$2,200,000 |
|
|
|
$200,000 |
$400,000 |
$800,000 |
$800,000 |
Reinvestment opportunity resulting from a 3% annual savings in internal and external staff cost to deliver the right-of-way program (exclusive of property management) based on an estimated staff cost of $5 million per year |
$412,500 |
|
|
|
$37,500 |
$75,000 |
$150,000 |
$150,000 |
Reinvestment opportunity resulting from a 2% annual savings in relocation program cost based on an estimated program cost of $4 million |
$220,000 |
|
|
|
$20,000 |
$40,000 |
$80,000 |
$80,000 |
Reinvestment opportunity resulting from a 2% annual savings in staff cost to perform property management activities based on an estimate staff cost of $400,000 |
$22,000 |
|
|
|
$2,000 |
$4,000 |
$8,000 |
$8,000 |
Total Estimated Benefits |
$8,354,500 |
$0 |
$0 |
$0 |
$759,500 |
$1,519,000 |
$3,038,000 |
$3,038,000 |
Total Estimated Costs* |
$6,772,542 |
$562,000 |
$2,263,000 |
$1,524,300 |
$421,646 |
$378,039 |
$1,341,543 |
$282,014 |
Estimated Net Benefit |
$1,581,958 |
-$562,000 |
-$2,263,000 |
-$1,524,300 |
$337,854 |
$1,140,961 |
$1,696,457 |
$2,755,986 |
Cumulative Net Benefit |
|
-$562,000 |
-$2,825,000 |
-$4,349,300 |
-$4,011,446 |
-$2,870,485 |
-$1,174,028 |
$1,581,958 |
*See Exhibit 11 for Total Estimated Costs
Exhibit 16: Return on Investment Analysis and Payback for Custom Alternative
| |
Total |
Year 1 |
Year 2 |
Year 3 |
Year 4 |
Year 5 |
Year 6 |
Year 7 |
Reinvestment opportunity based on a 1/2 % annual savings for a capital program size of $400 million per year |
$5,500,000 |
|
|
|
$500,000 |
$1,000,000 |
$2,000,000 |
$2,000,000 |
Reinvestment opportunity resulting from a 2 % annual savings in the cost of parcel acquisitions for a $40 million per year acquisition program |
$2,200,000 |
|
|
|
$200,000 |
$400,000 |
$800,000 |
$800,000 |
Reinvestment opportunity resulting from a 3% annual savings in internal and external staff cost to deliver the right-of-way program (exclusive of property management) based on an estimated staff cost of $5 million |
$412,500 |
|
|
|
$37,500 |
$75,000 |
$150,000 |
$150,000 |
Reinvestment opportunity resulting from a 2% annual savings in relocation program cost based on an estimated program cost of $4 million |
$220,000 |
|
|
|
$20,000 |
$40,000 |
$80,000 |
$80,000 |
Reinvestment opportunity resulting from a 2% annual savings in staff cost to perform property management activities based on an estimated staff cost of $400,000 |
$22,000 |
|
|
|
$2,000 |
$4,000 |
$8,000 |
$8,000 |
Total Estimated Benefits |
$8,354,500 |
$0 |
$0 |
$0 |
$759,500 |
$1,519,000 |
$3,038,000 |
$3,038,000 |
Total Estimated Costs* |
$5,891,730 |
$562,000 |
$1,983,000 |
$2,029,300 |
$468,606 |
$349,918 |
$249,300 |
$249,606 |
Estimated Net Benefit |
$2,462,770 |
-$562,000 |
-$1,983,000 |
-$2,029,300 |
$290,894 |
$1,169,082 |
$2,788,700 |
$2,788,394 |
Cumulative Net Benefit |
|
-$562,000 |
-$2,545,000 |
-$4,574,300 |
-$4,283,406 |
-$3,114,324 |
-$325,624 |
$2,462,770 |
*See Exhibit 13 for Total Estimated Costs
[6] An initial list of data elements that should be included in an electronic right-of-way information management system, as developed by the research team in Task 5, can be found in Appendix D. This list is organized by major business process and sub-process and identified potential sources for accessing or collecting the relevant data.


