The first objective of this study is to identify the potential range in noise abatement decisions that could result from using the various combinations of factors permitted under the regulation. The study included a review of the feasibility and reasonableness values used by all fifty states, the District of Columbia, and Puerto Rico to identify current ranges in the factors.
The starting point was a compilation of the SHA factors in spreadsheet format provided by FHWA. The spreadsheet did not include the unit costs used for barrier cost calculations. Therefore, the SHA policies were reviewed to obtain unit cost data and update and otherwise expand upon the spreadsheet.
The following sections describe the ranges in values for the feasibility and reasonableness factors identified in Chapter 1. The sections include numerous summary tables. A yellow highlighted value in a table indicates that the factor or combination of factors appears in one or more of the SHA policies, with the value being the number of policies using that factor or combination of factors.
The data used in developing the summary tables are contained in spreadsheets with individual worksheets where the data are sorted by one or more of the factors. The individual worksheets show data in alphabetical order by state sorted by:
For a noise abatement measure to be feasible, the regulation requires that the specified feasibility noise reduction criterion be met at a minimum of either 1) a number of impacted receptors[1] or 2) a percentage of impacted receptors (to be called "feasibility quantity" in this report).
A receptor is identified as impacted per the regulation when its future design-year worst-hour equivalent sound level (Leq(h)):
As of March 2013, all of the SHAs use 5 dB for the feasibility noise reduction criterion. The Request for Proposal (RFP) for this research stated that "feasibility is static," based on the use of the 5 dB minimum noise reduction. However, the number or percentage of impacted receptors that must meet the 5 dB is not static as described the following section.
Table 1 shows the combinations of feasibility quantities and noise reductions used by SHAs. As shown, there is a substantial range in the values for feasibility quantity from only one impacted receptor to 80% of all impacted receptors. Thirteen of the SHAs specify a minimum number of impacted receptors, ranging from 1 to 3.
Nearly three-quarters of the SHAs specify a minimum percentage of impacted receptors. This minimum percentage has been defined in two ways:
The percentage values of all impacted receptors range from 40% to 80% while the percentage values of first-row impacted receptors range from 50% to 80%. The latter range includes one SHA that specifies 80% of first-row impacted and 67% of all impacted (Kansas DOT).
Feasibility Quantity (Number or Percent of Impacted Receptors) |
Number of SHAs by Feasibility Reduction |
|---|---|
5 dB |
|
1 |
13 |
2 |
1 |
3 |
1 |
40% |
1 |
50% of first-row impacted |
3 |
50% |
5 |
>50% of first-row impacted |
3 |
>50% |
10 |
60% of first-row impacted |
2 |
67% of first-row impacted |
2 |
67% |
1 |
70% |
1 |
75% of first-row impacted |
4 |
75% |
2 |
80% of first-row impacted |
1 |
80% of first-row and 67% of all impacted |
1 |
80% |
1 |
The regulation requires that the SHA define the noise reduction required for a receptor to be considered benefited, and stipulates that the value cannot be less than 5 dB and no more than the NRDG. Table 2 summarizes the benefited noise reductions used by SHAs.
As shown, benefited noise reduction values range from 5 dB to 9 dB with forty-four SHAs using 5 dB. None use a benefited noise reduction of 6 or 10 dB, which the regulation does allow.
It is important to note that a receptor does not have to be impacted to be counted as "benefited;" although, one SHA (Delaware DOT (DelDOT)) bases its criterion on those "benefited that are also impacted." Although noise abatement measures are designed to provide the desired noise reduction for impacted receptors, the abatement measure often provides noise reduction for other non-impacted receptors located farther back from the road (i.e. second-row). These receptors would be counted as "benefited" in the reasonableness analysis if their reductions are at or above the minimum benefited noise reduction in the SHA policy. Two SHAs (DelDOT and New Jersey DOT) give less weight (25% and 50%, respectively) to receptors that are benefited but not impacted.
Benefited Noise Reduction |
Number of SHAs by Benefited Noise Reduction |
|---|---|
5 dB |
44 |
6 dB |
-- |
7 dB |
4 |
8 dB |
3 |
9 dB |
1 |
10 dB |
-- |
Noise Reduction Design Goal (NRDG) is one of three factors that must be met for a noise abatement measure to be reasonable. The regulation permits NRDGs to be between 7 and 10 dB. As shown in Table 3, all SHAs have NRDG values within that range. Nearly three-quarters of the SHAs use 7 dB, and approximately one-quarter use 8, 9 or 10 dB. One SHA (Michigan DOT (MDOT)) specifies 10 dB at one benefited receptor and 7 dB at 50% of all benefited receptors. Of those using 7 dB, six specify the value as a "minimum" goal, with a stated desirable value of 10 dB in five cases (Maine DOT, Maryland State Highway Administration (MDSHA), New Hampshire DOT, New York State DOT (NYSDOT) and Washington State DOT (WSDOT)) and greater than 7 dB in one case (Pennsylvania DOT (PennDOT)).
The regulation requires that the SHAs specify either a number or percentage of benefited receptors that must meet the NRDG criterion. Two SHAs (DelDOT and Virginia DOT (VDOT)) base the quantity on impacted receptors instead of benefited receptors. Table 4 shows the combinations of NRDG and NRDG Quantity used by the SHAs. As shown, just under half of the SHAs use a numerical quantity. Nineteen specify one benefited receptor and four specify one first-row benefited receptor, while one uses a mixed quantity - meeting a 10 dB NRDG at one benefited receptor and a 7 dB reduction at 50% of all of benefited receptors.
There is a wide range in percentage quantities used by the SHAs for the NRDG, just as with feasibility quantities: from a low of only 10% of the first-row benefited receptors to a high of 80% of all benefited receptors. Combining both the numerical and percentage quantities, the range is even larger: from a single benefitted receptor to 80% of all benefited receptors.
As noted in the previous section, almost all of the policies use 7 or 10 dB for the NRDG, with a few using 8 or 9 dB. By far the most common - and most easily achieved - combination is a 7 dB NRDG at one benefited receptor (14 SHAs). The most difficult combinations to achieve are an 8 dB NRDG at 80% of all benefited receptors, a 10 dB NRDG at 65% of all benefited receptors, and a 10 dB NRDG at 80% of the first-row benefited receptors.
As will be seen, there are issues with the use of all benefited receptors instead of only first-row benefited receptors in the NRDG calculation. Also, as will be seen, there are issues in the reasonableness analysis with the use of benefited receptors of any type instead of impacted receptors.
Cost Effectiveness (CE) is the second of three factors that must be met for a noise abatement measure to be reasonable. This criterion can expressed in terms of cost per benefited receptor (CPBR) or area per benefited receptor (APBR).
CPBR represents the allowable number of dollars per benefited receptor and is calculated by dividing the cost of the noise abatement measure by the number of benefited receptors. APBR represents the allowable barrier area per benefited receptor and is calculated by dividing the area of the noise abatement measure by the number of benefited receptors.
Table 5 shows the CE criteria in SHA policies. It is stated in 23 CFR 772.13(d)(2) that the "highway agency shall re-analyze the allowable cost for abatement on a regular interval, not to exceed 5 years."
The range in CPBR is $20,000 to $71,222. One SHA (NYSDOT) uses 2,000 SF/Benefited Receptor for walls and $80,000/Benefited Receptor for berms and insulation.
Some SHAs use a sliding scale in determining the allowable CPBR for each noise study area along a highway project. Factors that affect or adjust the allowable CPBR include:
As shown in Table 5, the resulting ranges in allowable CPBR for SHAs using a sliding scale are:
Some SHAs also choose to factor in the amount of noise reduction that receptors receive. The resulting CE is typically expressed in terms of CPBR per dB of noise reduction, or CPBR times the amount of noise reduction in dB received by those receptors. In the calculation, as the noise reduction increases, the calculated CE would decrease and the more likely that the calculated value will fall below the criterion, making the abatement measure reasonable by this criterion. The term "insertion loss" is also used to describe the noise reduction provided by the abatement measure.
The resulting CBR values using this approach include:
Comparing these values to the straight CPBR is difficult because the same barrier design (same cost) could result in different noise reductions depending on the receptor locations behind the barrier, and in different numbers of benefited receptors.
By far, the most common abatement measure is the noise barrier wall. One major difficulty in comparing different CPBR values is the fact that the cost of the barrier is dependent on the unit cost used by the SHA. The unit cost, in terms of dollars per square foot (SF), is multiplied by the barrier area to arrive at the total barrier cost. Dealing with changing unit costs can be a challenge for SHAs that are trying to make consistent decisions using their CPBR values.
As indicated in Table 5, a number of SHAs have opted to use APBR instead of CPBR, which eliminates the issues associated with estimating noise abatement costs. Five SHAs use straight APBR values ranging from 1,400 SF/ benefited receptor[3] to 2,700 SF/ benefited receptor.
Two SHAs use a sliding scale for APBR based on similar factors used for the sliding scale CPBRs, in addition to WSDOT, which allows use of either APBR or CPBR:
Table 6 shows the combinations of NRDG and feasibility quantity used by SHAs. For the 38 SHAs that use a 7 NRDG, the range in feasibility quantity is from one impacted receptor to 67% of all impacted receptors and 75% of first-row impacts - a very wide range. Likewise, the range is large for those SHAs using an 8 dB NRDG - from one impacted receptor to 75% of all impacted receptors. The three SHAs that use a 9 dB NRDG use either one or three impacted receptors as the feasibility quantity.
Finally, the range for SHAs using a 10 dB NRDG is from 50% to 80% of impacted receptors. Two of these SHAs use a 10 dB NRDG at 80% of first-row impacted receptors. The SHA that requires 10 dB at one first-row benefited receptor and 7 dB at 50% of all benefited receptors has a feasibility quantity of 75% of all impacted receptors.
Table 7 shows the combinations of benefited noise reductions and feasibility quantities used by the SHAs. For the 45 SHAs that specify a benefited noise reduction of 5 dB, the feasibility quantities range from one impacted receptor to 75% of all impacted receptors (with one SHA using 80% of first-row impacts and 67% of all impacts). This range is very wide.
For the three SHAs that specify a benefited noise reduction of 7 dB, the feasibility quantities are 50% of all impacts, 67% of first-row impacts, and 80% of all impacts.
For the three SHAs with a benefited noise reduction of 8 dB, the feasibility quantities range from one impacted receptor to 80% of first-row impacted receptors, a very wide range.
The SHA that uses a 9 dB benefited noise reduction uses a feasibility quantity of three impacts.
As shown, the most frequent combinations include a 5 dB reduction at one impacted receptor (fourteen SHAs) and a 5 dB reduction at 50% of all impacted receptors (nine SHAs)
Recall that the minimum noise reduction for a receptor to be considered benefited may be as low as 5 dB and may not be higher than the SHA's NRDG.
Table 8 shows the combinations of NRDG and benefited noise reduction used by the SHAs. An "A" means a combination allowed in the regulation that is not used by any SHA. Nearly three-quarters specify an NRDG of 7 dB combined with a benefited noise reduction of 5 dB. In contrast, one SHA uses 9 dB as both NRDG and benefited noise reduction.
Whether or not one combination of these two factors is easier to achieve than another combination depends heavily on the NRDG quantity. For example, achieving 7 dB at 75% of all benefited receptors where 5 dB is the minimum value to be benefited could be more difficult than achieving 9 dB at only one receptor where 9 dB is also the minimum value for being benefited. Table 9 relates these three factors: 1) NRDG; 2) NRDG quantity and benefited noise reduction; and 3) in a similar manner Table 6. The following differences are observed:
An abatement measure is much more likely to be reasonable when the SHA requires a 7 dB NRDG be met at only one benefited receptor when the benefited noise reduction is 5 dB, than when the SHA requires a 10 dB NRDG be met at 80% of first-row benefited receptors when the benefited noise reduction is 8 dB.
Conversely, it may be easier for an SHA to meet a 10 dB NRDG at only one benefited receptor when the benefited noise reduction is 5 dB than for an SHA that needs to meet an 8 dB NRDG at 75% of first-row benefited receptors when the benefited noise reduction is 8 dB.
Table 10 presents the CBPR and APBR criteria used in the SHA policies in terms of the benefited noise reduction criterion, without any normalization based on abatement unit cost. Section 2.1.12 presents the results after normalization.
The most common benefited noise reduction is 5 dB. The corresponding CPBR range is from $20,000 to $71,222 (the maximum for the sliding scale starting at $36,127). All of the SHAs that use a CPBR above $40,000 specify 5 dB as the benefited noise reduction. The three policies using CPBR/dB noise reduction also specify 5 dB as the benefited noise reduction, as do the seven SHAs using APBR.
None of the SHAs specify a 6 dB benefited noise reduction.
The SHAs specifying benefited noise reductions of 7 dB or more all have CPBRs at or below $40,000:
Table 11 presents the CBPR and APBR criteria used by the SHAs in terms of the NRDG, without any normalization based on abatement unit cost. Section 2.1.13 presents the results after normalization.
The most common NRDG is 7 dB. The corresponding CPBR range is from $20,000 to $71,222, as it was for all policies with the benefited noise reduction criterion of 5 dB. All of the policies with a CPBR above $40,000 specify 7 dB as the NRDG. As with the benefited noise reduction criterion, the three SHAs using CPBR/dB Noise Reduction and the seven SHAs using APBR specify a 7 dB NRDG.
The SHAs that specify an NRDG of 8, 9 or 10 dB, all have a CPBR at or below $41,208:
In order to be able to compare and assess the various CE criteria used in the SHA policies, it was necessary to normalize the CPBR by the abatement unit cost used by each SHA in computing barrier costs. In effect, this reduces the CPBRs to APBRs that can be compared between all SHAs.
Table 12 presents the results of this normalization. The second and third columns show the CPBR and unit costs, respectively used by SHAs. The table also shows the APBR values used by several SHAs in bold in the third column. For those SHAs that allow a range of values for the CPBR or APBR, the upper and lower limits of the range are represented by separate rows in the table. Several SHAs do not provide unit costs in their policies and did not respond to follow-up inquiries by the research team. These SHAs are not represented in this table.
What is striking about this normalized data is the very large range for APBR. For SHAs using a 7 dB NRDG, the lowest value is 250 SF/ benefited receptor, which actually represents the low end of a range for one SHA for the case of a residential area built after the initial road and after a September 2005 policy change regarding in-fill development, with a relatively low future noise level and little or no increase from existing to future noise level. The highest APBR value is 2,750 SF/ benefited receptor, over ten times greater than the lowest value. Disregarding the rather special case of the 250 SF value, the second lowest APBR value is 477 SF/ benefited receptor, one-sixth of the highest value. In essence, one SHA allows nearly six times as much area as another SHA in making a decision on barrier reasonableness. The decision would be very different for the same project under these two policies. It is important to reiterate that CE alone does not dictate the reasonableness decision. The NRDG must also be met.
The range described above for SHAs with a 7 dB NRDG are not quite as large, but still substantial, for 8 and 9 dB NRDG values:
The range for the 10 dB NRDG is small - only 916 to 1,000 SF/benefited receptor.
Figure 1 shows a histogram of the normalized APBRs and actual APBRs, including the low and high values for policies with variable costs.[4] The graph illustrates the range in APBR from 250 to 2,750 SF/ benefited receptor. It also shows the predominant values centered between 800 and 1,600 SF/ benefited receptor. Yet, the CPBR corresponding to these values vary substantially depending on the abatement unit cost used by an SHA, which would result in widely disparate decisions for the same noise analysis area.
The actual costs per benefited receptor used in the SHA policies range from a low of $20,000 to a high of $71,222. The variable costs depend on parameters such as whether or not a residential development preceded the highway construction, the amount of the sound level increase over the existing case, or the absolute future sound level. Also note that one SHA (NYSDOT) uses an area criterion of 2,000 SF/benefited receptor for noise barrier walls. It uses a cost criterion of $80,000 per benefited receptor for installation of an earth berm or sound insulation of an impacted property.
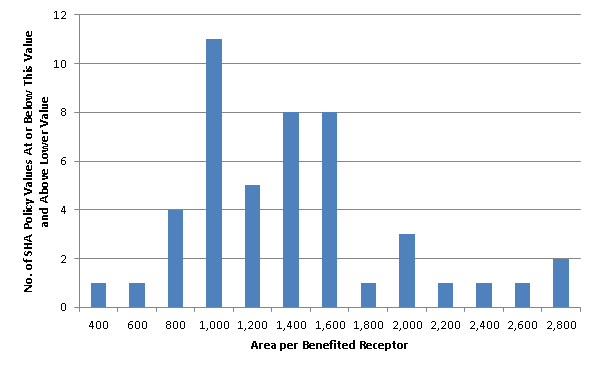
| 400 | 1 |
|---|---|
| 600 | 1 |
| 800 | 4 |
| 1000 | 11 |
| 1200 | 5 |
| 1400 | 8 |
| 1600 | 8 |
| 1800 | 1 |
| 2000 | 3 |
| 2200 | 1 |
| 2400 | 1 |
| 2600 | 1 |
| 2800 | 2 |
| 3000 | 0 |
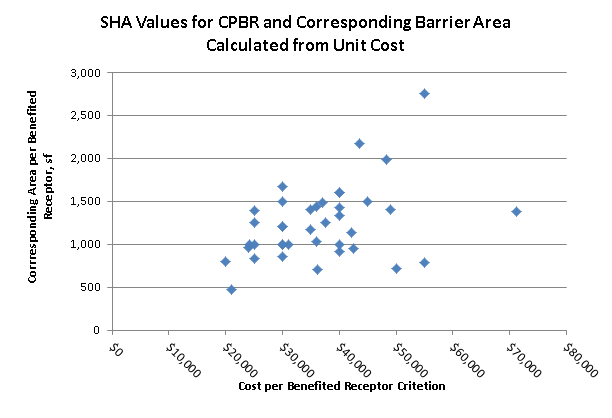
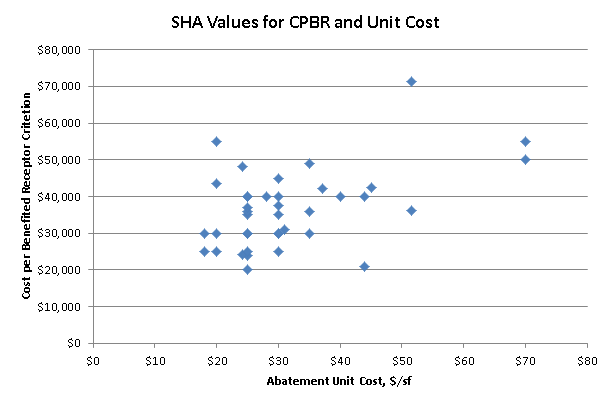
Figure 2, Figure 3, and Figure 4 are scatter plots showing the relationships between CPBR, APBR, and unit cost. Each point represents a pair of values for a particular SHA's policy. For those policies with a sliding scale, there are separate points for the low and high ends of the scale.
Figure 2 graphs the CPBR and the corresponding APBR calculated from the SHA's unit cost. This figure illustrates how policies with very similar CPBRs - such as in the $50,000 to $60,000 range - can have widely varying allowable areas - from approximately 700 to 2,750 SF/ benefited receptor. SHAs in this grouping could expect to come to very different decisions on the CE reasonableness factor despite the similar cost criteria because their resulting allowable areas are so different. It also shows how SHAs can have very similar allowable barrier areas - for example, around 1,400 SF/benefited receptor - yet have widely varying CPBRs, ranging from $25,000 to over $70,000. SHAs in this latter grouping could expect to come to similar decisions on this reasonableness factor despite the cost criteria differing by a factor of nearly 3.
Figure 3 plots the SHAs' CPBR values against their corresponding unit costs. The graph shows how SHAs with similar unit costs can end up with widely varying CPBRs. For example, for a unit cost of $20.00/SF, the CPBR range is $25,000 to $55,000. Those SHAs with the low CPBRs for any given unit cost would be much less likely to reach a favorable decision on abatement than those SHAs with high CPBRs.
Conversely, there are SHAs with very similar CPBRs, yet their unit costs vary widely. For example, two SHAs with a CPBR criterion around $50,000 have unit costs of $25/SF and $70/SF. The higher the unit cost per given CPBR the less likely that a favorable decision will be reached on barrier reasonableness.
Figure 4 graphs the allowable barrier area calculated from the unit cost against the unit cost itself. As one moves toward the upper left-hand portion of the graph, the likelihood of a barrier being reasonable increases (a higher allowable area at a lower unit cost). As one proceeds to the lower right-hand corner portion of the graph, it is less likely that a positive decision on barrier reasonableness would be reached (a low allowable area at a high unit cost).
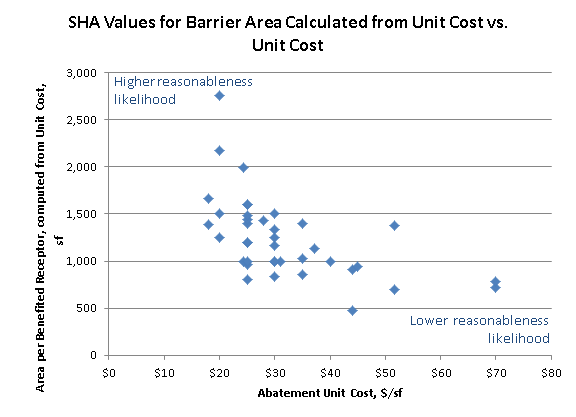
Table 13 presents the combinations of APBR and the benefited noise reduction in dB. The first three columns are the same as the previous table.
For a 5 dB benefited noise reduction criterion, the range in APBR is the full extent of the table - from 250 SF/benefited receptor to 2,750 SF/benefited receptor.
The range for the 7 dB benefited noise reduction is much smaller - 1,000 to 1,600 SF/ benefited receptor. For 8 dB, the range is even less - only 1,500 to 1,667 SF/ benefited receptor.
As already stated in the previous subsection, the large range in APBR will result in widely differing decisions on reasonableness for a given situation.
Focusing on an APBR of 1,500 SF/ benefited receptor, the benefited noise reduction criterion ranges from 5 to 8 dB. The higher the benefited noise reduction criterion, the fewer benefits there would be for a given barrier design. As the number of benefits decreases, the calculated APBR increases, making it less likely to meet the APBR criterion. The final decision on reasonableness would also depend on the NRDG criterion and the required number or percentage of benefited receptors meeting the NRDG.
This section examines the feasibility and reasonableness factors used in the SHA noise policies.
The feasibility noise reduction is 5 dB in all of the SHA polices.
The number or percentage of impacted receptors required to meet that reduction varies substantially, from only one impacted receptor to 80% of all impacted receptors. Roughly one-third of the SHAs specify a minimum number of impacted receptors, ranging from 1 to 3. Two-thirds of the SHAs specify a minimum percentage of impacted receptors for feasibility: nineteen SHAs use a percentage of all impacted receptors, while fifteen use a percentage of only the first-row impacted receptors. The range for the former group is from 40% to 80% of all impacted receptors. For the latter, the range is from 50% to 80% of first-row impacted receptors, and includes one SHA that specifies 80% of first-row impacted and 67% of all impacted. The consequences of the differences in the feasibility quantity could be substantial.
There is a wide variation in the reasonableness abatement evaluation factors.
The benefited noise reduction criterion - the amount of noise reduction needed to count a receptor as benefited - ranged from 5 to 10 dB, with 45 SHAs using 5 dB. A receptor is counted as benefited whether or not it is impacted.
The values used for the NRDG range from 7 to 10 dB, the full extent of values allowed by the regulation. Nearly three-quarters use 7 dB. One SHA specifies 10 dB at one benefited receptor and 7 dB at 50% of all benefited receptors.
Twenty-four SHAs specify a minimum number of benefited receptors that must meet the NRDG criterion; of those, twenty-one use one benefited receptor, two specify one first-row benefited receptor, and one specifies meeting a 10 dB NRDG at one benefited receptor and a 7 dB reduction at 50% of all of benefited receptors. Twenty-eight SHAs specify a minimum percentage of benefited receptors; of those, eight apply the NRDG to only the first-row benefited receptors and the rest apply the percentage to all benefited receptors. The easiest percentage to achieve is 10% of the first-row benefited receptors; the most difficult is 80% of all benefited receptors.
By far the most common pairing of NRDG and NRDG quantity is the one most easily achieved: 7 dB at one or more benefited receptors, which is specified by sixteen SHAs. Five other SHAs pair the single benefited receptor with NRDG values of 8, 9 or 10 dB. The next most common pairing is an NRDG of 7 dB with a percentage of all benefited receptors that is in the range of 40% to "greater than 50%," used by ten SHAs. Two others use a 10 dB NRDG with a percentage in the same range.
The four most difficult combinations to achieve are: 10 dB NRDG at 80% of the first-row benefited receptors; 7 dB at 75% of all benefited receptors; 8 dB at 80% of all benefited receptors; and 10 dB NRDG at 65% of all benefited receptors.
The pairings of NRDG and the NRDG quantity also have to be viewed in terms of the minimum noise reduction for a receptor to be counted as benefited. Thirty-six of the SHAs pair an NRDG of 7 dB with a benefited noise reduction of 5 dB. While fifteen of these SHAs require the goal to be met at only one benefited receptor, three of them require 67% to 80% of all benefited receptors. The most-difficult-to-achieve parings would appear to be: a 10 dB NRDG at 80% of first-row benefited where 8 dB is required for a receptor to be benefited; an 8 dB NRDG at 75% of first-row benefited receptors with a benefited noise reduction of 8 dB; and a 9 dB NRDG for 25% of all benefited receptors when the benefited noise reduction is 9 dB.
The five SHAs that specify a 10 dB NRDG and a benefited noise reduction of 5 dB require the criterion to be met at as little as one benefited receptor to up to as many as 65% of all benefited receptors. The most difficult to achieve pairing would be the use of 9 dB for both NRDG and benefited noise reduction (one SHA) or a 10 dB NRDG with a benefited noise reduction of 8 dB.
The cost-effectiveness criterion is expressed by most states in terms of CPBR. Some SHAs use CPBR per decibel of noise reduction achieved, which allows higher barrier costs to be reasonable for barrier designs that provide greater amounts of noise reduction. The calculation of this CPBR is dependent on the unit cost for the abatement measure, typically expressed in dollars per square foot of barrier surface area. The unit costs vary substantially across the SHA policies - from $18/SF to $70/SF. The CPBR values likewise vary - from $20,000 per benefited receptor to $71,222 per benefited receptor. The ability to compare different CPBRs is clouded by the unit costs used in their derivation. Also, as unit costs vary, SHAs are faced with the need to reconsider and revise their CPBR criterion if they wish to maintain consistent decision-making on barrier cost-effectiveness. Seven SHAs avoid these problems by using APBR as the cost-effectiveness measure, as allowed in the regulation. The range in allowable APBR is also substantial - from 250 SF/ benefited receptor to 2,700 SF/ benefited receptor.
To compare the CPBR and APBR criteria, the CPBR were normalized into APBR-equivalents by dividing by the SHAs' unit costs. The range increased to 250 to 2,750 SF/ benefited receptor.
When APBR is viewed by NRDG, the widest variation in APBR is for the 7 dB NRDG: from a low of 250 SF/ benefited receptor to a high of 2,750 SF/ benefited receptor. For an 8 dB NRDG, the APBR varies from 857 to 1,500 SF/ benefited receptor. For 9 dB, the range is from 1,029 to 1,667 SF/benefited receptor. For the 10 dB NRDG, the range is small: only 916 to 1,000 SF/ benefited receptor.
This section examines various combinations of values for the feasibility and reasonableness criteria factors. The previous section detailed how the SHAs have actually combined the factors in the criteria in their policies. In the process, that analysis revealed a wide range of combinations in practice. These widely varying combinations, in turn, are likely to result in very different decisions for the same highway project and adjacent development on the reasonableness of abatement measures and possibly on their feasibility.
It is useful to examine the underlying factors that affect the criterion values. These underlying factors include:
The number of impacted receptors is used in the feasibility noise reduction determination, either in only the first-row or in all rows. A receptor's sound level, and thus the likelihood of being impacted, depends on:
The number of impacted receptors obviously also depends on the overall number of receptors available to be impacted and their distribution between the first-row and subsequent rows, if any. Because of the inverse effects of distance, number of intervening rows of houses, and density of those rows on sound level, second-row impacts are much less likely than first-row impacts and third- row (or more) impacts are typically very unlikely.
The percentage of impacted receptors meeting the feasibility noise reduction criterion depends on the number of impacts, the policy choice of first-row or all rows, and possibly the number of impacts in each row.
In general, if the scenario involves impacts beyond the first-row, it is more difficult to meet a given noise reduction at a given percentage of all the impacted receptors than at the same percentage of just the first-row impacted receptors. The reason is that, in general, the noise reduction provided by a barrier decreases as the receptor distance from the barrier increases (e.g., as one moves from the first-row to the second row or beyond). However, in most cases the majority of the impacts are in the first-row, and in many cases impacts do not extend beyond the first-row.
Also, for the low range of numbers used by the SHAs (one to three receptors), it is much easier to meet a specified minimum number than a specified percentage because use of a percentage will usually result in a greater number of impacted receptors at which the criterion must be met.
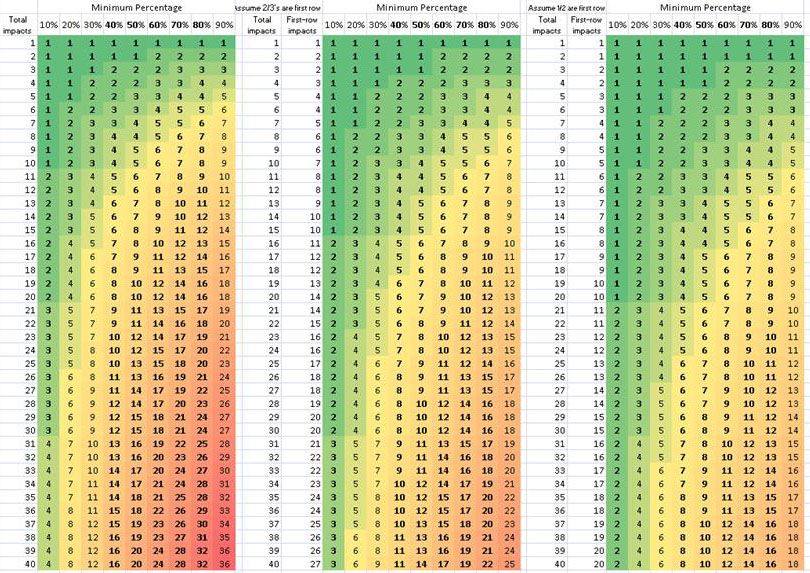
Figure 5 shows the relationship between the minimum number, the minimum first-row percentage and the minimum percentage of all impacts for a range of total impacts from 1 to 40 receptors. The left portion of the chart assumes all of the impacts occur in the first-row. The center portion of the chart assumes two-thirds of the impacts occur in the first-row. The right portion assumes half of the impacts occur in the first-row. Across the top are percentages from 10% to 90%. The numbers for range of percentages used by the SHAs (40% to 80%) are in bold. The color-shaded numbers are the number of impacted receptors needed to meet the criterion specified by the percentage.
For example, if an SHA uses a criterion of 80% of all impacted receptors and there are 40 impacts, the bottom row of the left portion of the chart shows that feasibility noise reduction value would have to be met at 32 or more of the 40 impacts. If the criterion was 80% of first-row impacts and half of the impacts were first-row, then the receptors feasibility noise reduction would have to be met at least 16 of the 40 impacts (80% of half of 40). The potential barrier design for these high numbers of impacts will be much different than for exactly the same highway and receptor scenario in which an SHA's criterion is only one impacted receptor.
The noise reduction provided by an abatement measure is used in the determination of feasibility. It is also used to determine which and how many receptors are benefited, and, hence, if the NRDG and CE criteria will be achieved. The CE criterion is in terms of CPBR or APBR.
The noise reduction is a function of:
The following relationships generally hold true:
The number of benefited receptors depends on the noise reduction at each receptor, the benefited noise reduction criterion, and the number of receptors available to be benefited. The NRDG may also affect the number of benefited receptors: for example, as NRDG increases, the needed height to meet it will increase, which can result in more receptors meeting a given benefited noise reduction.
The percentage of benefited receptors meeting the NRDG depends on the noise reduction at each receptor, the number of benefited receptors, the policy choice of first-row or all rows, and possibly the number of benefited receptors in each row.
While the number or percentage of impacted receptors will not change as the barrier design changes, the number and percentage of benefited receptors most likely will change , meaning that achieving the NRDG criterion (especially percentage-based) is a dynamic process. This dynamic nature complicates the design process, compared to designing based on impacted receptors, especially if the percentage is based on all benefited receptors instead of only first-row benefited receptors.
For example, if the NRDG is percentage-based and increasing the barrier height increases the number of benefited receptors, then the number of receptors needing to meet the NRDG will increase. However, the barrier height increase may not result in enough additional noise reduction to move more receptors above the NRDG. Additionally, the barrier surface area and cost will increase. If the number of benefited receptors meeting the NRDG does not increase enough, the NRDG may not be met.
The end result could be that in the process of increasing barrier height - and providing more noise reduction to the more seriously impacted receptors - a barrier may become less likely to meet the NRDG. This result is counter-intuitive and counter to the goal of protecting impacted receptors.
SHA noise policies contain wide variations in their definitions of NRDG. For example, many SHAs require only a single receptor to receive a 7 dB reduction while one SHA requires that 80% of the benefitted receptors receive at least an 8 dB noise reduction. This large disparity could result in very different decisions for the same situation.
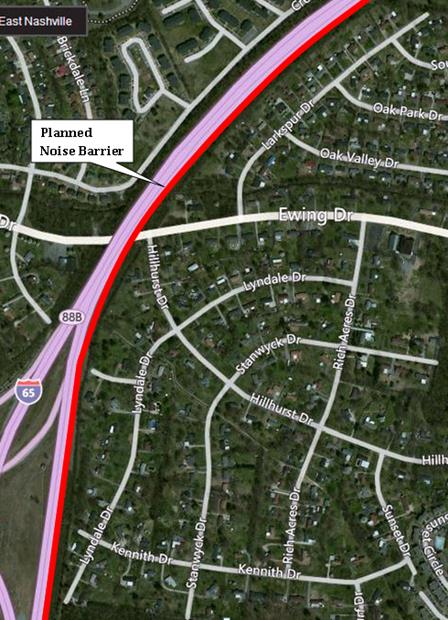
Consider the high density single-family neighborhood along a section of interstate shown in Figure 6. The interstate is on a fill through most of this area. As a result, the 5 dB noise reduction contour extends several hundred feet back into the neighborhood and includes at least three rows of homes in most locations.
A 6,000-foot long noise barrier averaging 12.5 feet in height for this neighborhood was determined to meet the NRDG in the SHA's noise policy which required 7 dB at 60% of the benefited first-row residences. The NRDG was met since 100% of the first-row residences will receive 7 or more dB of noise reduction from the barrier.
An analysis was then completed to determine if the barrier would still meet the NRDG if the SHA's noise policy required 8 dB at 80% of the all benefited residences. The results are summarized in Table 14.
As shown, a barrier that provides 8 dB for the first-row residences would result in a total of 115 benefits. However, the vast majority of these benefited residences is in the second and third rows, receiving noise reductions between 5 and 7 dB, which is typical for second and third row locations. However, only 40 of the 115 benefited residences are receiving noise reductions of 8 or more dB, representing only 35% of the total benefited residences. This example illustrates the issue associated with setting a NRDG that requires a high percentage and also includes all benefited residences in the calculation.
Now imagine that only the first-row of houses exists in this neighborhood. In this situation, there would be 39 benefited residences and 33 of them would receive noise reductions of 8 or more dB, representing 85% of the total benefited residences. Therefore, the NRDG would be met.
Additionally, a noise barrier for the neighborhood would likely meet the CE criteria in most SHA policies, while a noise barrier would be much less likely to be cost effective if there were not second and third row benefited residences.
Should different decisions result from these two cases? Both neighborhoods are impacted, with sufficient density of residences, and the barriers are clearly reasonable for all but this one criterion. Should the inclusion of additional rows of residences mean that the first row is any less deserving of abatement, especially when many of the residences beyond the first row receive benefits from the barrier? Acknowledging that FHWA gave the discretion and autonomy to each SHA (with FHWA approval) to determine its own reasonableness and feasibility criteria for noise abatement, this particular example points to a problem with the use of a reasonableness criterion based on percentage of all benefits.
Barrier cost is one of the key components of the CE criterion for reasonableness, the other being the number of benefited receptors. Barrier cost is computed from barrier surface area multiplied by barrier unit cost, where barrier surface area is the product of height and length.
CPBR is computed by dividing barrier cost by the number of benefited receptors. APBR is computed by dividing barrier area by the number of benefited receptors.
These relationships hold:
Table 15 lists the various factors and their components used in the feasibility and reasonableness evaluation of an abatement measure. The table then indicates how the likelihood of a positive decision on the abatement measure would change based on the stated change in that factor. The change assumes other factors remain the same.
Table 16 presents the expected direction of the outcome of a decision on a barrier - more or less likely to be positive - as a function of the magnitude (low or high) of each factor in the feasibility and reasonableness criteria.
Table 17 and Table 18 then present different combinations of high or low values for the various factors that would be more likely to result in a negative or a positive decision on abatement.
Not shown is the case of when the benefited noise reduction equals the NRDG. In this case, the type and values of the NRDG quantity (number of benefited receptors, percentage of first-row benefits or percentage of first-row benefits) do not matter. If a receptor meets the benefited noise reduction, it therefore also meets the NRDG. Thus, 100% of all benefited receptors (first-row or otherwise) will always meet the NRDG by that fact that the two level reduction criteria have the same value.
This chapter examines the range in values for the noise abatement feasibility and reasonableness criteria used in the various SHA noise policies, both individually and in combination. It also examines the relationships between these factors in a qualitative fashion.
One outcome is the realization that when benefited noise reduction in dB is equal to the NRDG in dB, the NRDG quantity is irrelevant- by definition of the equal values, 100% of all benefited receptors will meet the NRDG.
One other important outcome is that the use of a CPBR for the CE reasonableness criteria is problematic. The meaningfulness of the value for the criterion depends entirely on the unit cost of abatement used in determining the total abatement cost of a proposed abatement measure. Two SHAs with identical CPBR criteria will reach different decisions on reasonableness if one uses a low unit cost resulting in a low CPBR while another uses a high unit cost, resulting in a high CPBR, which would be more likely to exceed the allowable amount.
The normalization of the CPBR into a barrier surface area in square feet per benefited receptor by dividing by the unit cost eliminates the variability between different SHAs' policies introduced by varying unit costs. This normalization was necessary in this study to allow comparison of different CE criteria.
Two comments do need to be made on the variation in unit costs and CPBR:
Some SHAs use an APBR directly in their policies. In the revision of its noise policy, PennDOT decided to use an area-based criterion (which it called MaxSF/BR). PennDOT identified the following advantages associated with its use,[6]which are worthy of consideration by FHWA and other SHAs:
TDOT and NCDOT use sliding scale forms of APBR which involve the calculation of an APBR for each study area based on the different factors.
This chapter also examines the factors that influence the criterion values for feasibility and reasonableness. The results highlight the disparities that can occur based on the different SHA requirements for noise reduction. It is important to point out that FHWA gave the discretion and autonomy to each SHA (with FHWA approval) to determine its own reasonableness and feasibility criteria for noise abatement. Part of the problem is that the SHAs did not have the benefit of research such as that presented in this report to test or see the implications of their decisions on the criteria. Regardless, it may now be beneficial for the FHWA to establish certain limitations on such criteria so that the range of disparities is not as great.
One key feasibility factor is the quantity (either number or percentage) of impacted receptors. Of particular importance is whether the criterion is based on only first-row or all impacted receptors. In general, if the scenario being studied involves impacts beyond the first-row, it is more difficult to meet a given percentage at all of the impacted receptors than at just the first-row impacted receptors.
Another important factor for both feasibility and reasonableness is the amount of noise reduction provided to receptors. Noise reduction depends on many factors, key of which are barrier height and length and distances from the road to the barrier and the barrier to the receptor.
A critical factor for reasonableness is the quantity of benefited receptors, both for the NRDG and CE criteria. For NRDG, it is especially critical when that quantity is expressed as a percentage of all benefited receptors needed to meet the NRDG. As the barrier design changes, the number of benefited receptors can change, assuming that one is doing a design based on the NRDG. Some SHAs design based on the feasibility criterion, which is a function of impacted receptors, even though the feasibility noise reduction is limited in the regulation to 5 dB. The goal is to use the feasibility criterion as a mechanism for trying to provide some abatement to all impacts, while using the NRDG to lead to a design that provides greater noise reductions for some of the benefited receptors.
The more typical or traditional interpretation has been that feasibility analysis is simply a screening prior to reasonableness analysis, where the designing occurs. Thus, the number of benefited receptors is identified during the reasonableness analysis. In such a case, with an NRDG criterion based on a percentage of all of the benefited receptors, the minimum number needed to meet the criterion becomes a moving target, changing as the design changes. Additionally, as the design changes, the total needed cost or area will change.
Basing the NRDG criterion on the percentage of all benefited receptors can result in counter-intuitive results, such as where a barrier that is reasonable when only one row of houses is present becomes not reasonable when additional rows of houses are introduced even though the noise reductions to the first-row houses do not change. A strong case can be made for basing the NRDG on a percentage of impacted receptors, or, less desirable, a percentage of the benefited first-row residences.
This chapter also provided guidance on the expected likelihood of a barrier as the key factors increased or decreased in value individually, as well as for high and low values of pairs of factors.
[1] In the ensuing discussions, the term "impacts" is sometimes used as a shorter form of the term "impacted receptors." Likewise, the term "benefits" is sometimes used to mean "benefited receptors."
[2] Yellow shading will be used in all similar tables to highlight that the value or combination of values occurs in one or more SHA policies, with the number of policies also indicated.
[3] Florida DOT uses 1,400 SF as a basis and multiplies this value by its current unit cost of $30/SF to get a CPBR of $42,000 for use in reasonableness evaluations.
[4] The bin values for APBR represent all values above the previous bin up to the bin value. For example, there are 10 samples with a value greater than 800 and less than or equal to 1,000.
[5] Note that the word "likelihood" is broader in meaning in this report than the specific "Statement of Likelihood" called for in the noise regulation after a positive decision on an abatement decision has been reached.
[6] Development of PennDOT Feasibility and Reasonableness Criteria, Working document, PennDOT, September 15, 2010.