In this chapter, the results of the findings of Chapter 2, for the four studied feasibility and reasonableness factors, were tested by performing a sensitivity analysis. The purpose was to identify outcomes of possible combinations of factors and apply the combinations in a sampling of existing highway projects with abatement.
As has been seen, there are a wide variety of combinations of the various factors in the reasonableness criteria. The previous chapter examined them and their relationships in a qualitative fashion. This section presents a more quantitative and analytical examination in the form of a sensitivity analysis.
In order, four factors were studied:
Ranges were defined for these factors, and the various resulting combinations were identified. Several scenarios were then developed and modeled with the FHWA Traffic Noise Model Version 2.5 (FHWA TNM) noise prediction program, which is specified in the regulation for use on federal and federal-aid highway projects.
The results of these modeling cases were then applied to the combinations of the factors to determine the resulting decision on reasonableness. For a barrier to be reasonable in this analysis,
The ranges in the factors were as follows:
The percentage ranges for both the first-row and all receptors were derived from the ranges in values in the SHA policies. The APBR values were also based on the ranges in the values used by the SHAs in their policies.
Use of the above values for these different factors resulted in 1,080 different criteria combinations to be analyzed.
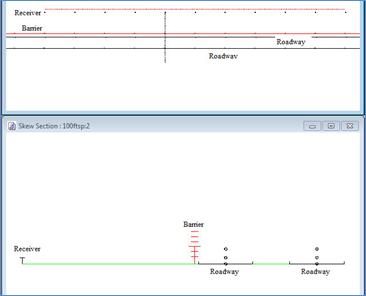
In order to study these combinations for a variety of receptor scenarios with FHWA TNM, a four-lane divided highway model was created. The basic scenario consisted of two travel lanes in each direction. Each travel direction was modeled by a single FHWA TNM roadway with a width computed based on two travel lanes and paved shoulders, not by a FHWA TNM roadway for each travel lane. The difference was not felt to be significant for the purposes of this study. See Figure 7 for a plan view (from above) and a cross-sectional view of the roadway and noise barrier portion of the model.
Each FHWA TNM roadway carried 3,600 vehicles per hour per direction. The traffic was divided into 88% automobiles (3,168 veh/hr), and 12% trucks (two-thirds heavy trucks (288 veh/hr) and one-third medium trucks (144 veh/hr)). The travel speed was 65 miles per hour.
The noise barrier was located at the edge of the shoulder.[8] "Lawn grass" ground cover and a flat site (elevation of 0 feet and no roadway grade) were assumed, with a grassy median between the two directions of travel. For each of the cases, a range of six barrier heights was examined: 6, 10, 14, 18, 22, and 26 feet.
Several receptor scenarios were modeled:
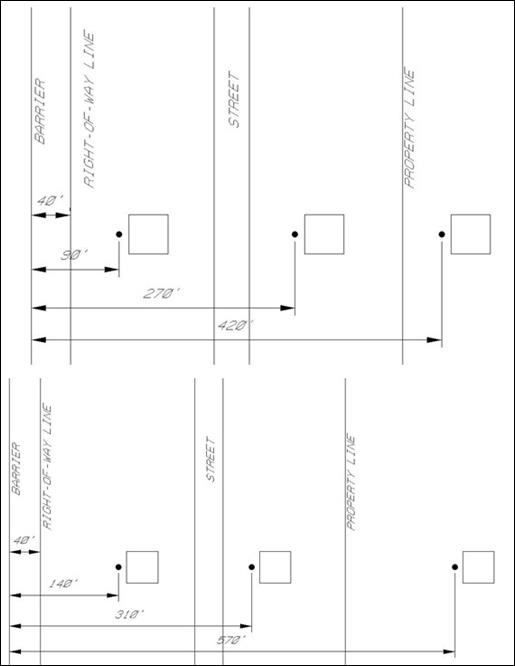
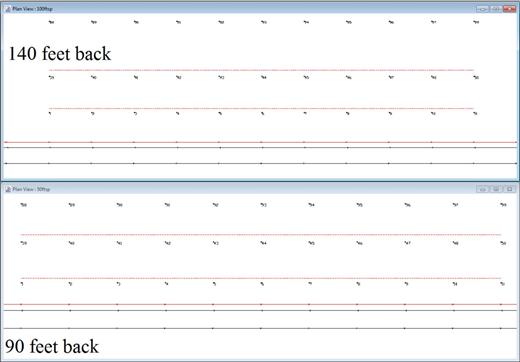
Figure 8 shows that two different distances back from the barrier to the first-row of receptors were used. The assumption was that the barrier was located on the edge of the roadway shoulder and that there was 40 feet of right-of-way space from the barrier to the property line. The distances were:
Eleven FHWA TNM receiver points[9] per row were placed at 200-foot spacing along a line parallel to the roadway over a distance of 2,000 feet. Figure 9 shows the receiver portion of the FHWA TNM model. In the analysis, each receiver was assigned to represent:
In each case, levels were calculated at only eleven FHWA TNM receiver points per row.
The shielding provided by the rows of houses was modeled in FHWA TNM by placing a TNM "building row" object between the first and second and between the second and third rows of receptors. The building row blockage percentages for the three receptor spacings of 50, 100, and 200 feet were chosen as 40%, 60% and 80%, respectively.
Thus, a total of 108 scenarios were studied (3 receptor spacings x 3 building row cases x 2 distances back from the barrier x 6 barrier heights). The result of examining the 1,080 combinations of reasonableness parameters for these 108 cases yielded a total of 116,640 decisions on barrier reasonableness.
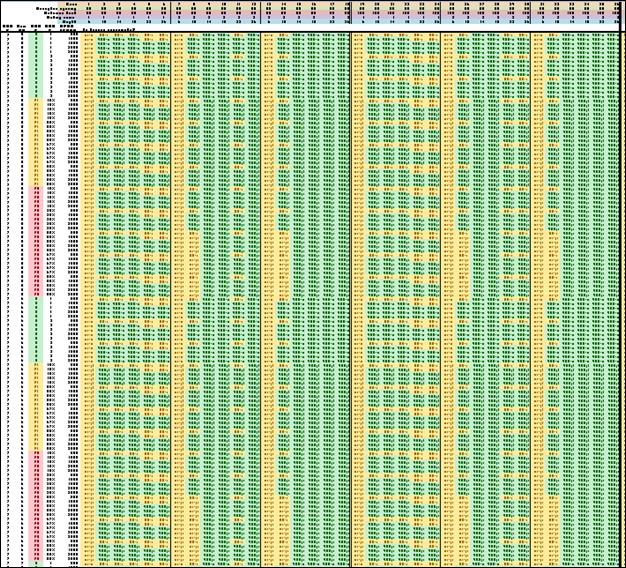
These results of being reasonable or not being reasonable were arrayed in a color-coded spreadsheet of 1,080 rows by 108 columns, capable of being sorted by different factors. The goal was to be able to use this array to see the trends that emerge in the patterns of the decisions. It was a challenge to display this entire array in report format in a meaningful way, although the resulting series of charts should be useful. The spreadsheet developed for this analysis is available as a deliverable for this task. Some examples of the contents and how they can be used are illustrated below, followed by presentation of the array and discussion of the broader findings.
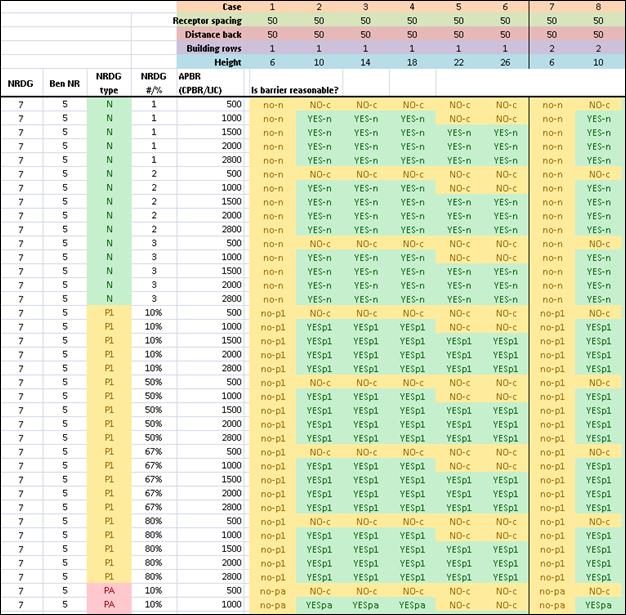
Figure 10 shows a very small portion of the upper left corner of the spreadsheet. The first five columns represent the reasonableness factors being varied. The rows are sorted first by NRDG, then by benefited noise reduction, then by NRDG type, then by value for the NRDG type, and finally by APBR. For all of the rows shown in this example, the NRDG is 7 dB and the benefited noise reduction is 5 dB. The NRDG type has one of three codes:
The top rows indicate the scenarios being studied:
Then, the green and yellow cells at the intersection of a row (combination of criterion factors) and a column (the scenario being studied) indicate the reasonableness decision of Yes or No, respectively. These answers are further coded by the deciding factor: i.e., number or percentage of receptors (-n, -p1, -pa) or APBR (-c).
Even in this small portion of the array, trends start to emerge. A 6-foot high barrier was shown to be reasonable for none of the combinations of factors (no receptors had a noise reduction at or above the 7 dB NRDG). Also, in none of the cases shown was a barrier reasonable for an APBR of 500 SF/benefited receptor, regardless of the barrier height (there were too few benefited receptors for these six one-row cases and two two-row cases, even at 50-foot spacing to achieve an APBR that low).
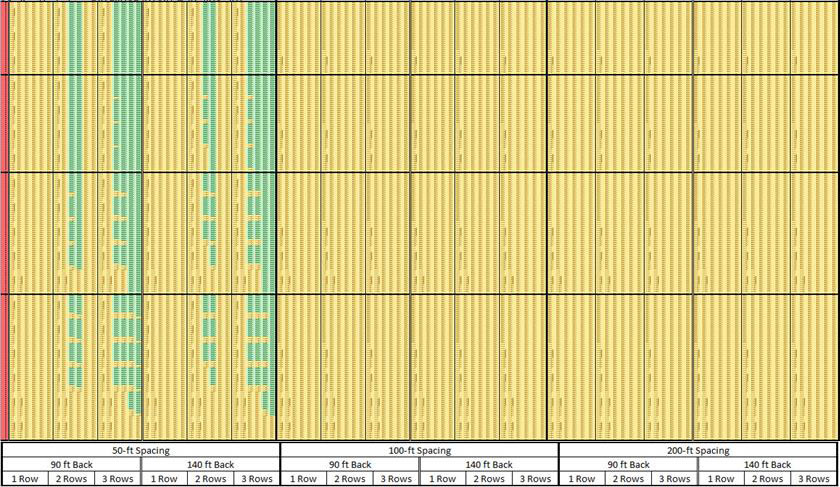
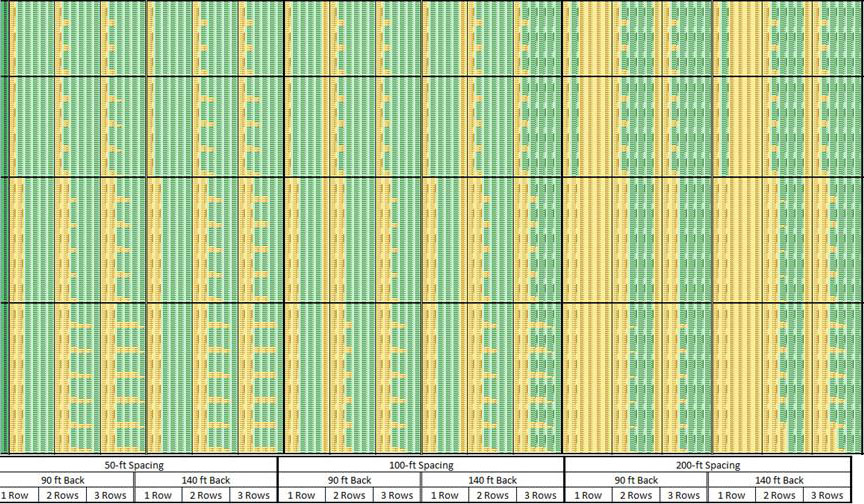
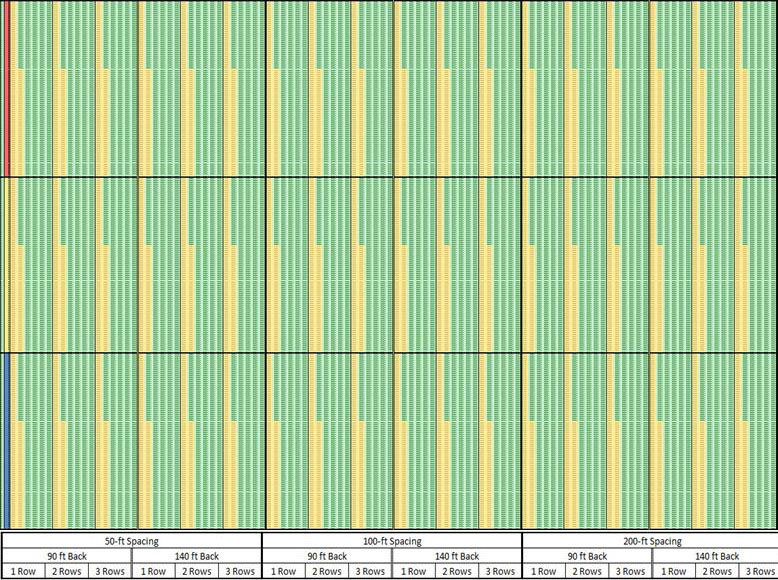
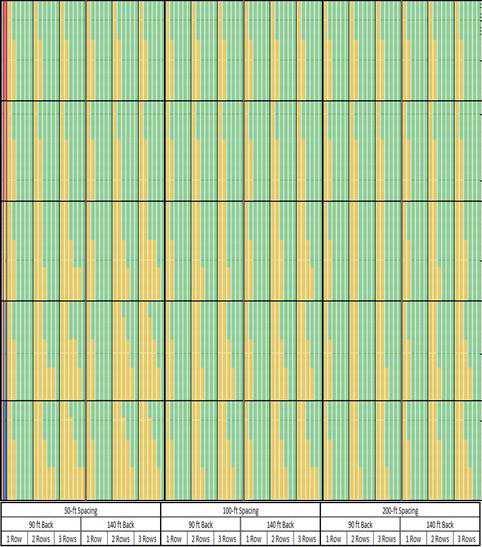
As a second example, Figure 11 shows the result of zooming out farther for the upper left corner of the decision array. The characters are not meant to be readable in this example, but the colored patterns will be discussed. The figure shows six major blocks of columns of decisions; these are all for the 50-foot receptor spacing. The first three blocks of columns are for the 50-foot distance back for cases of one, two, and three rows of houses, respectively. Then, the second three blocks of columns are for the 100-foot distance back for one, two, and three rows of houses, respectively. Within each block are columns for each of the six barrier heights.
Not shown, the array has another set of six blocks of columns to the right for the 100-foot receptor spacing, and then six more blocks for the 200-foot receptor spacing.
The rows shown in this figure are for all of the combinations with an NRDG of 7 dB and benefited noise reductions of first 5 dB and then 6 dB. Results for NRDG of 7 dB and benefited noise reduction of 7 dB would be below these results, followed by the combinations for NRDG values of 8, 9 and 10 dB.
Trends can, again, be seen:
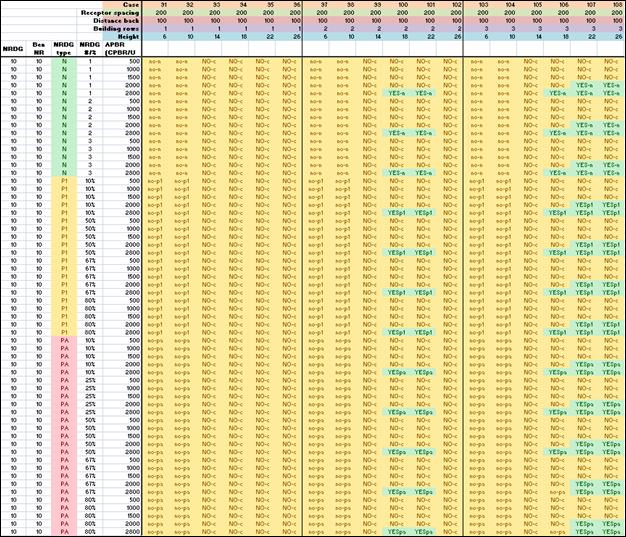
As a third example, Figure 12 shows a very small portion of the lower right corner of the array, representing all of the combinations of factors for a high NRDG of 10 dB and a high benefited noise reduction of 10 dB. The three major blocks of columns of decisions are all for the 200-foot receptor spacing and the 100-foot distance back. The first block is for one row of houses, the second for two rows, and the third for three rows. Within each block are columns for each of the six barrier heights. For the 200-foot spacing with these high values of NRDG and benefited noise reduction, very few cases are reasonable:
The above three examples illustrate the content and use of the decision array in its original format, sorted by NRDG. There are many ways that the array can be manipulated and sorted. Following are the results of two sorts, each of which provides a broad picture of how the reasonableness decisions are affected by parameter changes. These two sets of figures could be used by an SHA to access potential effects of policy changes. The spreadsheet containing the array will be made available as one of the tools developed in this research, which are presented in a separate report.
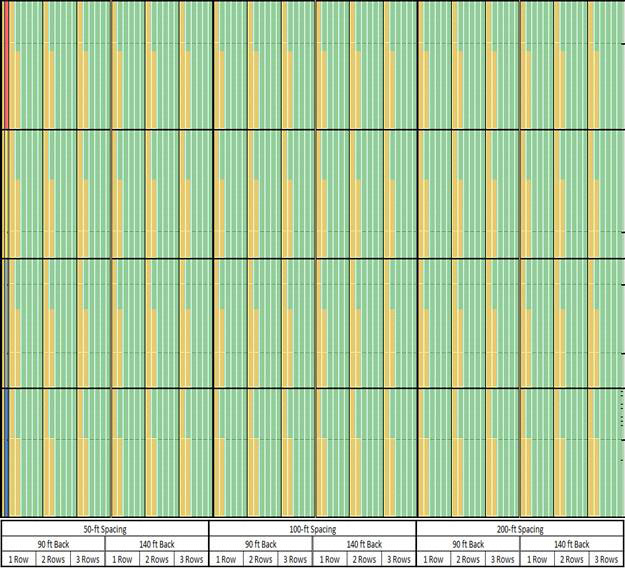
One desired outcome of this research was an understanding of the sensitivity to the NRDG value and the quantity (number or percentage) of benefited receptors needing to meet the NRDG. The array was re-run taking APBR out of the decision process, and then sorted by the NRDG quantity. The next three figures present the results. The data are not meant to be read; the patterns of the color shading are what are of importance: green means abatement is reasonable; yellow means it is not reasonable.
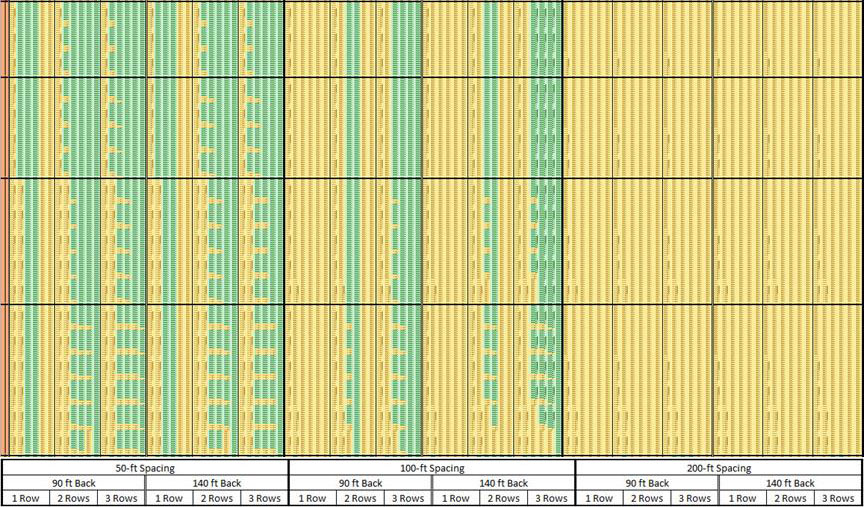
Figure 13 is for the needed number of benefited receptors (N) and is divided into three horizontal sections for values of 1, 2, and 3. Each horizontal section is further divided by NRDG, which is further divided by benefited noise reduction (and further by APBR, which is not varied but was not easily removed from the array).
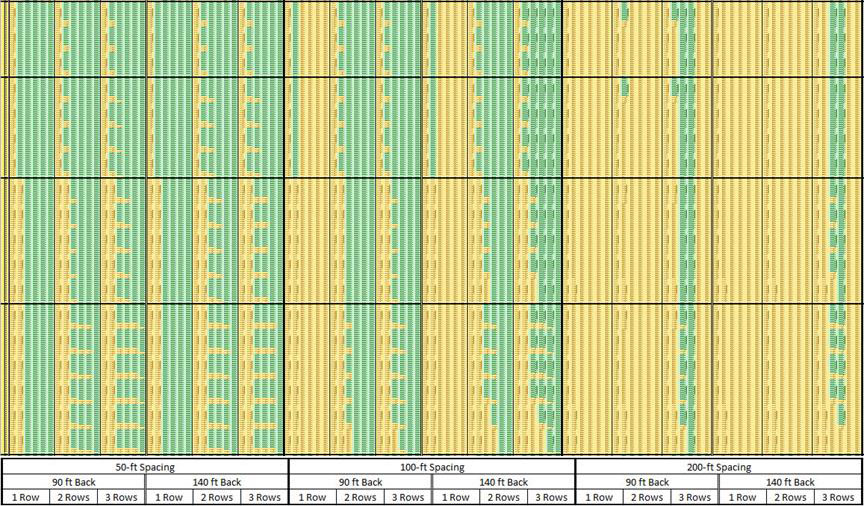
Figure 14 is for the needed percentage of first-row benefited receptors, divided into four horizontal sections for values of 10%, 50%, 67%, and 80%, with the above subdivisions by NRDG and benefited noise reduction.
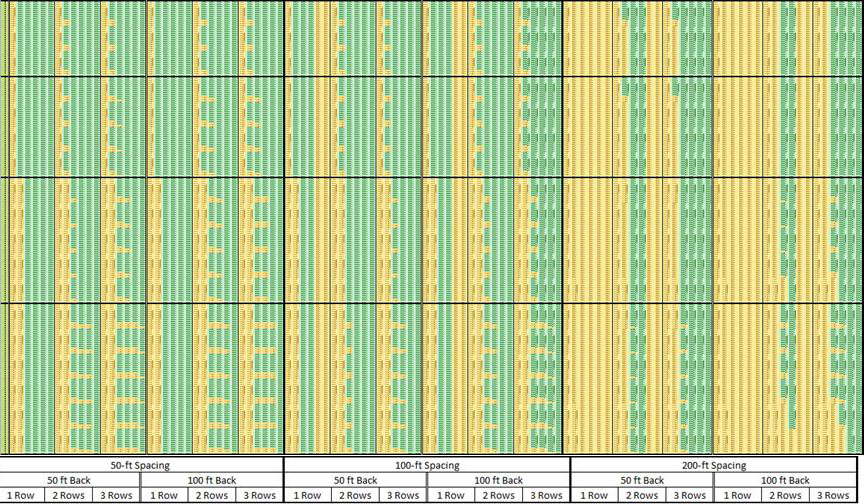
Figure 15 is for the needed percentage of all benefited receptors, divided into five horizontal sections for values of 10%, 25%, 50%, 67%, and 80%, with the above subdivisions by NRDG and benefited noise reduction.
As illustrated and discussed for the three previous examples, each figure is divided into three major vertical sections of decisions for: 50-foot receptor spacing, 100-foot receptor spacing, and 200-foot receptor spacing. Each vertical section is divided into two subsections: 50-foot distance and 100-foot distance. Each subsection is divided into three blocks of columns for the cases of one, two, and three rows of houses. Within each block are columns for each of the six barrier heights.
Figure 13, Figure 14, and the top two sections of Figure 15 show the insensitivity of the NRDG reasonableness criterion to the NRDG quantity. The narrow vertical yellow bands are for the 6-foot barrier heights. These bands widen to include the 10-foot barrier when the NRDG increases from 7 and 8 dB to 9 and 10 dB for each of the horizontal sections in Figure 13 (values of N of 1, 2 and 3), in Figure 14 (the four percentages of first-row benefits), and for the 10% and 25% bands for "percentage of all benefited receptors" in Figure 15. This finding holds true no matter the receptor spacing, distance back from the barrier, or number of rows of receptors in the study area, at least for the range of values in the array.
As one moves down into the third horizontal band in Figure 15, the required percentage of all benefited receptors increases to 50%. Some of the 10-foot height cases for NRDG of 7 dB and 14-foot cases for NRDG of 8 dB begin to become "not reasonable" for the two-row and three-row study areas. Moving down to the 67% and 80% bands for "percentage of all benefits," many more of the two-row and three-row cases become "not reasonable" while the one-row cases stay reasonable. These results confirm exactly what was illustrated earlier in Section 2.2.1.3. A barrier that would be reasonable for a one-row neighborhood suddenly becomes "not reasonable" if that neighborhood was instead a two-row or three-row community. Adding more houses, many of which benefit to some degree from the barrier changes the decision because it is based on "percentage of all benefited receptors" instead of "percentage of first-row benefits" or even "percentage of impacted receptors."
This next decision array includes both the NRDG criterion and the APBR criterion. It is divided into five figures based on APBR:
Again, the vertical sections and subsections are the same as for the previous figures. The horizontal bands are sorted first by NRDG, then benefited noise reduction, then NRDG type, and finally quantity.
The following trends can be observed while reviewing each figure.
For an APBR of 500 SF/ benefited receptor:
For an APBR of 1,000 SF/ benefited receptor:
For an APBR of 1,500 SF/benefited receptor:
For an APBR of 2,000 SF/ benefited receptor:
For an APBR of 2800 SF/benefited receptor:
For most of the criteria combinations, the decisions seemed very insensitive to the "distance back" parameter. The extra distance away from the barrier was only 50 feet. It is expected that a larger increase would start to show more differences in the two situations.
Horizontal blocks, from top to bottom, are for NRDG of 7, 8, 9, and 10 dB
Horizontal blocks, from top to bottom, are for NRDG of 7, 8, 9, and 10 dB
Horizontal blocks, from top to bottom, are for NRDG of 7, 8, 9, and 10 dB
Horizontal blocks, from top to bottom, are for NRDG of 7, 8, 9, and 10 dB
Horizontal blocks, from top to bottom, are for NRDG of 7, 8, 9, and 10 dB
One desired outcome of this analysis was to identify combinations of factors that are very likely to result in: (1) inclusion of noise abatement or (2) exclusion of noise abatement.
The first finding is that the NRDG reasonableness criterion is insensitive to the NRDG quantity for values of 1, 2, and 3 benefited receptors, for the tested percentages of first-row benefited receptors, and for 10% and 25% of all benefited receptors. As the required percentage of all benefited receptors increases to 50%, some cases begin to become "not reasonable" for the two-row and three-row study areas. As the required percentage of all benefited receptors increases to 67% and 80%, many more of the two-row and three-row cases become "not reasonable" while the one-row cases stay reasonable. These results illustrate how a barrier that would be reasonable for a one-row neighborhood suddenly becomes "not reasonable" if that neighborhood was, instead, a two-row or three-row community if the criterion is based on "percentage of all benefited receptors."
Next, the overall reasonableness is very dependent on the APBR.
For an APBR of 500 SF/ benefited receptor, none of the one-row, two-row, or three-row cases were reasonable for the 100-foot and 200-foot receptor spacings, and none of the one-row cases were reasonable for the 50-foot receptor spacing. Combinations with high percentages of all benefits for the NRDG quantity were more likely to be "not reasonable." For the 10 dB NRDG with the 10 dB benefited noise reduction, none of the cases for any of the receptor spacing at any height were reasonable.
As APBR increases, cases become increasingly reasonable, although even at the high values of APBR, the requirements for the higher percentages of all benefited receptors continued to result in negative decisions, even for cases where all of the other parameter values led to barriers being reasonable.
Finally, for most of the criteria combinations, reasonableness was insensitive to the "distance back" parameter, although the difference in distances back was only 50 feet
The selected combinations of feasibility and reasonableness factors were applied to study areas from actual projects to assess how changes in values would affect noise abatement decisions.
Four study areas were selected for testing. The selection process involved reviewing numerous previously-studied areas along actual projects to identify unique but typical cases.
Land use type was a primary consideration in case selection. Comparison of test results would be significantly complicated for study areas with different land use types. Therefore, only areas of single-family residential development were considered.
Study areas were selected to provide different residential development characteristics such as density, distance to first-row residences, and first-row sound levels. Roadway characteristics were also considered including the number of travel lanes, road elevation relative to the adjacent residences (i.e. cut, fill), and design hour volume (DHV).
Table 19 summarizes the key characteristics of Study Areas A through D.
* From edge of near travel lane
Density correlates directly to the number of benefited residences and is often the most important factor in the reasonableness determination. Therefore, the study areas include a range of residential densities. Study Areas A and B are high density (small lots); Study Area C is medium density, and Study Area D is low density (large lot). Figures showing aerial photographs of each of the study areas are in the sections describing the results for each area.
The distances to first-row residences also vary. First-row residences in Study Areas A and C are as close as 100 feet of the edge of the near travel lane while residences in Study Areas B and D are a minimum of 160 feet and 240 feet, respectively, from the edge of the near travel lane.
The adjacent roadway has ten travel lanes adjacent to Study Areas A and C, eight lanes adjacent to Study Area D, and six lanes adjacent to Study Area B. The DHVs for Study Areas A and C are also higher than for Study Areas B and D. Truck percentages range from 6% to 15%
Finally, there is a wide range of predicted sound levels for first-row residences in each study area. First-row sound levels in Study Area C are up to 79 dB(A) due to the close proximity of residences, a very high DHV, and the fact the road is in cut. First-row sound levels are comparable for Study Areas A and B. Study Area D has the lowest sound levels due to the higher distances between first-row residences and the edge of the near travel lane.
The factors that were studied were developed by examining the range in values used in the SHA policies and the expected likelihood or unlikelihood of a positive decision on a barrier design. These factors include:
Feasibility was examined separately from reasonableness, with seven individual cases studied for feasibility. Reasonableness was studied for combinations of values, together resulting in 84 cases: [4 pairs of NRDG and benefited noise reduction] x [7 NRDG quantities (1 numeric value + 3 first-row percentages + 3 all-benefits percentages)] x [3 CE values].
The test method for each study area involved several steps. First, the study area was rerun in the FHWA TNM with each residence represented by a receiver point that was placed in close proximity to the residence, representing the area of frequent human use. All previous noise barrier designs for the study area were deleted. The barrier segments' height range was set from 10 feet to 26 feet in 2-foot increments. The traffic volumes and speeds for the original TNM run were not changed.
New barrier designs were then developed based on a protocol of designing to meet the NRDG. An important question had to be addressed in developing the design protocol for the study areas: Is achieving the NRDG the ultimate goal of the barrier design, or should the barrier be designed using other goals (i.e. protect all impacted first-row receptors) with the NRDG tested as a minimum threshold for reasonableness? This is an important distinction that is not specifically addressed in the regulation or guidance. However, the interpretation of NRDG has significant implications for barrier design and reasonableness determinations.
As discussed previously, the NRDG is met under 21 SHA policies if the barrier provides the NRDG at one or more benefited residences. Numerous different barrier designs could be developed that would meet this NRDG. Whether these designs provide adequate noise reduction for impacted receptors would depend on the SHAs design philosophy and not the NRDG which simply requires achieving the design goal at one or more benefited receptors.
For example, if the NRDG is 7 dB at only one benefited receptor, an analyst could design a barrier for a single receptor at the far end of the community or for only the residence with the highest sound level and then modify the design until enough benefits are achieved to meet the CE criterion. This design does not consider the number and locations of impacts and might provide very small noise reductions for impacted receptors. While this approach would be contrary to the intent of the regulation, one could argue that such design meets the "letter" of the regulation. This example also illustrates that the NRDG does not address how the barrier should be designed. One SHA (VDOT) reports this "mindset" on design-build projects. To ensure that the spirit of the regulation remains intact, VDOT added new language to its guidance manual for consideration in all projects. VDOT's noise specialist notes that, similar to other environmental mitigation features, the goal for noise abatement is to achieve 100% effectiveness, i.e., provide benefits to every impacted noise sensitive receptor. However, as the specialist notes, it is not always possible to benefit every impacted receptor for different reasons.
The noise barriers for the study areas were designed to provide the specified noise reduction for all of the first-row impacted receptors and not just the number or percentage specified by the NRDG. Additionally, the NRDG is based on the number of benefited receptors. However, SHAs do not typically design forbenefited receptors, which are the outcomes of design.
When a design was developed that met the NRDG criterion, the APBR criterion was tested. If the APBR criterion was not met, the barrier height was increased in an attempt to increase the benefits enough to lower the APBR to meet the criterion value.
This protocol assumes a philosophy of trying to provide abatement where impacts exist, which is in keeping with the stated intent in the regulation:
"Sec. 772.13 Analysis of noise abatement. (a) When traffic noise impacts are identified, noise abatement shall be considered and evaluated for feasibility and reasonableness. The highway agency shall determine and analyze alternative noise abatement measures to abate identified impacts by giving weight to the benefits and costs of abatement and the overall social, economic, and environmental effects by using feasible and reasonable noise abatement measures for decision-making." [emphasis added]
The focus is on the first-row because designing to meet the NRDG for more distant receptors generally increases barrier heights over a first-row design, raising the noise reductions for first-row receptors to well above the NRDG. While such a strategy might be employed for areas with very high first-row levels (e.g., worst-hour Leq 75 or more dB(A)), it would not be commonly used for most typical situations (e.g., in the 66 to 74 dB(A) range).
Each study area and its associated results are described below. Two tables are provided for each study area: Feasibility Results (Tables 20, 22, 24, and 26) and Reasonableness Results (Tables 21, 23, 25, and 27).
Each row in each table represents a "case" for the study area (i.e., a particular combination of the criteria and their application to a particular barrier design) and includes the criteria used in the design and the results.
The Feasibility Results table includes the factor "Feas Type." This factor has three possible values (#, P1, and PA) that indicate whether feasibility is based on a number (#), percentage of first-row (P1), or percentage of total impacted receptors (PA). The results include the number of total and first-row impacted receptors (# Impacts ALL, # Impacts 1R), and, depending on Feas Type, the number or percentage of total or first-row impacted receptors that meet the feasibility noise reduction (Feas # 1R, Feas # ALL, Feas % 1R, Feas % ALL). The last column in the table shows the feasibility decision for each case.
Similarly, the Reasonableness Results table includes the factor "NRDG Type." This factor also has three possible values (#, P1, and PA) that indicate whether the NRDG criterion is based on a number (#), percentage of first-row (P1), or percentage of total benefited receptors (PA). The calculated barrier area (Area) is shown. The results include the number of total and first-row benefited receptors (# Ben 1R, # Ben ALL), and, as appropriate, the number or percentage of total or first-row benefited receptors that meet the NRDG criterion (# Ben NRDG 1R, # Ben NRDG ALL, Ben % 1R, Ben % ALL). The decision for NRDG is then shown. The last three columns of the table show the calculated APBR (APBR Calc), whether the calculated APBR is above (No) or below (Yes) the APBR criterion and the overall reasonableness decision (Yes, if both the NRDG and CE criteria are met).
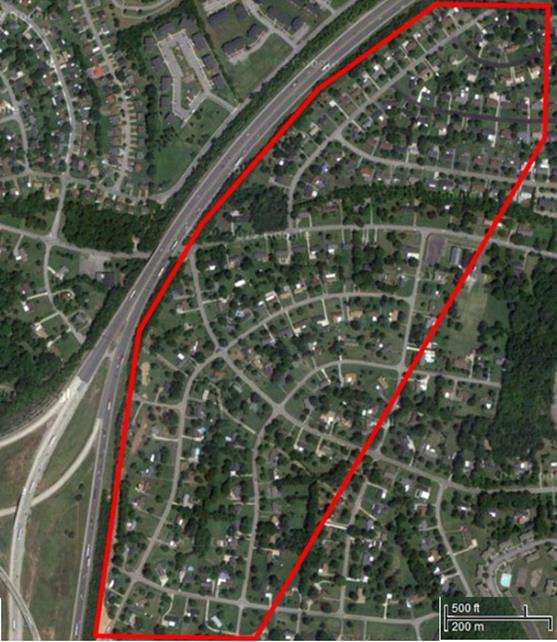
Study Area A represents a proposed widening to a ten-lane highway. The road is on a slight fill and there are several rows of relatively closely spaced houses, as shown in Figure 21.
This project is one for which abatement should be feasible and reasonable because of the number and density of the receptors.
Table 20 shows the feasibility results for Study Area A, and Table 21 shows the reasonableness results for Study Area A.
A barrier was feasible for all seven cases of the tested feasibility factors, an expected result given the density of houses and closeness to the road. Even for Case 7 - 75% of all impacts - enough non-first-row impacts received a noise reduction of at least 5 dB.
A barrier was reasonable for all of the cases for the 7 dB NRDG with a 5 dB benefited noise reduction (Cases 1 through 21), even for Case 21 for 75% of all benefited receptors. All of the APBR were under 800 SF/benefited receptor, a result of the large number of benefits. Note that while the APBR values are in a small range, the barrier area increases nearly 25% from 68,000 SF for the easiest case (Case 1) to nearly 84,000 SF for the most difficult case (Case 21). This increase in area is due mainly to the increase in height, which, on this project, resulted in adding enough benefits to offset the increase in area and keep the APBR in a tight range.
While not shown, the results of the increased height are first-row noise reductions well above the NRDG of 7 dB. It is a matter of design and abatement philosophy as to whether an SHA would push the barrier height up in this manner as long as benefits were still being accrued. Some SHAs might be reluctant to do so; instead they might design a barrier that just meets the 7 dB NRDG criterion, then test that design for CE and draw a conclusion on reasonableness. With such an approach, many of the above cases would result in a decision of "not reasonable." Choice of a philosophy also has critical cost implications, as evidenced by the 25% increase in barrier area from Case 1 to Case 21.
Cases 22 through 42 are for the 7 dB NRDG with a 7 dB benefited noise reduction. All of the cases with the 800 SF/benefited receptor APBR criterion were unreasonable; the cases with the higher APBR were reasonable. These barriers were all in the 74,000 to 84,000 SF range, and the APBR could not be reduced to below 932 SF/benefited receptor. The need to achieve 7 dB in order to count a receptor as benefited required too tall of a barrier to keep the barrier area low enough to reduce the APBR below the 800 SF/benefited receptor criterion.
Cases 43 through 63 are for the 9 dB NRDG with a 9 dB benefited noise reduction ("9 dB/9 dB"). As with Cases 22 through 42, all of the cases with the 800 SF/benefited receptor APBR criterion were unreasonable. While the 9 dB reduction could be achieved at 100% of the benefited receptors, the "penalty" in increase barrier area prevented the reaching of the 800 ABPR value and just barely achieved the 1,250 APBR criterion with a value of 1,249. The barrier height had to be increased substantially to achieve the 1,250 SF/benefited receptor criterion as evidenced by the necessary total area exceeding 100,000 SF. In the process of raising the height, however, more noise reduction was provided.
Cases 64 through 84 are for the 10 dB NRDG with a 5 dB benefited noise reduction ("10 dB/5 dB"). Contrasting with the 9 dB/9 dB cases above, two of these cases (Cases 64 and 67) met the 800 SF/benefited receptor APBR criterion. The NRDG quantities in these two cases were small - one benefited receptor and 25% of first-row benefits. With only a 5 dB benefited noise reduction criterion instead of 9 dB, enough extra benefits were realized to drive down the APBR for these cases. For the higher NRDG percentages, while there were enough benefited receptors to meet the NRDG criterion, there were not enough to meet the 800 APBR criterion. The minimum barrier area for a reasonable design for the 10 dB/5 dB criteria was 72,000 SF. For the higher NRDG percentages with the higher APBR, the barrier area jumped to 105,000 SF. Contrast this amount with the 68,000 SF needed to meet some of the reasonable 7 dB/5 dB designs.
Also, the last three cases for 10 dB/5 dB - where the NRDG criterion was 75% of all benefited receptor - were not reasonable because the NRDG criterion could not be met. In two of these cases, the APBR criterion could not be met either.
Based on experience, it was expected that a noise barrier would be reasonable for Study Area A . The lessons from Study Area A, with the densely developed residential community, include:
Table 21. Reasonableness Results for Study Area A: Ten-Lane Highway with Dense Development Close to the Highway.
Case |
Reasonableness Factors |
Reasonableness Results |
||||||||||||||||
|---|---|---|---|---|---|---|---|---|---|---|---|---|---|---|---|---|---|---|
NRDG |
Ben NR |
NRDG Type |
NRDG Crit # |
NRDG Crit % 1R |
NRDG Crit % All |
APBR Crit |
Area |
# Ben 1R |
# Ben ALL |
# Ben NRDG 1R |
# Ben NRDG ALL |
Ben % 1R |
Ben % ALL |
Reas. NRDG ? |
APBR Calc |
Reas. APBR ? |
Reas. ? |
|
1 |
7 |
5 |
# |
1 |
0% |
0% |
800 |
68,078 |
35 |
90 |
35 |
42 |
100% |
47% |
Yes-NR-# |
756 |
Yes |
Yes |
2 |
7 |
5 |
# |
1 |
0% |
0% |
1,250 |
64,569 |
35 |
75 |
31 |
38 |
89% |
51% |
Yes-NR-# |
861 |
Yes |
Yes |
3 |
7 |
5 |
# |
1 |
0% |
0% |
2,600 |
64,569 |
35 |
75 |
31 |
38 |
89% |
51% |
Yes-NR-# |
861 |
Yes |
Yes |
4 |
7 |
5 |
P1 |
0 |
25% |
0% |
800 |
68,078 |
35 |
90 |
35 |
42 |
100% |
47% |
Yes-NR-%1 |
756 |
Yes |
Yes |
5 |
7 |
5 |
P1 |
0 |
25% |
0% |
1,250 |
64,569 |
35 |
75 |
31 |
38 |
89% |
51% |
Yes-NR-%1 |
861 |
Yes |
Yes |
6 |
7 |
5 |
P1 |
0 |
25% |
0% |
2,600 |
64,569 |
35 |
75 |
31 |
38 |
89% |
51% |
Yes-NR-%1 |
861 |
Yes |
Yes |
7 |
7 |
5 |
P1 |
0 |
50% |
0% |
800 |
68,078 |
35 |
90 |
35 |
42 |
100% |
47% |
Yes-NR-%1 |
756 |
Yes |
Yes |
8 |
7 |
5 |
P1 |
0 |
50% |
0% |
1,250 |
64,569 |
35 |
75 |
31 |
38 |
89% |
51% |
Yes-NR-%1 |
861 |
Yes |
Yes |
9 |
7 |
5 |
P1 |
0 |
50% |
0% |
2,600 |
64,569 |
35 |
75 |
31 |
38 |
89% |
51% |
Yes-NR-%1 |
861 |
Yes |
Yes |
10 |
7 |
5 |
P1 |
0 |
75% |
0% |
800 |
68,078 |
35 |
90 |
35 |
42 |
100% |
47% |
Yes-NR-%1 |
756 |
Yes |
Yes |
11 |
7 |
5 |
P1 |
0 |
75% |
0% |
1,250 |
64,569 |
35 |
75 |
31 |
38 |
89% |
51% |
Yes-NR-%1 |
861 |
Yes |
Yes |
12 |
7 |
5 |
P1 |
0 |
75% |
0% |
2,600 |
64,569 |
35 |
75 |
31 |
38 |
89% |
51% |
Yes-NR-%1 |
861 |
Yes |
Yes |
13 |
7 |
5 |
PA |
0 |
0% |
25% |
800 |
68,078 |
35 |
90 |
35 |
42 |
100% |
47% |
Yes-NR-%A |
756 |
Yes |
Yes |
14 |
7 |
5 |
PA |
0 |
0% |
25% |
1,250 |
64,569 |
35 |
75 |
31 |
38 |
89% |
51% |
Yes-NR-%A |
861 |
Yes |
Yes |
15 |
7 |
5 |
PA |
0 |
0% |
25% |
2,600 |
64,569 |
35 |
75 |
31 |
38 |
89% |
51% |
Yes-NR-%A |
861 |
Yes |
Yes |
16 |
7 |
5 |
PA |
0 |
0% |
50% |
800 |
71,751 |
35 |
90 |
33 |
67 |
94% |
74% |
Yes-NR-%A |
797 |
Yes |
Yes |
17 |
7 |
5 |
PA |
0 |
0% |
50% |
1,250 |
72,580 |
35 |
90 |
33 |
73 |
94% |
81% |
Yes-NR-%A |
806 |
Yes |
Yes |
18 |
7 |
5 |
PA |
0 |
0% |
50% |
2,600 |
72,580 |
35 |
90 |
33 |
73 |
94% |
81% |
Yes-NR-%A |
806 |
Yes |
Yes |
19 |
7 |
5 |
PA |
0 |
0% |
75% |
800 |
71,773 |
35 |
90 |
33 |
73 |
94% |
81% |
Yes-NR-%A |
797 |
Yes |
Yes |
20 |
7 |
5 |
PA |
0 |
0% |
75% |
1,250 |
72,580 |
35 |
90 |
33 |
73 |
94% |
81% |
Yes-NR-%A |
806 |
Yes |
Yes |
21 |
7 |
5 |
PA |
0 |
0% |
75% |
2,600 |
72,580 |
35 |
90 |
33 |
73 |
94% |
81% |
Yes-NR-%A |
806 |
Yes |
Yes |
22 |
7 |
7 |
# |
1 |
0% |
0% |
800 |
83,887 |
35 |
90 |
35 |
90 |
100% |
100% |
Yes-NR-# |
932 |
No |
No |
23 |
7 |
7 |
# |
1 |
0% |
0% |
1,250 |
72,580 |
33 |
73 |
33 |
73 |
100% |
100% |
Yes-NR-# |
994 |
Yes |
Yes |
24 |
7 |
7 |
# |
1 |
0% |
0% |
2,600 |
72,580 |
33 |
73 |
33 |
73 |
100% |
100% |
Yes-NR-# |
994 |
Yes |
Yes |
25 |
7 |
7 |
P1 |
0 |
25% |
0% |
800 |
83,887 |
35 |
90 |
35 |
90 |
100% |
100% |
Yes-NR-%1 |
932 |
No |
No |
26 |
7 |
7 |
P1 |
0 |
25% |
0% |
1,250 |
72,580 |
33 |
73 |
33 |
73 |
100% |
100% |
Yes-NR-%1 |
994 |
Yes |
Yes |
27 |
7 |
7 |
P1 |
0 |
25% |
0% |
2,600 |
72,580 |
33 |
73 |
33 |
73 |
100% |
100% |
Yes-NR-%1 |
994 |
Yes |
Yes |
28 |
7 |
7 |
P1 |
0 |
50% |
0% |
800 |
83,887 |
35 |
90 |
35 |
90 |
100% |
100% |
Yes-NR-%1 |
932 |
No |
No |
29 |
7 |
7 |
P1 |
0 |
50% |
0% |
1,250 |
72,580 |
33 |
73 |
33 |
73 |
100% |
100% |
Yes-NR-%1 |
994 |
Yes |
Yes |
30 |
7 |
7 |
P1 |
0 |
50% |
0% |
2,600 |
72,580 |
33 |
73 |
33 |
73 |
100% |
100% |
Yes-NR-%1 |
994 |
Yes |
Yes |
31 |
7 |
7 |
P1 |
0 |
75% |
0% |
800 |
83,887 |
35 |
90 |
35 |
90 |
100% |
100% |
Yes-NR-%1 |
932 |
No |
No |
32 |
7 |
7 |
P1 |
0 |
75% |
0% |
1,250 |
72,580 |
33 |
73 |
33 |
73 |
100% |
100% |
Yes-NR-%1 |
994 |
Yes |
Yes |
33 |
7 |
7 |
P1 |
0 |
75% |
0% |
2,600 |
72,580 |
33 |
73 |
33 |
73 |
100% |
100% |
Yes-NR-%1 |
994 |
Yes |
Yes |
34 |
7 |
7 |
PA |
0 |
0% |
25% |
800 |
83,887 |
35 |
90 |
35 |
90 |
100% |
100% |
Yes-NR-%A |
932 |
No |
No |
35 |
7 |
7 |
PA |
0 |
0% |
25% |
1,250 |
72,580 |
33 |
73 |
33 |
73 |
100% |
100% |
Yes-NR-%A |
994 |
Yes |
Yes |
36 |
7 |
7 |
PA |
0 |
0% |
25% |
2,600 |
72,580 |
33 |
73 |
33 |
73 |
100% |
100% |
Yes-NR-%A |
994 |
Yes |
Yes |
37 |
7 |
7 |
PA |
0 |
0% |
50% |
800 |
83,887 |
35 |
90 |
35 |
90 |
100% |
100% |
Yes-NR-%A |
932 |
No |
No |
38 |
7 |
7 |
PA |
0 |
0% |
50% |
1,250 |
72,580 |
33 |
73 |
33 |
73 |
100% |
100% |
Yes-NR-%A |
994 |
Yes |
Yes |
39 |
7 |
7 |
PA |
0 |
0% |
50% |
2,600 |
72,580 |
33 |
73 |
33 |
73 |
100% |
100% |
Yes-NR-%A |
994 |
Yes |
Yes |
40 |
7 |
7 |
PA |
0 |
0% |
75% |
800 |
83,887 |
35 |
90 |
35 |
90 |
100% |
100% |
Yes-NR-%A |
932 |
No |
No |
41 |
7 |
7 |
PA |
0 |
0% |
75% |
1,250 |
72,580 |
33 |
73 |
33 |
73 |
100% |
100% |
Yes-NR-%A |
994 |
Yes |
Yes |
42 |
7 |
7 |
PA |
0 |
0% |
75% |
2,600 |
72,580 |
33 |
73 |
33 |
73 |
100% |
100% |
Yes-NR-%A |
994 |
Yes |
Yes |
43 |
9 |
9 |
# |
1 |
0% |
0% |
800 |
72,580 |
22 |
29 |
22 |
29 |
100% |
100% |
Yes-NR-# |
2,503 |
No |
No |
44 |
9 |
9 |
# |
1 |
0% |
0% |
1,250 |
101,150 |
35 |
81 |
35 |
81 |
100% |
100% |
Yes-NR-# |
1,249 |
Yes |
Yes |
45 |
9 |
9 |
# |
1 |
0% |
0% |
2,600 |
72,580 |
22 |
29 |
22 |
29 |
100% |
100% |
Yes-NR-# |
2,503 |
Yes |
Yes |
46 |
9 |
9 |
P1 |
0 |
25% |
0% |
800 |
72,580 |
22 |
29 |
22 |
29 |
100% |
100% |
Yes-NR-%1 |
2,503 |
No |
No |
47 |
9 |
9 |
P1 |
0 |
25% |
0% |
1,250 |
101,150 |
35 |
81 |
35 |
81 |
100% |
100% |
Yes-NR-%1 |
1,249 |
Yes |
Yes |
48 |
9 |
9 |
P1 |
0 |
25% |
0% |
2,600 |
72,580 |
22 |
29 |
22 |
29 |
100% |
100% |
Yes-NR-%1 |
2,503 |
Yes |
Yes |
49 |
9 |
9 |
P1 |
0 |
50% |
0% |
800 |
72,580 |
22 |
29 |
22 |
29 |
100% |
100% |
Yes-NR-%1 |
2,503 |
No |
No |
50 |
9 |
9 |
P1 |
0 |
50% |
0% |
1,250 |
101,150 |
35 |
81 |
35 |
81 |
100% |
100% |
Yes-NR-%1 |
1,249 |
Yes |
Yes |
51 |
9 |
9 |
P1 |
0 |
50% |
0% |
2,600 |
72,580 |
22 |
29 |
22 |
29 |
100% |
100% |
Yes-NR-%1 |
2,503 |
Yes |
Yes |
52 |
9 |
9 |
P1 |
0 |
75% |
0% |
800 |
72,580 |
22 |
29 |
22 |
29 |
100% |
100% |
Yes-NR-%1 |
2,503 |
No |
No |
53 |
9 |
9 |
P1 |
0 |
75% |
0% |
1,250 |
101,150 |
35 |
81 |
35 |
81 |
100% |
100% |
Yes-NR-%1 |
1,249 |
Yes |
Yes |
54 |
9 |
9 |
P1 |
0 |
75% |
0% |
2,600 |
72,580 |
22 |
29 |
22 |
29 |
100% |
100% |
Yes-NR-%1 |
2,503 |
Yes |
Yes |
55 |
9 |
9 |
PA |
0 |
0% |
25% |
800 |
72,580 |
22 |
29 |
22 |
29 |
100% |
100% |
Yes-NR-%A |
2,503 |
No |
No |
56 |
9 |
9 |
PA |
0 |
0% |
25% |
1,250 |
101,150 |
35 |
81 |
35 |
81 |
100% |
100% |
Yes-NR-%A |
1,249 |
Yes |
Yes |
57 |
9 |
9 |
PA |
0 |
0% |
25% |
2,600 |
72,580 |
22 |
29 |
22 |
29 |
100% |
100% |
Yes-NR-%A |
2,503 |
Yes |
Yes |
58 |
9 |
9 |
PA |
0 |
0% |
50% |
800 |
72,580 |
22 |
29 |
22 |
29 |
100% |
100% |
Yes-NR-%A |
2,503 |
No |
No |
59 |
9 |
9 |
PA |
0 |
0% |
50% |
1,250 |
101,150 |
35 |
81 |
35 |
81 |
100% |
100% |
Yes-NR-%A |
1,249 |
Yes |
Yes |
60 |
9 |
9 |
PA |
0 |
0% |
50% |
2,600 |
72,580 |
22 |
29 |
22 |
29 |
100% |
100% |
Yes-NR-%A |
2,503 |
Yes |
Yes |
61 |
9 |
9 |
PA |
0 |
0% |
75% |
800 |
72,580 |
22 |
29 |
22 |
29 |
100% |
100% |
Yes-NR-%A |
2,503 |
No |
No |
62 |
9 |
9 |
PA |
0 |
0% |
75% |
1,250 |
101,150 |
35 |
81 |
35 |
81 |
100% |
100% |
Yes-NR-%A |
1,249 |
Yes |
Yes |
63 |
9 |
9 |
PA |
0 |
0% |
75% |
2,600 |
72,580 |
22 |
29 |
22 |
29 |
100% |
100% |
Yes-NR-%A |
2,503 |
Yes |
Yes |
64 |
10 |
5 |
# |
1 |
0% |
0% |
800 |
71,985 |
35 |
90 |
16 |
16 |
46% |
18% |
Yes-NR-# |
800 |
Yes |
Yes |
65 |
10 |
5 |
# |
1 |
0% |
0% |
1,250 |
72,580 |
35 |
90 |
16 |
16 |
46% |
18% |
Yes-NR-# |
806 |
Yes |
Yes |
66 |
10 |
5 |
# |
1 |
0% |
0% |
2,600 |
72,580 |
35 |
90 |
16 |
16 |
46% |
18% |
Yes-NR-# |
806 |
Yes |
Yes |
67 |
10 |
5 |
P1 |
0 |
25% |
0% |
800 |
71,985 |
35 |
90 |
16 |
16 |
46% |
18% |
Yes-NR-%1 |
800 |
Yes |
Yes |
68 |
10 |
5 |
P1 |
0 |
25% |
0% |
1,250 |
72,580 |
35 |
90 |
16 |
16 |
46% |
18% |
Yes-NR-%1 |
806 |
Yes |
Yes |
69 |
10 |
5 |
P1 |
0 |
25% |
0% |
2,600 |
72,580 |
35 |
90 |
16 |
16 |
46% |
18% |
Yes-NR-%1 |
806 |
Yes |
Yes |
70 |
10 |
5 |
P1 |
0 |
50% |
0% |
800 |
104,941 |
35 |
90 |
32 |
47 |
91% |
52% |
Yes-NR-%1 |
1,166 |
No |
No |
71 |
10 |
5 |
P1 |
0 |
50% |
0% |
1,250 |
104,941 |
35 |
90 |
32 |
47 |
91% |
52% |
Yes-NR-%1 |
1,166 |
Yes |
Yes |
72 |
10 |
5 |
P1 |
0 |
50% |
0% |
2,600 |
104,941 |
35 |
90 |
32 |
47 |
91% |
52% |
Yes-NR-%1 |
1,166 |
Yes |
Yes |
73 |
10 |
5 |
P1 |
0 |
75% |
0% |
800 |
104,941 |
35 |
90 |
32 |
47 |
91% |
52% |
Yes-NR-%1 |
1,166 |
No |
No |
74 |
10 |
5 |
P1 |
0 |
75% |
0% |
1,250 |
104,941 |
35 |
90 |
32 |
47 |
91% |
52% |
Yes-NR-%1 |
1,166 |
Yes |
Yes |
75 |
10 |
5 |
P1 |
0 |
75% |
0% |
2,600 |
104,941 |
35 |
90 |
32 |
47 |
91% |
52% |
Yes-NR-%1 |
1,166 |
Yes |
Yes |
76 |
10 |
5 |
PA |
0 |
0% |
25% |
800 |
104,941 |
35 |
90 |
32 |
47 |
91% |
52% |
Yes-NR-%A |
1,166 |
No |
No |
77 |
10 |
5 |
PA |
0 |
0% |
25% |
1,250 |
104,941 |
35 |
90 |
32 |
47 |
91% |
52% |
Yes-NR-%A |
1,166 |
Yes |
Yes |
78 |
10 |
5 |
PA |
0 |
0% |
25% |
2,600 |
104,941 |
35 |
90 |
32 |
47 |
91% |
52% |
Yes-NR-%A |
1,166 |
Yes |
Yes |
79 |
10 |
5 |
PA |
0 |
0% |
50% |
800 |
104,941 |
35 |
90 |
32 |
47 |
91% |
52% |
Yes-NR-%A |
1,166 |
No |
No |
80 |
10 |
5 |
PA |
0 |
0% |
50% |
1,250 |
104,941 |
35 |
90 |
32 |
47 |
91% |
52% |
Yes-NR-%A |
1,166 |
Yes |
Yes |
81 |
10 |
5 |
PA |
0 |
0% |
50% |
2,600 |
104,941 |
35 |
90 |
32 |
47 |
91% |
52% |
Yes-NR-%A |
1,166 |
Yes |
Yes |
82 |
10 |
5 |
PA |
0 |
0% |
75% |
800 |
115,001 |
35 |
90 |
33 |
64 |
94% |
71% |
No-NR-%A |
1,278 |
No |
No |
83 |
10 |
5 |
PA |
0 |
0% |
75% |
1,250 |
115,001 |
35 |
90 |
33 |
64 |
94% |
71% |
No-NR-%A |
1,278 |
No |
No |
84 |
10 |
5 |
PA |
0 |
0% |
75% |
2,600 |
115,001 |
35 |
90 |
33 |
64 |
94% |
71% |
No-NR-%A |
1,278 |
Yes |
No |
Study Area B represents a proposed widening to a six-lane highway facility. The road is at-grade with the community. There are two rows of closely-spaced houses that angle away from the road, with two other houses closer to the road than those in the rows, as shown in Figure 22.
For this project, feasibility and reasonableness are both uncertain due the relatively limited number of receptors and the manner in which they angle away from the road.
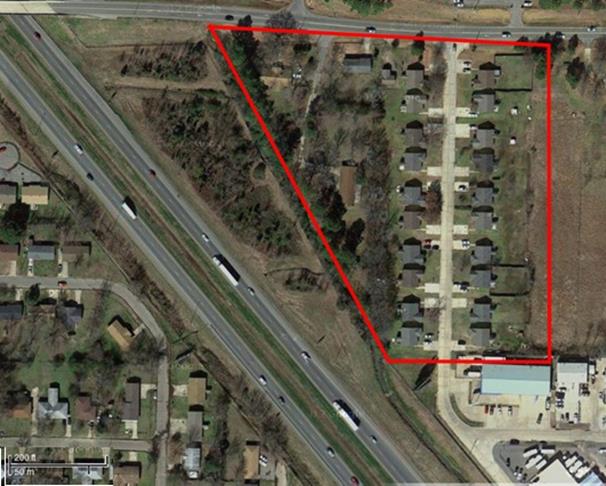
Table 22 shows the feasibility results for Study Area B, and Table 23 shows the reasonableness results for Study Area B.
Table 22. Feasibility Results for Study Area B: Six-Lane Highway with Two Rows of Closely-Spaced Houses Angling Away from Highway
Case |
Feasibility Factors |
Feasibility Results |
||||||||||
|---|---|---|---|---|---|---|---|---|---|---|---|---|
Feas NR |
Feas Type |
Feas Crit # |
Feas Crit % 1R |
Feas Crit % All |
# Impacts ALL |
# Impacts 1R |
Feas # 1R |
Feas # ALL |
Feas % 1R |
Feas % ALL |
Feasible? |
|
1 |
5 |
# |
1 |
-- |
-- |
14 |
7 |
3 |
3 |
43% |
21% |
Yes-# |
2 |
5 |
P1 |
-- |
25% |
-- |
14 |
7 |
3 |
3 |
43% |
21% |
Yes-%1 |
3 |
5 |
P1 |
-- |
50% |
-- |
14 |
7 |
6 |
10 |
86% |
71% |
Yes-%1 |
4 |
5 |
P1 |
-- |
75% |
-- |
14 |
7 |
6 |
10 |
86% |
71% |
Yes-%1 |
5 |
5 |
PA |
-- |
-- |
25% |
14 |
7 |
6 |
10 |
86% |
71% |
Yes-%A |
6 |
5 |
PA |
-- |
-- |
50% |
14 |
7 |
6 |
10 |
86% |
71% |
Yes-%A |
7 |
5 |
PA |
-- |
-- |
75% |
14 |
7 |
7 |
14 |
100% |
100% |
Yes-%A |
A barrier was feasible for all seven combinations of the feasibility factors, even for Case 7 - 75% of all impacts - which required extra barrier height to reach the 75% value.
A barrier was not reasonable using the APBR criterion of 800 SF/benefited receptor for any of the combinations of NRDG and benefited noise reduction (Cases 1 through 84).
For the 7 dB NRDG and 5 dB benefited noise reduction in Cases 1 through 21, barriers were reasonable for the 1,250 and 2,600 APBR criteria for all options for the NRDG quantity. Area requirements were in the 21,000 to 27,000 SF range for these designs.
Cases 22 through 42 for 7 dB NRDG and 7 dB benefited noise reduction, and Cases 43 through 63 for 9 dB NRDG and 9 dB benefited noise reduction were also unreasonable using the 1,250 SF/benefited receptor APBR criterion. For the 7 dB/7 dB cases, 1,343 SF/ benefited receptor was the lowest APBR for any of the designs; and for the 9 dB/9 dB cases, 2,524 SF/ benefited receptor was the lowest value. However, all of the cases for those two combinations were reasonable for the 2,600 SF/benefited receptor APBR criterion. Square footage requirements were in the 27,000 to 28,000 SF range for the 7 dB/7 dB cases and approximately 33,000 for the 9 dB/9 dB cases. The extra area for the latter cases was necessary to achieve the higher 9 dB NRDG, although fewer receptors were actually counted as "benefited" due to the higher benefited noise reduction criterion.
For the 10 dB NRDG and 5 dB benefited noise reduction in Cases 64 through 84, most of the cases using the 1,250 and 2,600 SF/benefited receptor APBR criteria were reasonable. However, for Case 81, requiring 50% of all benefited receptors to meet the NRDG, only the 2,600 APBR criterion was met. Also, none of the cases requiring 75% of all benefited receptors to meet the NRDG were reasonable for any of the three tested APBR criteria (Cases 82 through 84). The barrier area for the reasonable case was as low as 30,000 SF when only one benefited receptor or only 25% of the first-row benefited receptors had to meet the 10 dB NRDG. The needed area increased to 37,000 when 50% of all benefited receptors were required to meet the NRDG. For the unreasonable "75% of all" cases even an area of nearly 55,000 SF was not enough to meet the NRDG at the needed number of receptors.
Study Area B was one where the expectation, based on experience, was that a noise barrier was probably necessary based on the high predicted no-barrier levels for the receptors closest to the road. The close spacing of the receptors supported a decision of "reasonable," while the fact that the rows of houses angled away from the road raised the question as to whether sufficient benefits could be obtained. The mixed results bore out these considerations. The lessons from Study Area B include:
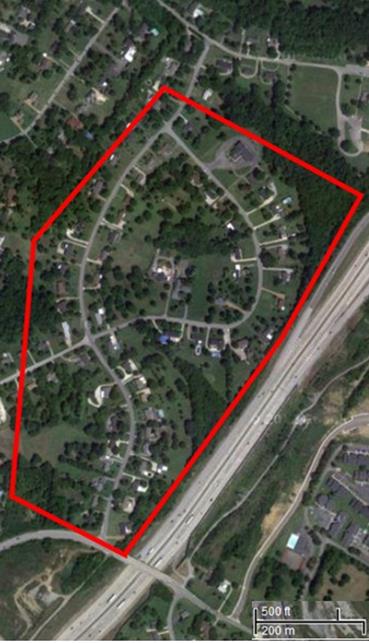
Study Area C represents a proposed widening to an eight-lane Interstate facility. Figure 23 shows the area. The road is in slight cut and there are groupings of houses on two curved residential streets with open area between them.
For this project, feasibility and reasonableness are somewhat uncertain due to the moderate residential density and the fact that the road is primarily in cut.
Table 24 shows the feasibility results for Study Area C, and Table 25 shows the reasonableness results Study Area C.
A barrier was feasible for all seven combinations of the feasibility factors, just barely meeting the case for 75% of all impacts. If this factor had been 80%, the barrier would not have been feasible in that case.
For almost all of the cases, a barrier was reasonable in terms of the NRDG criterion. The exceptions were for the 10 dB NRDG and 5 dB benefited noise reduction requiring 75% of all benefited receptors (Cases 82 through 84).
However, in terms of the APBR criterion, a barrier was not reasonable for many more cases. Overall, a barrier was reasonable for only 23 of the 84 studied cases, most of them for an APBR of 2,600 SF/benefited receptor.
None of the cases were reasonable for an APBR criterion of 800 SF/benefited receptor.
Three of the cases were reasonable for the 1,250 SF/benefited receptor APBR criterion, all for an NRDG of 7 dB when the benefited noise reduction criterion was 5 dB ("7 dB/5 dB"):
Seven of the cases were reasonable for the 7 dB NRDG and 7 dB benefited noise reduction ("7 dB/7 dB"), all for the 2,600 SF/benefited receptor APBR criterion.
None of the cases were reasonable for an NRDG of 9 dB and benefited noise reduction criterion of 9 dB because of the large amount of area needed to meet the 9 dB NRDG while also accumulating enough benefits at a 9 or more dB reduction ("9 dB/9 dB").
For a 10 dB NRDG and a 5 dB benefited noise reduction ("10 dB/5 dB"), all of the cases for the 2,600 SF/benefited receptor APBR criterion were reasonable except Case 84 requiring 75% of all benefited receptors; the NRDG could only be achieved at 52%.
Square footage requirements were around 35,000 SF for the designs for the 7 dB NRDG and 5 dB benefited noise reduction, 48,000 SF for the designs for the 7 dB NRDG and 7 dB benefited noise reduction, and up to 55,000 SF for the 10 dB NRDG and 5 dB, reflecting the need to achieve the required higher noise reductions.
Study Area C was one where, based on experience, the expectation was that a "reasonable" noise barrier was questionable. The house density was not high, the "first" rows curved away from the road, and there was a small area of undeveloped area in the center of the study area.
The main lessons from Study Area C include:
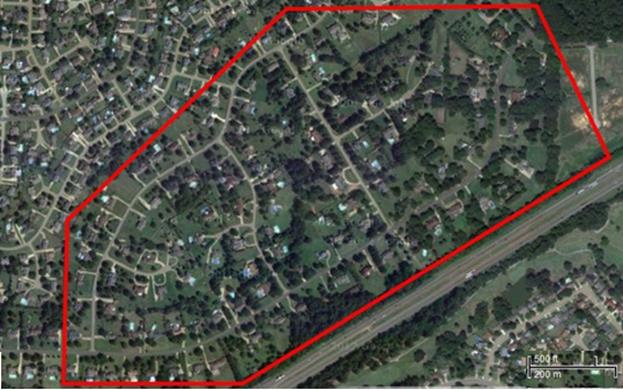
Study Area D, shown in Figure 24, represents a proposed widening to an eight-lane highway facility. The road is on a slight fill and there are several rows of relatively closely spaced houses, with the closest houses nearly 300 feet from the road, yet still being impacted by the proposed project.
Table 26 shows the feasibility results for Study Area D, and Table 27 shows the reasonableness results for Study Area D.
A barrier was feasible for all seven combinations of the feasibility factors. Even though there were 41 receptors in the study area, there were only 9 impacted receptors due to the distance from the road to the first-row of houses of 240 to 330 feet.
For almost all of the cases, a barrier was reasonable in terms of the NRDG criterion. The exceptions were for the 10 dB NRDG and 5 dB benefited noise reduction requiring:
However, in terms of the APBR criterion, a barrier was not reasonable for many more cases. The result was that, overall, a barrier was reasonable for only 10 of the 84 studied cases.
Those 10 "reasonable" cases were all for an APBR criterion of 2,600 SF/benefited receptor when the benefited noise reduction criterion was 5 dB:
Square footage requirements were in the 79,000 to 93,000 SF range for 7 dB NRDG case and 98,000 to 101,000 SF for the 10 dB NRDG cases. The greater areas were needed for the latter cases in order to achieve the needed higher noise reductions
None of the cases were reasonable when the benefited noise reduction was 7 dB or 9 dB. While the NRDG criterion could be met for these higher noise reductions, the resultant barrier areas were too great to allow the APBR criterion to be met.
Study Area D was one where the expectation was that a "reasonable" noise barrier was questionable, based on experience. While there were first-row impacts, the first-row was far from the road. This distance necessitated a tall and long noise barrier to meet the NRDG criterion and also benefit a sufficient number of receptors at the low 5 dB value for the benefited noise reduction criterion.
The lessons from Study Area D include:
In this chapter, the relationships of the different feasibility and reasonableness factors were tested as to their effects on decisions on noise abatement. First a sensitivity test was conducted on 1,080 combinations of values for four factors:
These combinations were tested on 108 variations of a noise study area scenario along a hypothetical highway. These variations were based on:
These results were compiled in a color-coded spreadsheet array of 1,080 rows by 108 columns, capable of being sorted by different factors. This array was sorted first by the NRDG quantity, with charts for: number of benefited receptors (equal to 1, 2, or 3); percentage of first-row benefits; and percentage of all benefited receptors. The array was then sorted by APBR into five charts (one per APBR). Both approaches allow trends to be seen in the patterns of the displayed decisions.
The second type of testing was done on four actual highway projects where abatement had been previously evaluated. A total of seven combinations of feasibility factors and 84 combinations of reasonableness factors were studied. The choices for the combinations were derived from both the sensitivity analysis and the range of values in the various SHA policies:
The projects were chosen to represent study areas of high and low density with receptors closer to and farther away from the road, as well as for differing numbers of rows of houses.
The results showed the insensitivity of the feasibility decision to the tested range of feasibility quantities. In all cases, the barriers were feasible.
The reasonableness results were mixed, as expected:
[8] A member of the TWG notes that some states rarely place noise barriers on the edge of the shoulder and questions if this locational assumption could affect the results. Barrier placement will most likely affect the results, as will the intervening terrain and the elevations of the roadway and the ground at the receptor and at the barrier (which in turn affects barrier height and cost). It was beyond the scope to test a variety of different cross-sections and barrier locations. The potential effect on the results is acknowledged. It should also be noted that the trends should not change - such as the effects of high or low APBR criteria on reasonableness, as will be discussed
[9] The terminology used is as follows: a "receiver" is a point in an FHWA TNM model at which a sound level is calculated ("predicted"); a "receptor" represents an activity area being studied. A receiver point can, in many cases, represent more than one receptor, such as two or three adjacent houses at the same distance from the road.
[10] The scenario was set up so that in no case did the 6-foot high barrier provide a noise reduction of 6.5 (rounded to 7) or more dB, so that it would not result in a decision of "reasonable."