
Several studies have concluded that mobile sources (i.e., on-road and non-road mobile sources combined) are responsible for the majority of excess cancer risk associated with exposure to urban air toxics. This section includes brief citations from selected recent assessments (Section 3.1), and a more detailed discussion regarding the South Coast Air Quality Management District's (SCAQMD's) MATES-II air toxics study (Section 3.2). MATES-II provides one of the most comprehensive recent examinations of urban-scale air toxics problems, and the study was emphasized by the Sierra Club as an indicator of the relationship between on-road mobile sources and health risks. Historical emissions trends are summarized in Section 3.3, and Section 3.4 summarizes conclusions regarding air toxics and regional air quality.
Included in this discussion are example findings from studies published at the federal, state, and local levels concerning mobile source air toxics. Section 3.1.1 presents nationwide data from the EPA regarding pollutant concentrations; Sections 3.1.2 and 3.1.3 present California data regarding cancer risks (based upon OEHHA URFs).
The EPA's National Air Toxics Assessment (NATA) collects and evaluates monitoring data from around the United States and estimates the extent to which various source types contribute to the measured concentrations (U.S. Environmental Protection Agency, 2002b). The EPA compiled 1996 ambient monitoring data for 33 toxic air pollutants and estimated source contributions. For seven pollutants, the six priority MSAT and lead, the EPA estimated that mobile sources contributed more than 50% to emissions. On-road mobile sources contributed 30% to 65% of the total measured concentrations for the six priority MSAT, and 1% of the total measured concentration for lead. Mobile sources were also responsible for 16% of nickel concentrations, 8% of chromium concentrations, and 5% to 6% of arsenic and manganese concentrations, although in all of these cases non-road mobile sources were the primary contributors.
The CARB identified 10 air toxics of primary concern, five of which are emitted by on road mobile sources: benzene, 1,3-butadiene, formaldehyde, acetaldehyde, and diesel PM (California Air Resources Board, 2001). Based on CARB data for pollutant emissions, excess California statewide cancer risk (1997, 1998, and 2000 data), and the fraction of total statewide emissions attributable to on-road and non-road mobile sources, on-road mobile sources account for approximately 28%, and non-road mobile sources approximately 61%, of the total excess cancer risk resulting from exposure to CARB's top 10 air toxics (California Air Resources Board, 2001). In total, mobile sources are responsible for approximately 89% of the excess cancer risk from the 10 priority air toxics identified by CARB. CARB notes that risks associated with diesel PM are greater than for all other pollutants combined. On-road and non-road mobile source diesel PM emissions constitute 70% of the total risk from the 10 pollutants. On-road mobile sources contributed 26% of the year 2000 California diesel PM emissions; non-road mobile sources contributed 72% of the diesel PM emissions.
During 1998 and 1999, SCAQMD conducted the MATES-II study, which involved monitoring and modeling over 30 different pollutants across the South Coast Air Basin, including most of the 21 MSAT identified by the EPA. Of the six EPA priority MSAT, acrolein was not considered. In addition, DEOGs were not considered as a category, although as pointed out previously, several of the other priority MSAT are constituents of DEOG; DPM was estimated by assuming a correlation with elemental carbon (EC). (Due to the Sierra Club's particular interest in the MATES-II study findings, the MATES-II report is discussed in greater detail in Section 3.2.)
Based on monitored concentrations, the SCAQMD estimated that MSAT (diesel PM, 1,3-butadiene, benzene, formaldehyde, and acetaldehyde) contributed 89% of the total excess cancer risk from the more than 30 pollutants measured; on-road mobile sources were responsible for approximately 48% of the total excess cancer risk (based on applying the on-road fraction of the total 1998 MSAT emissions for each pollutant, to the percent of total risk attributed to that pollutant) (SCAQMD, 2000).
As part of MATES-II, the SCAQMD measured ambient pollutant concentrations at 10 different fixed monitoring sites over the course of a year (April 1998 through March 1999). (Individual hot spots were also studied using mobile monitoring platforms over shorter time periods; these data are discussed in more detail in Section 4.3.) SCAQMD also created an inventory of air toxics emissions within the South Coast Air Basin (defined as a 210-km by 120-km rectangular area, for modeling purposes) and conducted photochemical grid modeling to determine regional impacts using the EPA's Urban Airshed Model (UAM). Relative contributions from on-road mobile sources, non-road mobile sources, and stationary sources are shown in Figure 3-1. As indicated by Figure 3-1, on-road sources were estimated to contribute approximately half to two thirds of the MSAT emissions.
MATES-II estimates of source contributions to the emission inventories for these pollutants are roughly consistent with the EPA's subsequent nationwide estimates of source contributions for these pollutants (U.S. Environmental Protection Agency, 2001). Although onroad mobile sources dominate the emission inventories for these five pollutants, non-road mobile sources are also important contributors.
Diesel Particulate  |
Benzene  |
1,3-Butadiene  |
Formaldehyde  |
Acetaldehyde  |
 |
On-Road Mobile Sources | |||
 |
Non-Road Mobile Sources | |||
 |
Stationary Sources | |||
| Relative contributions of on-road mobile, non-road mobile, and stationary source emissions of DPM, benzene, 1,3-butadiene, formaldehyde, and acetaldehyde in California's South Coast Air Basin, as documented in the SCAQMD's MATES-II study (SCAQMD, 2000). | ||||
When interpreting the monitoring data, SCAQMD made the simplifying assumption that all of the DPM, benzene, and 1,3-butadiene impacts were due to mobile sources. Recognizing the fact that formaldehyde and acetaldehyde are formed to a significant extent by chemical reactions in the atmosphere ("secondary" pollution) as opposed to being emitted directly ("primary" pollution), SCAQMD only attributed 50% of the monitored amounts of these two pollutants to mobile sources. The remaining 50% of the aldehydes--as well as all of the rest of the pollutants monitored--were attributed to stationary sources. Because DPM cannot be measured directly in ambient air samples, DPM concentrations were estimated by multiplying concentrations of EC by a scaling factor of 1.04. As described in further detail in Appendix A, there are uncertainties associated with this technique; also, the scaling factor of 1.04 was derived from a 1982 emission inventory (based on the MATES-II inventory, the scaling factor should have been 0.90).
Monitoring data were consistent with dispersion modeling results within ± 50% to 60% of measured values (SCAQMD concluded that modeled concentrations were low because the CARB mobile source emission factor models underestimate emissions).
The MATES-II study quantified risk based upon monitored data, using OEHHA-assigned URFs (see Table 2-2). Annual average concentrations of the five priority MSAT were comparable to each other, on the order of 1-10 mg/m3, with 1,3-butadiene being present at slightly lower levels (SCAQMD, 2000). However, because the URF for DPM is significantly higher than the URF for the other pollutants, the resulting calculation of 1,400 excess cancers per million people was influenced largely by DPM, which accounted for approximately 70%, or 1000 of the excess cancers. The MSAT benzene, 1,3-butadiene, and (to a lesser extent) formaldehyde and acetaldehyde contributed about 15% to 20% of the risk.
Ambient concentrations observed during MATES-II were relatively consistent across the 10 regional-scale sites studied. The MATES-II findings are consistent with an analysis of long-term ambient air quality data collected in San Diego (Main and Stiefer, 2001). Specifically, the San Diego work examined a lower socio-economic community (Barrio Logan), proximate to industry and heavily trafficked roads. Long-term average pollutant concentrations in this community (including data for acetaldehyde, benzene, 1,3-butadiene, and formaldehyde) were shown to be the same or lower than those observed in other nearby San Diego locations. However, it should also be noted that with respect to short-term (24-hour average) episodes, higher concentrations were found in Barrio Logan than in the other nearby San Diego locations. For the episode analysis, the researchers found, "For the December 20, 1999, case study, Barrio Logan TAC [Toxic Air Contaminant] concentrations were similar to or higher than TAC concentrations at Chula Vista and El Cajon [San Diego area monitoring sites]. Twenty-four-hour CO, NO, and NOx concentrations at Barrio Logan on December 20 were also significantly higher than at Chula Vista and El Cajon; this indicates that motor vehicle emissions contributed more to concentrations at Barrio Logan on this day than at other sites on this day" (Main and Stiefer, 2001; Section 5).
Overall, as noted above, MATES-II found that mobile sources were responsible for a substantial fraction of the region's excess cancer risk, and DPM was the largest single contributor to the risk observed. To place the MATES-II findings in a national context, it is helpful to note how the EPA characterized DPM risk in its Health Assessment Document for Diesel Engine Exhaust (U.S. Environmental Protection Agency, 2002a):
. . . .based on a more quantitative approach involving the observed lung cancer from occupational exposures and the magnitude of occupational and environmental exposure differences, an exploratory risk analysis shows that environmental cancer risks possibly range from 10-5 to nearly 10-3, while a consideration of numerous uncertainties and assumptions also indicates that lower risk is possible and zero risk cannot be ruled out. These risk findings are only general indicators of the potential significance of the lung cancer hazard and should not be viewed as a definitive quantitative characterization of risk or be used to estimate an exposure-specific population impact. . . . (pp. 8-16)
Exposure to DPM is presumed by both federal and state officials to result in excess cancer risk. The scientific community is still deliberating, however, over how to best represent the risk from DPM exposure. MATES-II estimated DPM-related risk by using the California OEHHA URF for DPM.
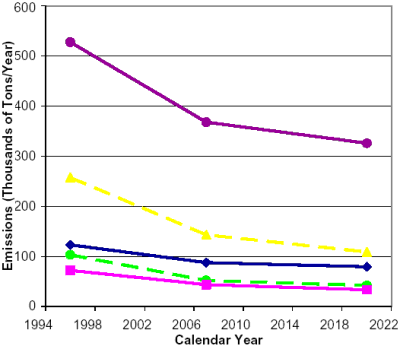
Overall, emissions of the priority MSAT have been decreasing in recent years, and projections out to 2020 forecast further reductions, in spite of an increase in the number of vehicles and miles traveled. Figure 3-2 illustrates the national trends for all mobile sources combined; decreases over time are more pronounced for on-road mobile sources. California, which has maintained an ambient air monitoring network for air toxics since at least 1990, has also observed decreases in the measured ambient concentrations of these pollutants (California Air Resources Board, 2001). MATES-II analyzed the California data and noted that most of the decrease in cancer risk is due to benzene, followed by 1,3-butadiene; however, statistically significant reductions for six other air toxics were also found (SCAQMD, 2000). California trends are consistent with the emissions trends indicated in Figure 3-2.
 |
|
 |
Diesel PM |
|---|---|
 |
Benzene |
 |
1,3-Butadiene |
 |
Formaldehyde |
 |
Acetaldehyde |
In summary, both the EPA and MATES-II emission inventories have identified mobile sources (on-road and non-road) as the predominant contributors to regional-scale air quality problems with respect to the priority MSAT. However, emissions from on-road mobile sources have been decreasing over time as older, higher-emitting vehicles are replaced with newer vehicles meeting more stringent emissions standards, and as cleaner (lower-emissions) fuels have been developed.
The MATES-II monitoring data demonstrated that long-term (i.e., one year) regional air quality was relatively uniform both spatially and temporally, with the exception that concentrations of benzene, 1,3-butadiene, and EC showed increases in the wintertime. Mobile sources were the dominant source of emissions of the five priority MSAT studied, although nonroad mobile sources were often a substantial portion of the total mobile source contribution: i.e., non-road mobile sources represented nearly half of the total mobile source emission inventories for DPM, formaldehyde, and acetaldehyde, and roughly a quarter of the total mobile source emission inventories for benzene and 1,3-butadiene. Reductions in monitored concentrations of benzene, 1,3-butadiene, and other air toxics have been observed since 1990. The EPA and CARB both project future MSAT emissions reductions, especially for DPM.
Although MATES-II highlighted DPM as the most significant risk, quantification of DPM in the ambient air and the assessment of cancer risk have significant uncertainties (risks from DPM may be higher or lower than represented by California's URFs). The EPA, for example, has yet to establish a URF based upon the existing data. However, mobile sources are significant contributors to the overall risk associated with regional-scale air toxics. Even if the DPM URF were reduced by an order of magnitude, a possibility given the range of risks discussed by the U.S. Environmental Protection Agency (2002a), total MATES-II air toxics risks would still be approximately 500 excess cancer deaths per million exposed people, and mobile sources (on-road and non-road) would be responsible for over 70% of the estimated risks.

