
The Sierra Club commissioned three technical studies related to potential air pollution impacts from US 95, summarized the findings, and presented the FHWA with written correspondence raising concerns related to air toxics and PM2.5. This section includes comments on the issues raised by the Sierra Club, organized into two categories: (1) comments regarding the applicability of MATES-II findings to the Las Vegas region and (2) comments regarding PM2.5. Section 6 also includes summary responses to the overall issues raised by the Sierra Club, placed in the context of the technical material presented in this report.
Before discussing the extent to which MATES-II findings are applicable to Las Vegas, it is illustrative to first identify what the primary findings were for the area that was studied (southern California). Sections 3.1, 3.2, and 4.3 discuss the major findings from the MATES-II study with respect to regional and localized (near-freeway) conditions. The main points (as discussed in this report) include:
At the regional scale, MATES-II demonstrates that on-road and non-road mobile sources are the dominant emissions sources of air toxics in the Los Angeles region. The MATES-II findings are consistent with other studies at the federal and state level.
MATES-II was not designed to measure or accurately model air toxics concentrations as a function of distance from roads. However, the limited freeway-specific data available from MATES-II are consistent with other reported findings that indicate pollutant concentrations originating on-road decline substantially within the first 100 m from the road.
MATES-II finds mobile sources to be responsible for approximately 90% of the excess cancer risk from air toxics in the Los Angeles area. The risk estimates are a direct function of the URFs assumed for MSAT, and especially for DPM, which is estimated to be responsible for 70% of the total urban-scale air toxics risk.
In general, MATES-II approaches the subject of air toxics from two perspectives: (1) direct monitoring of air toxics concentrations at multiple locations over an extended period of time, and (2) creating an emission inventory and conducting dispersion modeling to predict those concentrations. On a regional scale, there is a degree of consistency between the direct measurements and the predictions; MATES-II identifies the model results as being within ±50-60% of the measured values (SCAQMD, 2000). The extent of the agreement provides an important measure of quality assurance. The direct measurements consistently indicate relatively small differences in spatial variability (site-to-site differences), but a significant temporal variation was noticed (i.e., concentrations of air toxics attributed to mobile sources increased in the winter). However, with respect to microscale assessments, the design of MATES-II did not allow for significant characterization of ambient concentrations within 100 m of roadways, given the fact that the monitors were generally more than 100 m downwind of the roadways. There are complications associated with the determination of the relationship between DPM (for which there is not a direct measurement method, for ambient air concentrations) and elemental carbon (for which there are different measurement methods that are known to give different results). These complications result in uncertainties on the order of a factor of two.
Conclusions with respect to relative risks are highly dependent upon the URFs chosen. In particular, for DPM, the EPA decided against identifying a URF, identifying only "exploratory" risks corresponding to URFs ranging between 1.25 x 10⁻⁵ and 1.25 x 10⁻³, and adding that lower risk is possible and zero risk cannot be ruled out (U.S. Environmental Protection Agency, 2002a). OEHHA, on the other hand, while acknowledging the uncertainties associated with the URFs (SCAQMD, 2000), chose to identify a URF of 3.0 x 10⁻⁴ (mg/m3)-1, the value utilized in the MATES-II study. This value is within the "exploratory" range identified by the EPA, and therefore to the extent that a single value needs to be assigned or estimated, OEHHA's conclusions are consistent with conclusions made by the EPA. However, there are significant uncertainties in the URF which could qualitatively affect the conclusion that DPM accounts for the majority of the cancer risk (see Appendix A for more detail).
Despite the uncertainties regarding DPM, however, MATES-II determined that mobile sources contribute significantly to overall cancer risks: i.e., other mobile source air toxics accounted for 20% of the overall risk, whereas stationary sources only accounted for 10% of the overall risk. Among the MSAT, benzene and 1,3-butadiene were the most significant contributors to overall risk, behind DPM.
To assess whether the MATES-II findings are applicable to the Las Vegas region, it is important to consider the following:
Regional-scale criteria
Are there conditions unique to Las Vegas that would indicate that the relative importance of mobile sources to overall regional emissions is substantially different than what occurs in Los Angeles?
Are there meteorological or other factors to suggest that, assuming Los Angeles and Las Vegas have similar emissions, resulting regional pollutant concentrations would be different?
Microscale criteria (i.e., near freeways)
Are traffic volumes similar for the roadways under consideration in Los Angeles and Las Vegas?
Are emissions factors, measured in grams per mile traveled, similar in the two regions? Emissions factors are a function of ambient temperature and humidity, altitude, travel speed, vehicle mix (e.g., fraction of vehicle fleet that is light-duty gasoline-powered vs. heavy-duty diesel-powered), vehicle age distribution, applicable emissions standards, local mobile source control measures, and other factors.
With respect to the two regional scale criteria, Las Vegas' local air pollution control agency (the Clark County Department of Air Quality Management) currently does not have either an emission inventory or a monitoring program for air toxics, so at this time, definitive comparisons cannot be made. EPA's NATA has estimates of relative contributions to 1996 air toxics concentrations (except DPM) from different source types (see Figure 5-1), but given the fact that the local agency does not have an inventory, the quality of these estimates is questionable. These data show a higher contribution from stationary sources than was estimated in the MATES-II study (see Figure 3-1). Furthermore, Las Vegas is one of the fastest-growing areas in the United States, increasing its population by 83% in the last decade (U.S. Census Bureau, 2001); it is therefore not unreasonable to assume that current emissions may be different from those in 1996 (e.g., there may be more non-road mobile source emissions from construction equipment). Additional information is needed in order to quantify the extent of the difference between emissions in Southern California and emissions in Las Vegas.
Benzene  |
1,3-Butadiene  |
Formaldehyde  |
Acetaldehyde  |
 |
On-Road Mobile Sources | ||
 |
Non-Road Mobile Sources | ||
 |
Stationary Sources | ||
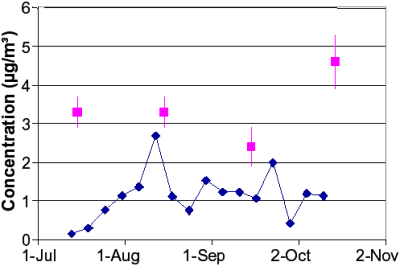
Limited monitoring data for EC are available for Las Vegas; these are compared against MATES-II EC data in Figure 5-2. These data indicate that DPM ambient concentrations in Las Vegas (which, as mentioned before, can be correlated to some extent with EC concentrations) may be somewhat lower than in Los Angeles.
The two criteria identified for assessing the transferability of microscale impacts were: (1) consideration of differences in the volume of vehicle traffic and (2) consideration of differences in vehicle emissions factors, which depend upon a variety of factors. High (2001) presented data indicating that traffic volumes for California interstates and US 95 in Las Vegas were comparable, but did not investigate differences in vehicle emissions factors. Although the EMFAC model used to estimate emissions from vehicles certified to California emission standards does not include estimates for air toxics, fleet average g/mi emission rates for organic gases (which include most of the priority MSAT) and carbon monoxide (the surrogate used to assess microscale impacts in the EIS) are compared to those for Las Vegas in Table 5-1. Los Angeles and Las Vegas fleet average g/mi emission rates appear to be within about 10%-20% of each other for calendar year 2000. It is important to note that because different models are used to generate emissions factors for the two areas differences can stem from both real differences between vehicle emissions in the two areas and differences in the models themselves; there are also differences in the extent to which input data are accurate.
 |
|
 |
1998 MATES-II data (monthly 24-hr average data for 10 monitors; error bars show 90% confidence interval) |
|---|---|
 |
Las Vegas - 2002 Data from East Charleston Monitor |
| See Appendix C for details of emissions models used and input data. | |||||||||||||||||||||||||
|
|
||||||||||||||||||||||||
In summary, the quantitative MATES-II study results are not directly transferable to Las Vegas. At the regional level, although freeway traffic flow on US 95 may be comparable to that on some freeways in Los Angeles, it cannot be inferred that regional air toxics emissions in the two areas are therefore comparable. Regional emissions from on-road vehicles depend upon the traffic volumes in the two areas, as well as differences in emissions factors between the two areas; emission inventory data indicate that the contributions from other sources are also somewhat different. Pollutant concentrations in the ambient air resulting from emissions will be influenced by differences in meteorology and topography. Although measurement data for ambient air toxics are unavailable for Las Vegas, EC concentrations (which are used as surrogates for DPM) appear to be lower in Las Vegas than in southern California.
With the exception of road dust, essentially all of the particulate matter attributed to vehicles (either as direct emissions, or compounds which are emitted as gases and condense into particulate matter in the ambient air) is smaller than 2.5 mm in size (PM2.5). For example, in its rulemaking package listing DPM as a toxic air contaminant, CARB and OEHHA noted that approximately 98% of DPM is PM10, 94% is PM2.5, and 92% is PM1.0 (California Air Resources Board and California Office of Environmental Health Hazard Assessment, 1998). Heavy-duty diesel vehicles (HDDVs) are likely to be the greatest on-road contributor to observed PM2.5 concentrations, since on a g/mi basis, HDDVs emit substantially more PM2.5 than lightduty, gasoline-fueled vehicles (LDGVs). A 1997 California study, for example, found that heavy-duty diesel trucks had PM2.5 emission factors 94 times greater on a g/mi basis than light-duty vehicles (Kirchstetter et al., 1999b).
In addition to raising concerns about air toxics, the Sierra Club requested that FHWA further analyze the PM2.5 impacts that might occur due to emissions associated with the proposed US 95 project. There were two main components to the Sierra Club's comments. First, the organization observed that adverse health effects occur when some individuals are exposed to PM2.5 concentrations above 15 mg/m3 over a 24-hr period (e.g., Spalding, 2002). Second, the organization raised concerns about microscale PM2.5 impacts that might occur in communities near US 95 (e.g., Spalding, 2002). The following section briefly discusses both of these issues.
PM2.5 concentrations above 15 mg/m3 over a 24-hr period
The EPA has established annual average and 24-hr NAAQS for PM2.5. The annual average standard is 15 mg/m3 ; the 24-hr standard is 65 mg/m3. By law, the EPA is charged with establishing NAAQS that provide an "adequate margin of safety" with respect to public health (Section 109(b) of the Clean Air Act), and is prohibited from considering factors such as control strategy cost in its deliberation over appropriate health standard thresholds (Supreme Court, 2001). The Sierra Club notes that the existing NAAQS are not protective of public health, since concentrations below the NAAQS cause adverse health effects. A full review of the scientific basis for the NAAQS is beyond the scope of this white paper. The EPA is charged by the Clean Air Act with responsibility for reviewing and, if necessary, revising the NAAQS every five years. A review of the PM2.5 NAAQS is currently underway (e.g., see U.S. Environmental Protection Agency, 2002c). At least until EPA completes a PM2.5 NAAQS review and makes a determination as to whether the existing standard remains appropriate, the existing 24-hr PM2.5 NAAQS of 65 mg/m3 remains in effect. The existing NAAQS are therefore the federal government benchmark for determining thresholds of significance for environmental analyses.
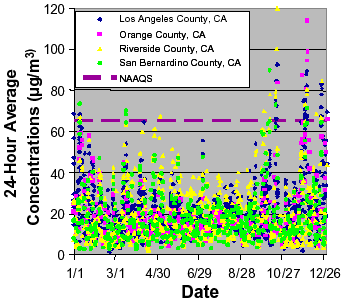
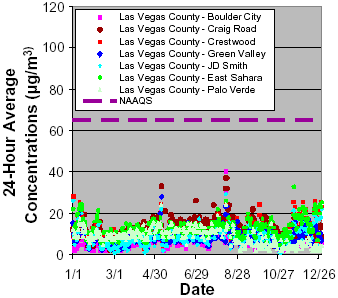
There is recent evidence that ultrafine PM (PM smaller than 0.1 mm; a subset of PM2.5) is perhaps more toxic than PM2.5. As discussed by Zhu et al. (2002b), recent research suggests that health impacts will vary with exposure to the same pollutant mass concentrations depending upon PM size. Zhu et al. note that, at the same mass concentration, ultrafine particles are more toxic than larger particles of the same composition. Currently, NAAQS are established only for PM2.5 and do not differentiate between the ultrafine fraction of PM2.5 and the remainder of the PM2.5 mass. Ultrafine PM health effects are an issue for further research. Figure 5-3 demonstrates differences between 24-hour PM2.5 concentrations measured in southern California and Las Vegas.
 |
 |
Hot spot concerns
In contrast to air toxics, analyses with respect to NAAQS pollutants such as PM2.5 are often threshold-based analyses focused primarily on whether concentrations are below the NAAQS or above the NAAQS. Health risk analyses typically assume that with pollutants for which NAAQS have been established, adverse health effects occur beginning at concentrations above the NAAQS.
The extent to which roadways might contribute to exceedances of the NAAQS on a microscale level depends upon both the background concentrations and the extent to which concentrations are elevated near the roadway. Because the PM2.5 standards were promulgated relatively recently (1997), there is limited real-world monitoring data available regarding the relationship between road proximity and PM2.5 concentrations from a road. However, Kirchstetter et al. (1999b) measured 3-hr PM2.5 concentrations of approximately 133 mg/m3 in a California tunnel (with approximately 2,200 vehicles per hour, 4.2% heavy-duty diesels), with background concentrations of only 17 mg/m3 (i.e., the roadway was contributing 116 mg/m3) and Tiita et al. (2002) concluded that 87 m downwind of a roadway (700-900 vehicles per hour, 20% diesel), the incremental PM2.5 contribution from the road was 11-14 mg/m3. It is difficult to quantitatively apply these results to other areas. Tunnels inhibit pollutant dispersion, and represent an extreme example of potential impacts; Finnish vehicles meet different emissions standards than American vehicles. However, these limited findings indicate that, relative to the 24-hour NAAQS of 65 mg/m3, on-road vehicle PM2.5 emissions may be a concern near a road (e.g., within 100 m) if background concentrations are already near the NAAQS. More research is needed to further understand the relationship between PM2.5 concentrations and road proximity.
There is currently a lack of guidance available to analysts regarding methodological approaches for analyzing the PM impacts of transportation projects at the micro scale. As of late 2002, researchers at U.C. Davis, under sponsorship from both the California Department of Transportation and the FHWA, are preparing a qualitative PM10 analysis protocol to assist transportation analysts charged with assessing PM10 impacts from transportation projects. Though the methodology is focused on road dust impacts unrelated to PM2.5, additional research is appropriate to explore whether the qualitative PM10 analysis protocol, once it is completed, may be expanded to address PM2.5 issues.

