
This section addresses the issue of air quality in areas immediately adjacent to freeways, as opposed to community-wide air quality. It is illustrative to first consider factors affecting short-term localized air quality. Concentrations of primary pollutants in motor vehicle tailpipes are often two to four (or more) orders of magnitude higher than concentrations measured in the ambient air. As pollutants disperse from the points where they are emitted, the concentrations decrease; the more rapid the dispersal (i.e., the higher the wind speed), the lower the concentrations observed adjacent to the road. Key factors contributing to observed hot spot air quality concentrations include source strength (e.g., number and types of vehicles per day and their emission rates); distance from the source to a receptor location (e.g., distance from the road to nearby homes, businesses, and other places representing potential points for exposure); and meteorological conditions (wind speed and direction).
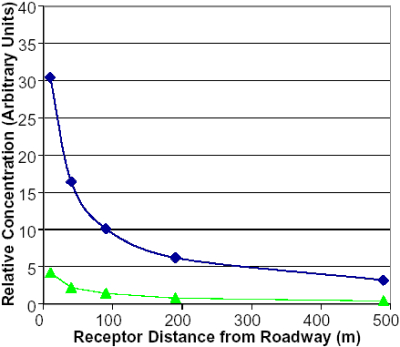
The EPA recommends using the CAL3QHC dispersion model to predict worst-case 1-hour concentrations of carbon monoxide (CO). Figure 4-1 presents an example of how CAL3QHC predicts pollutant concentration changes as a function of distance from a straight roadway, for winds perpendicular to the roadway.
 |
|
 |
1 m/s Wind Perpendicular to Roadway |
|---|---|
 |
10 m/s Wind Perpendicular to Roadway |
Although the small geographic scales near a road (i.e., less than 100 m) are such that few reactions in the atmosphere would need to be considered for air toxics (i.e., because the timeframe for pollutant transport from the source to the receptor is relatively short), it is important to note that some physical transformations can be important (e.g., condensation of pollutants that exist as gases in the hot tailpipes, and large particle sedimentation). Also, CAL3QHC has known deficiencies with respect to modeling turbulence resulting from traffic and winds that are near-parallel to roadways (Rao et al., 2002); it is typically used in the vicinity of intersections, where air quality is expected to be worse as a result of higher vehicle densities and low speeds. It is also known that the CAL3QHC methodology of multiplying 1-hour results by "persistence factors" to predict worst-case concentrations on a longer-term basis (e.g., 8-hour averages) tends to overestimate those concentrations, when compared to incorporating real meteorological data in the model (Guldberg and Tamura, 1994). It is therefore useful to review data from actual roadway studies, as opposed to model predictions, designed to measure concentrations as a function of distance from roadways. Section 4.2 briefly discusses results from three studies that measured concentrations as a function of distance from roads.
A number of studies document that a reduction in pollutant concentrations is observed as distance from a road increases. As a general guide, studies indicate a rapid reduction in observed concentrations as pollutant measurements are taken from immediately next to the road out to a distance of 100 m away from the road (as illustrated in Figure 4-1), although concentrations at 100 m are not necessarily reduced to background levels. Examples of findings that document a reduction in concentrations within 100 m include:
Research conducted by the Southern California Particle Center (SCPC), a research consortium funded by the CARB and EPA (see SCPC, 2002), documented the decline of EC, "ultrafine" PM (i.e., ranging from 0.006 to 0.22 mm), and CO with distance from freeways. Zhu et al. (2002a; 2002b) placed several monitors at varying distances from two freeways in southern California and noted the decline in particle number concentration with distance from the road. They found that EC, CO, and particle number concentrations declined approximately 60% within 100 m, and then leveled off at about 150 m (Zhu et al., 2002b).
Under sponsorship of the California Department of Transportation, scientists at University of California, Davis (UCD) conducted two field studies in Sacramento, California (one in 1995, and another in 1997), to examine the relationship between road proximity and PM10 concentrations. Work completed in 1995 (Ashbaugh et al., 1996, p. 31) found, "All the [PM10] species measured at the intersection dispersed almost completely back to background levels within 100 meters of the intersection. Furthermore, the measured and predicted 24-hour concentration increases due to the intersection were about 15 mg/m3, well below the current PM10 standard of 150 mg/m3." Later work conducted in 1997 at a larger intersection confirmed the findings of the 1995 study (Ashbaugh et al., 1998).
A review of PM10 emission inventory problems prepared by the Desert Research Institute (Watson and Chow, 2000) found that (a) their own past field work suggested that PM10 concentrations decline approximately 90% within 50 m of an unpaved road, and (b) about 75% of suspended dust that remained airborne within 1 to 2 m above ground, deposited back onto nearby surfaces within a few minutes of suspension, and would not move beyond a few kilometers.
MATES-II addressed potential hot spots by reviewing the photochemical grid (UAM) modeling conducted and utilizing three mobile monitoring platforms to measure pollutant concentrations at some of the areas predicted to have high concentrations. Of the 14 "microscale" sites studied, three (Montclair, Norwalk, and Rialto) were selected "because of influence and proximity to major mobile sources (e.g., congested freeways)." Elemental carbon was not monitored at these sites, but four of the other priority MSAT (acetaldehyde, benzene, 1,3-butadiene, and formaldehyde) were measured. With the exception of acetaldehyde at the Norwalk site, which the MATES-II report noted may have been elevated due to differences in measurement methodologies, concentrations of the MSAT pollutants were not significantly different from those measured at nearby fixed monitoring sites that were further from freeways and were sited to represent general urban conditions.
Although MATES-II UAM modeling predicted hotspots near freeways, it is important to note that UAM runs were regional in scale, at a resolution of 2-km by 2-km. This means that the model divided the South Coast Air Basin into a grid of 2-km by 2-km squares and predicted an average concentration for each square. Given the scale of concentration gradients indicated in Figure 4-1, 2-km by 2-km grid modeling is not sufficient for precisely identifying hot spot concentrations. (Although the MATES-II study also incorporated finer-scale modeling with EPA's Industrial Source Complex (ISC) model, the ISC model was applied only to emissions from selected stationary sources.) The MATES-II modeling, by evenly distributing emissions throughout a 2-km grid square, likely underestimates the highest concentrations within that square and overestimates the lowest concentrations. Therefore, the modeling was not able to quantify whether long-term concentrations very close to the roadway were elevated.
Based upon maps presented in the MATES-II study, we estimated the effective distance between each of the three hotspot monitors and nearby freeways.
The Montclair site appears to have been approximately 70 m south of the I-10 freeway, but prevailing winds (over 60% of the time) were from the west-northwest. Therefore, the freeway was typically approximately 200 m upwind of the monitor.
The Norwalk site appears to have been approximately 70 m south of I-105 and 250 m east of I-605. Winds were from due north approximately 14% of the time (making the site just 70 m downwind of I-105) and from due west approximately 10% of the time (so that the site was 250 m downwind of I-605), but were from other directions 76% of the time, making long-term average data more difficult to interpret with respect to freeway influences.
The Rialto site appears to have been roughly 200 m north of I-10, with prevailing winds (roughly 45% of the time) from the west-southwest, such that the interstate was often approximately 400 m upwind of the monitor.
Given the effective distances (usually in excess of 100 m after considering wind direction) between the freeways and the three MATES-II freeway-oriented hot-spot monitors, it is not surprising that measured pollutant concentrations were similar to those measured at sites further from the freeways. As discussed in Sections 4.1 and 4.2, there is a sharp decrease in road-generated concentrations as a function of distance from the road. MATES-II was not designed to accurately measure road impacts on air pollution; MATES-II only measured concentrations at a single location near each of the freeways, rather than measuring at several upwind and downwind locations. However, MATES-II findings are consistent with other studies that indicate concentrations measured beyond 100 m from a road are less likely to observe a pollutant signature from the road.
In its comments on US 95, the Sierra Club cited a recent publication that linked road proximity in Denver, CO, to leukemia and other childhood cancers (Pearson et al., 2000). This discussion includes some brief observations about the study cited by the Sierra Club, and about the epidemiological literature on road proximity and health effects.
The Denver study by Pearson et al. (2000) found an association between traffic density and elevated risk of leukemia and other childhood cancers when traffic density equaled or exceeded 20,000 vehicles per day (VPD) within 750 feet (~230 m) of a child's home (Pearson et al., 2000). The study examined childhood cancer cases reported from 1976 to 1983. The authors did not find correlations between cancer and distance-weighted traffic densities of less than 20,000 VPD.
Although STI did not have access to the original data analyzed, and did not have resources to conduct a detailed peer-review of the Pearson et al. study, some important issues may be raised concerning the applicability of Pearson et al. to existing and future conditions in the United States generally.
Emissions from United States motor vehicles have changed dramatically since the Denver study period. The children studied were diagnosed with their illnesses during the 1976 to 1983 time period. Assuming the cancers resulted from exposures to motor vehicle exhaust that predated the diagnosis date, the vehicle fleets responsible for such emissions were likely those on the road anytime from the early 1970s to the early 1980s (most children were less than 10 years old when diagnosed). As an example of how vehicle emissions have changed over time, federal hydrocarbon (HC) tailpipe standards for light-duty automobiles were 3.0 g/mi in 1972, 1.5 g/mi in 1975, 0.41 g/mi in 1980, and 0.25 g/mi in 1994. Beginning with the 2004 model year, new vehicles will meet federal HC standards of 0.125 g/mi. In a recent study of on-road motor vehicle emissions, Durbin et al. (1999) found that pre-1981 light-duty vehicles emitted 5.06 g/mi of HC, while 1991-1997 light-duty vehicles emitted 0.34 g/mi; in other words, older vehicles emitted about 15 times more HC than newer vehicles.
In some parts of the United States, fuel composition changes over the years have substantially reduced benzene emissions, one of the key pollutants cited in the Pearson et al. study. Pearson et al. (2000) noted that leukemia and other cancers in children could be associated with chronic exposure to benzene, an HC emitted from motor vehicles (and one of the EPA priority MSAT). The Clean Air Act Amendments of 1990 mandated the use of reformulated gasoline (RFG) beginning in 1995 in the nine worst ozone nonattainment areas of the United States (Denver was not among the areas that implemented RFG). Benzene emissions have been reduced by approximately 30% to 60% in areas implementing RFG (e.g., Hammond, 1996; Kirchstetter et al., 1999a; Main et al., 1999; O'Connor et al., 1998; and Zielinska et al., 1997).
The authors acknowledged a number of study limitations, including the inability to identify where all the children lived during their pre-diagnosis period, and concluded, "results are suggestive but do not constitute conclusive evidence of an association between living near a high traffic street and increased incidence of childhood cancer, particularly leukemia" (Pearson et al., 2000; p. 179).
One of the overall difficulties with drawing conclusions from childhood cancer studies is that the research often involves small sample sizes that prevent the scientists involved from establishing statistically significant findings. For example, if the lifetime risk of getting cancer is 40%, it is very difficult to statistically detect a difference of 0.1% (risk of 10-3) between two populations, taking all other relevant risk factors and their associated uncertainties into account, unless the sample sizes are quite large.
Reynolds et al. (2002) reviewed prior epidemiological studies evaluating road proximity and health risk (including the 2000 publication by Pearson et al.) and noted that results were mixed: i.e., although some researchers had, like Pearson et al., found statistically significant correlations, others (Raaschou-Nielsen et al., 2001; Reynolds et al., 2001; 2002) had not. Reynolds et al. (2002) noted that regardless of studies' conclusions, all had the limitation of being based upon various exposure proxies (e.g., traffic counts, number of roads) instead of actual exposure data, and several were also limited by small sample sizes.
A comprehensive review of the epidemiological literature with respect to health effects and road proximity was beyond the scope of this white paper. However, based on the example publications cited, it is possible to offer some general observations. First, although there are technical limitations to extrapolating the Pearson et al. (2000) study findings to present and future conditions, there are other peer-reviewed publications that link distance to roadways as a contributing factor to observed cancer (e.g., Feychting et al., 1998). However, there are also peer-review publications that indicate no linkage (e.g., Reynolds et al., 2001; 2002). Furthermore, all of the studies summarized in a recent review have had the limitation of not being based upon actual pollutant concentration data. It is therefore difficult to draw any definitive conclusions based upon the epidemiological literature. However, it should also be noted that risks on the order of 10-3 or higher could exist and not be detectable by epidemiological studies, simply due to the statistical limitations of those studies.
Both models and experimental data predict that short-term concentrations of air toxics can be elevated for receptors downwind of and very near roadways (i.e., closer than 100 m). Research concerning longer time periods (e.g., several months) suggests that pollutant concentrations outside of the 100-m distance are indistinguishable from background conditions. Although MATES-II was not designed to evaluate how pollutant concentrations change as a function of distance from roads, the MATES-II findings are consistent with other literature that show that outside the 100-m boundary, it is difficult to observe an emissions signature from nearby roads.
Epidemiological studies show mixed results concerning health effects and road proximity, and are limited by the fact that (1) they have not been based upon actual exposure measurements and (2) they often have relatively small sample sizes. Furthermore, epidemiological studies may not be sufficiently precise enough to target cancer risks on the order of 10-3.

