
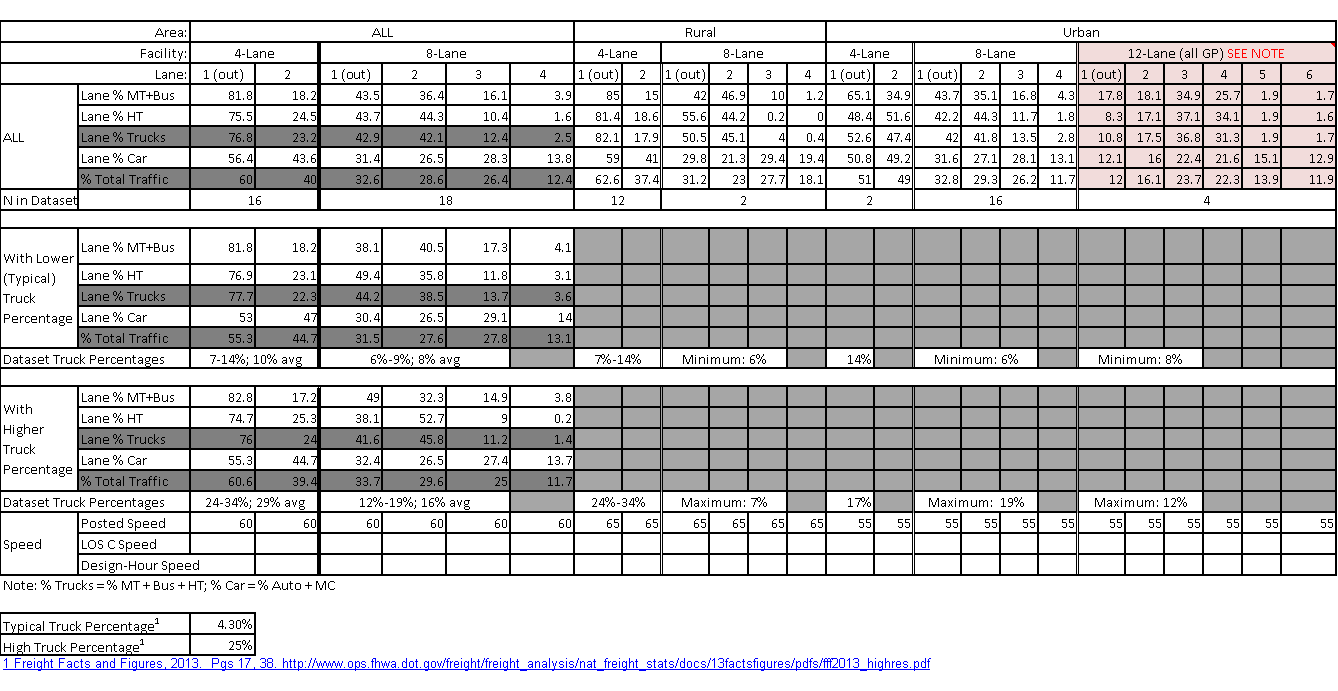
| Area: | ALL | Rural | Urban | ||||||||||||||||||||||
|---|---|---|---|---|---|---|---|---|---|---|---|---|---|---|---|---|---|---|---|---|---|---|---|---|---|
| Facility: | 4-Lane | 8-Lane | 4-Lane | 8-Lane | 4-Lane | 8-Lane | 12-Lane | ||||||||||||||||||
| Lane: | 1 (out) | 2 | 1 (out) | 2 | 3 | 4 | 1 (out) | 2 | 1 (out) | 2 | 3 | 4 | 1 (out) | 2 | 1 (out) | 2 | 3 | 4 | 1 (out) | 2 | 3 | 4 | 5 | 6 (HOV) | |
| ALL | Lane % MT+Bus | 81.8 | 18.2 | 43.5 | 36.4 | 16.1 | 3.9 | 85 | 15 | 42 | 46.9 | 10 | 1.2 | 65.1 | 34.9 | 43.7 | 35.1 | 16.8 | 4.3 | 17.2 | 17.6 | 34.6 | 25.2 | 1.9 | 3.4 |
| Lane % HT | 75.5 | 24.5 | 43.7 | 44.3 | 10.4 | 1.6 | 81.4 | 18.6 | 55.6 | 44.2 | 0.2 | 0 | 48.4 | 51.6 | 42.2 | 44.3 | 11.7 | 1.8 | 8.4 | 17.4 | 37.5 | 34.6 | 1.8 | 0.3 | |
| Lane % Trucks | 76.8 | 23.2 | 42.9 | 42.1 | 12.4 | 2.5 | 82.1 | 17.9 | 50.5 | 45.1 | 4 | 0.4 | 52.6 | 47.4 | 42 | 41.8 | 13.5 | 2.8 | 10.8 | 17.6 | 36.9 | 31.5 | 1.9 | 1.3 | |
| Lane % Car | 56.4 | 43.6 | 31.4 | 26.5 | 28.3 | 13.8 | 59 | 41 | 29.8 | 21.3 | 29.4 | 19.4 | 50.8 | 49.2 | 31.6 | 27.1 | 28.1 | 13.1 | 13.9 | 18.4 | 25.7 | 24.8 | 16.3 | 0.8 | |
| % Total Traffic | 60 | 40 | 32.6 | 28.6 | 26.4 | 12.4 | 62.6 | 37.4 | 31.2 | 23 | 27.7 | 18.1 | 51 | 49 | 32.8 | 29.3 | 26.2 | 11.7 | 13.6 | 18.3 | 26.9 | 25.4 | 14.9 | 0.9 | |
| N in Dataset | 16 | 18 | 12 | 2 | 2 | 16 | 4 | ||||||||||||||||||
| With Lower (Typical) Truck Percentage | Lane % MT+Bus | 81.8 | 18.2 | 38.1 | 40.5 | 17.3 | 4.1 | ||||||||||||||||||
| Lane % HT | 76.9 | 23.1 | 49.4 | 35.8 | 11.8 | 3.1 | |||||||||||||||||||
| Lane % Trucks | 77.7 | 22.3 | 44.2 | 38.5 | 13.7 | 3.6 | |||||||||||||||||||
| Lane % Car | 53 | 47 | 30.4 | 26.5 | 29.1 | 14 | |||||||||||||||||||
| % Total Traffic | 55.3 | 44.7 | 31.5 | 27.6 | 27.8 | 13.1 | |||||||||||||||||||
| Dataset Truck Percentages | 7-14%; 10% avg | 6%-9%; 8% avg | 7%-14% | Minimum: 6% | 14% | Minimum: 6% | Minimum: 8% | ||||||||||||||||||
| With Higher Truck Percentage | Lane % MT+Bus | 82.8 | 17.2 | 49 | 32.3 | 14.9 | 3.8 | ||||||||||||||||||
| Lane % HT | 74.7 | 25.3 | 38.1 | 52.7 | 9 | 0.2 | |||||||||||||||||||
| Lane % Trucks | 76 | 24 | 41.6 | 45.8 | 11.2 | 1.4 | |||||||||||||||||||
| Lane % Car | 55.3 | 44.7 | 32.4 | 26.5 | 27.4 | 13.7 | |||||||||||||||||||
| % Total Traffic | 60.6 | 39.4 | 33.7 | 29.6 | 25 | 11.7 | |||||||||||||||||||
| Dataset Truck Percentages | 24-34%; 29% avg | 12%-19%; 16% avg | 24%-34% | Maximum: 7% | 17% | Maximum: 19% | Maximum: 12% | ||||||||||||||||||
| Speed | Posted Speed | 60 | 60 | 60 | 60 | 60 | 60 | 65 | 65 | 65 | 65 | 65 | 65 | 55 | 55 | 55 | 55 | 55 | 55 | 55 | 55 | 55 | 55 | 55 | 55 |
| LOS C Speed | |||||||||||||||||||||||||
| Design-Hour Speed | |||||||||||||||||||||||||
| Note: % Trucks = % MT + Bus + HT; % Car = % Auto + MC | |||||||||||||||||||||||||
| Typical Truck Percentage1 | 4.30% | ||||||||||||||||||||||||
| High Truck Percentage1 | 25% | ||||||||||||||||||||||||
| 1 Freight Facts and Figures, 2013. Pgs 17, 38. https://ops.fhwa.dot.gov/freight/freight_analysis/nat_freight_stats/docs/13factsfigures/pdfs/fff2013_highres.pdf | |||||||||||||||||||||||||
1 Freight Facts and Figures, 2013. Pgs 17, 38. https://ops.fhwa.dot.gov/freight/freight_analysis/nat_freight_stats/docs/13factsfigures/pdfs/fff2013_highres.pdf

