

Aggregate Image Measurement System 2 (AIMS2): Final Report
APPENDIX A – TEXAS A&M UNIVERSITY REPORT
A Report Submitted to Pine Instruments as Part of FHWA
Grant Number DTFH61-08-G-00003
Leslie Gates, Eyad Masad, and Enad Mahmoud
Texas A&M University
College Station, TX 77843-3136
Email: emasad@civil.tamu.edu
December 31, 2009
Chapter 1 – Improvements of the Aggregate Image Measurement System (AIMS)
Introduction
The Aggregate Image Measurement System (AIMS) was developed to measure aggregate shape characteristics using a computer controlled motion; and image processing and analysis techniques.1 AIMS is capable of capturing the aggregate characteristics over a range of aggregates sizes from 37.5 mm (1.5 in) to 0.075 mm (ASTM #200 sieve). The direct measurements of the aggregates are characterized in terms of shape, angularity, and surface texture. Figure 1.1 shows an illustration of the AIMS system.
This study introduces a new prototype of AIMS (see Figure 1.2)—which will be, in this report, referred to as AIMS2, while AIMS1 (see Figure 1.1) will refer to the old system that was available before the initiation of this study. Although the physical design and process of capturing images were changed between AIMS1 and AIMS2, the algorithms used for the images analysis are the same. This report includes the results of calibrating the new system to confirm that the two systems are producing similar results for the same set of aggregates. The results from the ruggedness study to assess system operational performance, identify significant inputs, and determine appropriate limits for those inputs, are presented herein as well. The repeatability and reproducibility of AIMS from an Interlaboratory Study (ILS) is discussed for multiple users and laboratories.
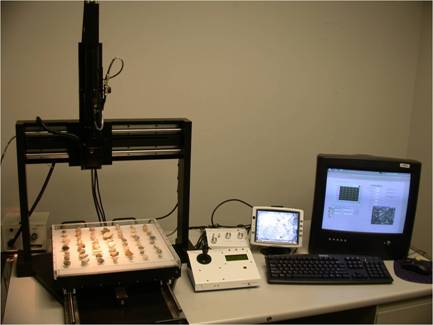
Figure 1.1. A picture of AIMS1.
Aggregates are arranged on a lit tray and a digital camera captures images which are analyzed using AIMS SOFTWARE©. The aggregate angularity is depicted by measuring the irregularity of a particle surface from a black and white image using a bottom lit tray. The texture index is obtained from gray-scale images that are analyzed using the wavelet analysis method.2
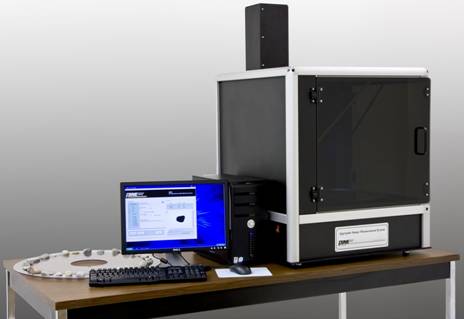
Figure 1.2. A picture of AIMS2.
AIMS2 Calibration
The calibration was done in order to insure the two systems, AIMS1 and AIMS2, were producing similar results for the same set of aggregates. In the development of the new prototype of AIMS2, all of the resulting parameters from the two systems were compared to each other for a set of 32 coarse aggregate samples and 21 fine aggregate samples. Fifty-six particles were scanned from each aggregate source. The comparison of the angularity of the fine and coarse aggregates are shown in Figure 1.3. The angularity values of the two AIMS systems are comparable.
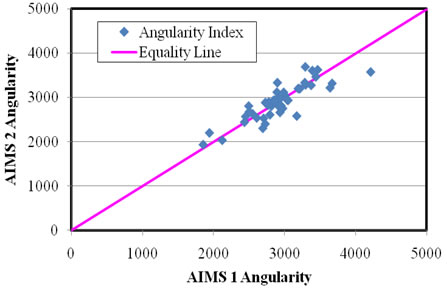
Figure 1.3. Angularity of AIMS1 and AIMS2.
AIMS1 and AIMS 2 texture results, shown in Figure 1.4, rank the aggregates in the same order. However, due to the difference in the cameras and lighting used in AIMS2 and AIMS1, the range of the scale of the texture results of the two systems were different. The scale range for the studied aggregates for AIMS1 was 0 – 600 while the scale for AIMS2 was 0 – 200. It was found that a multiplication shift factor of 2.4563 for the AIMS2 data would provide results comparable to those of AIMS1. The texture values of AIMS1 and AIMS2 after applying the shift factor are shown in Figure 1.5.
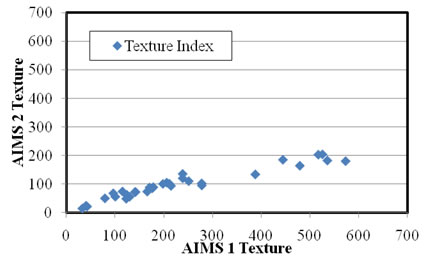
Figure 1.4. Texture of AIMS1 and AIMS2.
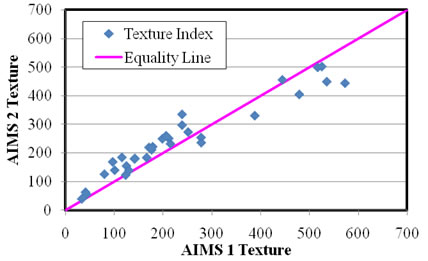
Figure 1.5. Texture of AIMS1 and AIMS2 shifted.
The comparison between AIMS1 and AIMS2 results proved that the two systems provide the same ranking of aggregates and give comparable results. Consequently, the classification system developed previously by the TAMU research team for AIMS13 can be used to classify aggregates based on AIMS2 results.
1 Masad, T. Al-Rousan, M. Bathina, J. McGahan, and C. Spiegelman, "Analysis of Aggregate Shape Characteristics and its Relationship to Hot Mix Asphalt Performance," International Journal of Road Materials and Pavement Design, vol. 8, no. 2, pp. 317–50, 2007.
2E. Masad, T. Al-Rousan, M. Bathina, J. McGahan, and C. Spiegelman, "Analysis of Aggregate Shape Characteristics and its Relationship to Hot Mix Asphalt Performance," International Journal of Road Materials and Pavement Design, vol. 8, no. 2, pp. 317–50, 2007.
3 E. Mahmoud, L. Gates, E. Masad, S. Erdogafan, and E. Garboczi, "Comprehensive Evaluation of AIMS Texture, Angularity, and Dimension Measurements," Journal of Materials in Civil Engineering, vol. 22, no. 4, pp. 369–79, 2010.