

Aggregate Image Measurement System 2 (AIMS2): Final Report
APPENDIX A
Chapter 2 – Ruggedness Evaluation of AIMS2
Introduction
Different operational and environmental factors can cause significant variability in the resulting measurements if they are not identified and controlled. A ruggedness study was conducted to determine the sensitivity of the test method due to changes in levels of these important factors. The results of the ruggedness study can be used to establish appropriate ranges for the parameters in questions by determining the effect of worst-case variation in operating conditions within the tested tolerance range. Two different ASTM standards were used to conduct the ruggedness analysis and predict the effect of the factors tested.
Several factors were selected for evaluating the ruggedness of measuring the characteristics of fine and coarse aggregates based on previous experience of the experimental variations that can affect the test results. The high and low limits for each factor were selected based on limits that would reasonably occur in the test if no particular measures were taken to control them. The factors selected were light illumination, tray size or color, door position, ambient light, zoom level, focus, tray height, number of fine aggregates, and CHPR value.
The light illumination, used for both coarse and fine aggregates, is the top and bottom lighting required to capture aggregate images. The top light is required to capture aggregate texture images and the bottom lighting is required to capture the aggregate angularity images. The light intensity limits were selected to be above and below the operational settings.
Each sieve range has a corresponding tray size for the coarse aggregates. The different trays have a specific trough size to align the aggregates under the camera unit. The fine aggregates only use one tray size, but there are two different tray colors. Light-colored fine aggregate which may be transparent using the typical bottom light with a clear tray, should use a darker opaque colored tray with the top light to capture the angularity images. The limits chosen for the ruggedness evaluation were the different tray sizes or color.
AIMS2 system has transparent doors, which are thought to be adequate to block the effects of ambient light while allowing the operator to view the systems progress. Two door positions, completely open or closed, were tested to determine the significance of the door position.
The ambient light was tested to determine the effect of exterior light surrounding the system (i.e., facility lighting system). This is important since the system is supposed to be used in different laboratories, which can have different lighting. The limits, either on or off, were tested for the ambient light.
The zoom level, tray height, and focus are all system parameters which need to be controlled such that these factors do not introduce variability in the results. The zoom level of the camera is used to determine the area captured by the angularity and texture images. The camera unit focuses on the aggregate surface of the coarse aggregate texture image. The tray height is measured from the top of the inside surface of the AIMS2 base. A particle thickness is measured as the difference between the height of a particle surface and the height of the inside surface of the AIMS2 base. The number of fine aggregates was used as a factor to determine if the results are affected be slight changes in the number of aggregates analyzed.
Due to the manual spreading of the fine aggregates onto the tray, some fine aggregates are touching; touching aggregates are analyzed by AIMS2 as a single particle. The Convex Hull Perimeter Ratio (CHPR), described in Chapter 2, is used to eliminate touching particles that could be analyzed as a single particle.
AIMS2 Ruggedness Analysis Using ASTM C 1067-00
The first ruggedness analysis was carried out according to ASTM C 1067-00 "Conducting a Ruggedness or Screening Program for Test Methods for Construction Materials." This test method was used to detect sources of variation in the test method due to the factors tested. Seven factors were selected for the fine and coarse aggregates based on previous experience with the experimental factors that could cause significant variation in the test results. The high and low limits for each factor were selected based on limits that could reasonably occur in the test if no particular measures were taken to control them.
Experimental Procedures
Following the ASTM C 1067-00 procedure, 16 scans were performed: two replicate sets of eight determinations each. A determination refers to a certain combination of the values for the factors included in the analysis. Scans 1 through 8 are duplicated for the study to obtain scans 9 through 16 in the analysis. Table 2.1 shows a template of the factors and limits for the scans preformed.
From these scans, an effect factor can be calculated to determine the statistical significance of the limits for each factor. ASTM C1067 contains details about calculations necessary for determining the effect factor. An effect factor ≥ 5.59 represents a significant effect with a 5% probability for drawing an erroneous conclusion (ASTM C1067, Section 7.6). If the effect factor is ≤5.59 then the factor is considered not significant (NS) with a 95% level of confidence.
| Replicate Scans Number 1 | ||||||||||
|---|---|---|---|---|---|---|---|---|---|---|
| Factor | Low Limit | High Limit | Scan Number | |||||||
| 1 | 2 | 3 | 4 | 5 | 6 | 7 | 8 | |||
| A | a | A | a | a | a | a | A | A | A | A |
| B | b | B | b | b | B | B | b | b | B | B |
| C | c | C | C | c | C | c | C | c | C | c |
| D | d | D | D | D | d | d | d | d | D | D |
| E | e | E | e | E | e | E | E | e | E | e |
| F | f | F | F | f | f | F | F | f | f | F |
| G | g | G | G | g | g | G | g | G | G | g |
| Replicate Scans Number 2 | ||||||||||
|---|---|---|---|---|---|---|---|---|---|---|
| Factor | Low Limit | High Limit | Scan Number | |||||||
| 9 | 10 | 11 | 12 | 13 | 14 | 15 | 16 | |||
| A | a | A | a | a | a | a | A | A | A | A |
| B | b | B | b | b | B | B | b | b | B | B |
| C | c | C | C | c | C | c | C | c | C | c |
| D | d | D | D | D | d | d | d | d | D | D |
| E | e | E | e | E | e | E | E | e | E | e |
| F | f | F | F | f | f | F | F | f | f | F |
| G | g | G | G | g | g | G | g | G | G | g |
Experiment 1 dealt with coarse aggregate, and Experiment 2 was conducted for the analysis of the fine aggregates. The results from Experiment 1 were used as a guidance to change the limits of the factors for the coarse aggregates and examine ruggedness under these new limits as part of Experiment 3. Experiment 4 investigated the normal variations within the AIMS2 system for both the coarse and fine aggregates. A summary of these experiment are shown in Table 2.2.
| Experiment | Purpose of the Experiment | Aggregate Sizes |
|---|---|---|
| 1 | Preliminary Study to Determine the Appropriate Limits for a Rugged System | 9.5 mm (0.375 in) |
| 2 | Preliminary Study to Determine the Appropriate Limits for a Rugged System | 1.18 mm (ASTM #16 sieve) and 0.60 mm (ASTM #30 sieve) |
| 3 | Based on Experiment 1, a Further Investigation of the Limits | 9.5 mm (0.375 in) |
| 4 | Investigation of the Normal Variations Within the System | 9.5 mm (0.375 in) and 0.60 mm (ASTM #30) |
Experiment 1
Experiment 1 was conducted for the evaluation of the coarse aggregates using the procedure in ASTM C 1067. The analysis was done for two coarse dark and light aggregates of the same size, 9.5 mm (0.375 in). Images of particles from the dark-colored and light-colored aggregate are shown in Figure 2.1.
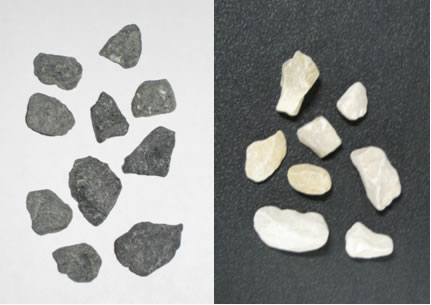
Figure 2.1. Dark and light 9.5 mm (0.375 in) aggregates used in Experiment 1.
The high and low limits for each factor were selected based on limits that would reasonably occur in the test if no particular measures were taken to control them. The factors and limits chosen for the coarse aggregates are shown in Table 2.3.
| Factor | Coarse Aggregate Study Factors: | Low Limit | High Limit |
|---|---|---|---|
| A | Tray size | 12.5 mm | 4.75 mm |
| B | Light illumination (Top and Bottom Light) | -4 | +4 |
| C | Door Position | Close | Open |
| D | Focus | 0 | +1 |
| E | Zoom level | -5% | +5% |
| F | Tray Height | -1 mm | +1 mm |
| G | Ambient light (On, Off) | On | Off |
The limits for the tray size were selected as one tray size above and one tray size below the correct tray size. The light illumination is the top and bottom lighting required to capture the images. The light illumination limits were selected as +4 and -4 from the operational setting to decrease and increase the system lighting. The AIMS2 doors limits were chosen as completely open or completely closed to predict the significance of the door position, which could let some additional ambient light inside the compartment where particles are images. The focus, zoom level, and tray height were used to evaluate the acceptable variability for each factor. The focus was used to find the depth of the aggregate particle when the camera focuses on the particle surface for the texture image. The tray height was the distance from the camera to the tray. The ambient light was used to account for the performance of the doors in eliminating the effect of different intensities of exterior lighting.
It was found that the bottom light during the angularity scans was producing dark shadowed lines around the trough. These dark shadows introduced an additional, uncontrollable error in the test results by reducing the total number of particles scanned especially with the lower light intensities. The coarse aggregates ruggedness study was therefore preformed a second time with different trays. Experiment 1a results discussed hereafter were those that were obtained with the use of trays that produced dark shadowed lines, while Experiment 1b refers to the results from using trays that did not have dark shadowed lines.
Table 2.4 and Table 2.5 list the results from AIMS2 for the dark and light coarse aggregates for Experiment 1a. Table 2.6 and Table 2.7 list the results for Experiment 1b.
| Angularity | Texture | Sphericity | Flat or Elongated 3:1 | |
|---|---|---|---|---|
| Scan 1 | 2826.68 | 265.71 | 0.65 | 2.92 |
| Scan 2 | 2767.43 | 280.40 | 0.70 | 2.33 |
| Scan 3 | 2756.97 | 264.41 | 0.73 | 2.03 |
| Scan 4 | 2747.62 | 270.23 | 0.64 | 3.11 |
| Scan 5 | 2658.89 | 250.85 | 0.67 | 2.79 |
| Scan 6 | 3135.49 | 272.17 | 0.75 | 1.84 |
| Scan 7 | 2846.78 | 272.74 | 0.73 | 2.04 |
| Scan 8 | 2774.34 | 271.54 | 0.68 | 2.56 |
| Scan 9 | 2763.31 | 272.66 | 0.63 | 3.12 |
| Scan 10 | 2781.10 | 272.47 | 0.71 | 2.18 |
| Scan 11 | 2759.57 | 264.60 | 0.74 | 2.00 |
| Scan 12 | 2762.95 | 270.94 | 0.64 | 3.16 |
| Scan 13 | 3030.97 | 282.86 | 0.65 | 2.82 |
| Scan 14 | 2848.53 | 255.47 | 0.77 | 1.76 |
| Scan 15 | 2756.67 | 272.36 | 0.74 | 2.00 |
| Scan 16 | 2825.92 | 269.46 | 0.68 | 2.56 |
| Angularity | Texture | Sphericity | Flat or Elongated 3:1 | |
|---|---|---|---|---|
| Scan 1 | 2434.41 | 43.74 | 0.65 | 2.71 |
| Scan 2 | 2407.84 | 42.89 | 0.69 | 2.20 |
| Scan 3 | 2462.07 | 44.79 | 0.73 | 1.98 |
| Scan 4 | 2507.19 | 41.70 | 0.64 | 3.02 |
| Scan 5 | 2336.08 | 37.78 | 0.64 | 2.75 |
| Scan 6 | 2476.93 | 35.40 | 0.75 | 1.78 |
| Scan 7 | 2448.42 | 41.28 | 0.71 | 2.06 |
| Scan 8 | 2435.48 | 43.97 | 0.67 | 2.43 |
| Scan 9 | 2422.70 | 40.76 | 0.66 | 2.68 |
| Scan 10 | 2453.50 | 42.10 | 0.69 | 2.21 |
| Scan 11 | 2484.49 | 44.04 | 0.73 | 1.98 |
| Scan 12 | 2435.96 | 41.92 | 0.64 | 3.01 |
| Scan 13 | 2807.60 | 40.11 | 0.64 | 2.59 |
| Scan 14 | 2691.57 | 40.69 | 0.69 | 1.98 |
| Scan 15 | 2401.64 | 40.84 | 0.71 | 2.05 |
| Scan 16 | 2407.32 | 44.07 | 0.67 | 2.43 |
| Angularity | Texture | Sphericity | Flat or Elongated 3:1 | |
|---|---|---|---|---|
| Scan 1 | 2648.27 | 263.47 | 0.65 | 2.95 |
| Scan 2 | 2682.28 | 264.23 | 0.70 | 2.35 |
| Scan 3 | 2722.65 | 264.35 | 0.74 | 2.02 |
| Scan 4 | 2784.45 | 260.64 | 0.63 | 3.31 |
| Scan 5 | 2828.15 | 257.26 | 0.65 | 3.07 |
| Scan 6 | 2850.43 | 257.84 | 0.75 | 1.91 |
| Scan 7 | 2703.87 | 258.45 | 0.72 | 2.17 |
| Scan 8 | 2753.98 | 260.55 | 0.69 | 2.56 |
| Scan 9 | 2628.28 | 265.41 | 0.65 | 2.95 |
| Scan 10 | 2731.97 | 265.11 | 0.70 | 2.35 |
| Scan 11 | 2781.50 | 264.90 | 0.74 | 2.02 |
| Scan 12 | 2732.04 | 263.02 | 0.63 | 3.28 |
| Scan 13 | 2788.81 | 256.58 | 0.65 | 3.05 |
| Scan 14 | 2892.87 | 259.52 | 0.75 | 1.95 |
| Scan 15 | 2719.25 | 258.93 | 0.72 | 2.15 |
| Scan 16 | 2765.43 | 261.26 | 0.68 | 2.65 |
| Angularity | Texture | Sphericity | Flat or Elongated 3:1 | |
|---|---|---|---|---|
| Scan 1 | 2429.46 | 46.98 | 0.65 | 2.79 |
| Scan 2 | 2322.89 | 45.19 | 0.68 | 2.38 |
| Scan 3 | 2477.50 | 46.51 | 0.72 | 1.99 |
| Scan 4 | 2481.87 | 45.55 | 0.62 | 3.17 |
| Scan 5 | 2352.98 | 42.99 | 0.63 | 3.04 |
| Scan 6 | 2422.59 | 44.76 | 0.72 | 1.95 |
| Scan 7 | 2459.10 | 44.29 | 0.70 | 2.13 |
| Scan 8 | 2417.34 | 44.88 | 0.67 | 2.54 |
| Scan 9 | 2351.49 | 46.68 | 0.65 | 2.79 |
| Scan 10 | 2421.08 | 46.39 | 0.68 | 2.30 |
| Scan 11 | 2532.09 | 46.54 | 0.73 | 1.99 |
| Scan 12 | 2466.29 | 46.04 | 0.62 | 3.16 |
| Scan 13 | 2376.74 | 43.32 | 0.63 | 2.94 |
| Scan 14 | 2396.31 | 44.61 | 0.72 | 1.94 |
| Scan 15 | 2444.22 | 43.99 | 0.70 | 2.14 |
| Scan 16 | 2414.69 | 44.06 | 0.67 | 2.53 |
The statistical analysis identified the statistical significant factors for Experiments 1a and 1b. The results of the factors were found to be significant or not significant (NS). The summary of the analysis for the coarse aggregates is shown in Table 2.8.
| Experiment 1a | Experiment 1b | ||||
|---|---|---|---|---|---|
| Light | Dark | Light | Dark | Factors | |
| Angularity | NS | NS | NS | 160.03 | Tray size |
| NS | NS | 96.34 | NS | Light illumination | |
| NS | NS | NS | 25.24 | Door Position | |
| NS | NS | NS | 408.77 | Focus | |
| NS | NS | NS | NS | Zoom level | |
| NS | NS | NS | NS | Tray Height | |
| NS | NS | NS | NS | Ambient light | |
| Texture | 19.39 | NS | 4933.41 | 20737.60 | Tray size |
| 25.86 | NS | NS | NS | Light illumination | |
| NS | NS | NS | NS | Door Position | |
| 5.89 | NS | NS | 235.86 | Focus | |
| NS | NS | 164.87 | 220.20 | Zoom level | |
| NS | NS | NS | NS | Tray Height | |
| 6.25 | NS | NS | 17.65 | Ambient light | |
| Sphericity | NS | 255.69 | 8431.15 | 27870.38 | Tray size |
| NS | NS | 2696.45 | 606.57 | Light illumination | |
| NS | NS | 32.90 | NS | Door Position | |
| NS | NS | NS | NS | Focus | |
| 121.02 | 56.09 | 567676.59 | 210883.99 | Zoom level | |
| 4305.08 | 13049.38 | 9961142.09 | 5330850.92 | Tray Height | |
| NS | NS | NS | NS | Ambient light | |
| Flat or Elongated 3:1 | 876.31 | 2119.02 | 8095.51 | 27942.97 | Tray size |
| NS | NS | 121.76 | 118.08 | Light illumination | |
| NS | NS | NS | NS | Door Position | |
| NS | NS | 241.74 | 162.87 | Focus | |
| 1375.34 | 400.86 | 137713.27 | 169145.47 | Zoom level | |
| 84311.45 | 122749.74 | 3483469.88 | 7088424.96 | Tray Height | |
| 25.61 | 12.01 | 49.65 | 424.29 | Ambient light | |
Overall, the angularity and texture variations were significant due to the tray size, light illumination, ambient light, door position, focus, and zoom level. The sphericity and flat or elongated 3:1 results had more significant factors than the angularity and texture results. The tray size, light illumination, door position, focus, zoom level, and tray height affected both the sphericity and flat or elongated results. The ambient light affected only the flat or elongated results. Since the ambient light had a statistical significance on the results, but the AIMS2 door position did not, it was concluded the AIMS2 doors were not shedding the exterior light as designed. As will be discussed later, this lead to changing the doors to be non-transparent that did not allow ambient light into the system.
Experiment 2
Four fine aggregates were used in the analysis of Experiment 2. The four aggregates consisted of both a dark- and light-colored aggregates in two sieve ranges, 1.18 mm (ASTM #16 sieve) and 0.60 mm (ASTM #30 sieve). These aggregates are shown in Figure 2.2 and Figure 2.3. The fine aggregate factors and limits are listed in Table 2.9.
| Dark Aggregate | Light Aggregate |
 |
|
Figure 2.2. Dark and light 1.18 mm (ASTM #16 sieve) aggregates used in Experiment 2.
| Dark Aggregate | Light Aggregate |
 |
|
Figure 2.3. Dark and light 0.60 mm (ASTM #30 sieve) aggregates used in Experiment 2.
| Factor | Fine Aggregate Study Factors: | Low Limit | High Limit |
|---|---|---|---|
| A | Tray color | Clear Tray | Opaque Tray |
| B | Light illumination (Top and Bottom Light) | Top -4 Bottom 0 | Top +4 Bottom +4 |
| C | Door Position | Closed | Open |
| D | CHPR | 0 | 0.02 |
| E | Zoom level | -5% | +5% |
| F | Particle Count | -25 | +25 |
| G | Ambient light | On | Off |
One tray size is used for all the fine aggregates, but the user must select the tray color, either clear or opaque, depending on the aggregate size and color. The top or bottom lighting for the fine aggregates is directly related to the tray color; the bottom is used if the tray color is clear and the top light is used if the tray color is opaque. For the clear tray, the bottom light was not able to analyze the images at -4 as was used for the coarse aggregates, therefore the limits were changed to 0 and +4 as shown in Table 2.9. The top lighting was kept at the same limits of +4 and -4. The particle count was added to determine the effect of analyzing more or less than the operational number of particles. The CHPR value was used to eliminate touching particles that could be captured and analyzed as a single particle. The results for the dark and light fine aggregates are shown in Table 2.10 to Table 2.13.
| Angularity | 2D Form | |
|---|---|---|
| Scan 1 | 2733.38 | 7.01 |
| Scan 2 | 2773.50 | 6.90 |
| Scan 3 | 2749.41 | 7.06 |
| Scan 4 | 2728.83 | 7.15 |
| Scan 5 | 4232.48 | 8.84 |
| Scan 6 | 4130.45 | 8.77 |
| Scan 7 | 3974.41 | 8.53 |
| Scan 8 | 3886.20 | 8.54 |
| Scan 9 | 2760.43 | 7.00 |
| Scan 10 | 2750.34 | 6.90 |
| Scan 11 | 2741.02 | 7.04 |
| Scan 12 | 2730.96 | 7.18 |
| Scan 13 | 3933.64 | 8.46 |
| Scan 14 | 4095.74 | 8.76 |
| Scan 15 | 4038.62 | 8.74 |
| Scan 16 | 3984.80 | 8.70 |
| Angularity | 2D Form | |
|---|---|---|
| Scan 1 | 3361.02 | 7.62 |
| Scan 2 | 3395.39 | 7.56 |
| Scan 3 | 3450.58 | 7.77 |
| Scan 4 | 3364.33 | 7.69 |
| Scan 5 | 3518.22 | 7.75 |
| Scan 6 | 3502.52 | 7.84 |
| Scan 7 | 3418.22 | 7.63 |
| Scan 8 | 3493.94 | 7.65 |
| Scan 9 | 3336.29 | 7.57 |
| Scan 10 | 3326.40 | 7.57 |
| Scan 11 | 3392.10 | 7.84 |
| Scan 12 | 3367.07 | 7.66 |
| Scan 13 | 3505.06 | 7.72 |
| Scan 14 | 3520.79 | 7.84 |
| Scan 15 | 3464.49 | 7.62 |
| Scan 16 | 3498.74 | 7.63 |
| Angularity | 2D Form | |
|---|---|---|
| Scan 1 | 3865.54 | 8.07 |
| Scan 2 | 4035.04 | 8.34 |
| Scan 3 | 3888.82 | 7.94 |
| Scan 4 | 3940.66 | 8.19 |
| Scan 5 | 4257.11 | 8.72 |
| Scan 6 | 4524.45 | 9.00 |
| Scan 7 | 4448.05 | 8.69 |
| Scan 8 | 4488.10 | 8.74 |
| Scan 9 | 3932.82 | 8.13 |
| Scan 10 | 4021.97 | 8.23 |
| Scan 11 | 3816.84 | 7.91 |
| Scan 12 | 3923.79 | 8.03 |
| Scan 13 | 4267.24 | 8.74 |
| Scan 14 | 4566.33 | 8.95 |
| Scan 15 | 4444.20 | 8.95 |
| Scan 16 | 4506.22 | 8.76 |
| Angularity | 2D Form | |
|---|---|---|
| Scan 1 | 3476.30 | 7.29 |
| Scan 2 | 3529.06 | 7.23 |
| Scan 3 | 3512.45 | 7.27 |
| Scan 4 | 3490.71 | 7.26 |
| Scan 5 | 3251.36 | 7.38 |
| Scan 6 | 3361.33 | 7.49 |
| Scan 7 | 3215.62 | 7.44 |
| Scan 8 | 3144.88 | 7.42 |
| Scan 9 | 3518.83 | 7.26 |
| Scan 10 | 3518.01 | 7.31 |
| Scan 11 | 3503.70 | 7.27 |
| Scan 12 | 3518.25 | 7.23 |
| Scan 13 | 3230.41 | 7.36 |
| Scan 14 | 3351.78 | 7.57 |
| Scan 15 | 3159.08 | 7.47 |
| Scan 16 | 3180.98 | 7.48 |
The factors, which could cause significant variation based on the limits tested, were identified for the fine aggregates. The summary of the analysis is shown in Table 2.14. The tray color was significant in affecting angularity and 2D form results for both aggregate colors and all sizes. All of the seven factors were significant for either the angularity or the 2D form for one or more of the four fine aggregate samples tested. Since both the AIMS2 door and the ambient light were significant, the AIMS2 doors seem to be assisting to some extent in shedding exterior light. However, replacing the doors to non-transparent should decrease or eliminate the influence of ambient light.
| 1.18 mm (ASTM #16) | 0.60 mm (ASTM #30) | ||||
|---|---|---|---|---|---|
| Dark | Light | Dark | Light | Factors | |
| Angularity | 533994.64 | 1826.07 | 952321.83 | 125990.04 | Tray color |
| NS | NS | NS | 387.33 | Light illumination | |
| NS | NS | 4796.95 | 15.10 | Door Position | |
| NS | 27.78 | 331.31 | 293.74 | CHPR | |
| NS | NS | 13.70 | NS | Zoom level | |
| NS | NS | 349.59 | 75.06 | Particle Count | |
| NS | 8.94 | 60.90 | 13.52 | Ambient light | |
| 2D Form | 241891.77 | 103.93 | 32755.39 | 7789.89 | Tray color |
| NS | NS | 28.00 | NS | Light illumination | |
| NS | NS | 45.84 | 5.76 | Door Position | |
| 6.44 | 9028.55 | NS | NS | CHPR | |
| NS | 384.09 | NS | 34.92 | Zoom level | |
| NS | 77.40 | NS | 32.19 | Particle Count | |
| NS | NS | NS | 9.89 | Ambient light | |
Experiment 3
Additional analyses were performed on the coarse aggregates from Experiment 1 (Figure2.1) to determine the appropriate limits that would not affect the AIMS2 results. In Experiment 3, some of the previous factors from Experiment 1 were removed and the limits of the remaining factors were tightened. A "dummy factor" was introduced to put in place of the removed factors. These "dummy factors" did not change any of the settings. AIMS2 doors factors were not included in Experiment 3 since it was important to focus on the remaining factors. Table 2.15 lists the Experiment 3 coarse aggregate factors and limits. The results of the 9.5 mm (0.375 in) coarse aggregates are shown in Table 2.16 and Table 2.17 for the dark and light aggregates. The effect factors were found to determine the significance of the factors tested. The summary of the effect factors are shown in Table 2.18.
| Factor | Coarse Aggregate Adjusted Study Factors | Low Limit | High Limit |
|---|---|---|---|
| A | Tray size | 9.5 mm | 4.75 mm |
| B | Light illumination (Top light and Bottom light) | -4 | +4 |
| C | "Dummy Factor" | 0 | 0 |
| D | "Dummy Factor" | 0 | 0 |
| E | "Dummy Factor" | 0 | 0 |
| F | Tray Height | -0.5 mm | +0.5 mm |
| G | Ambient light | On | Off |
| Angularity | Texture | Sphericity | Flat or Elongated 3:1 | |
|---|---|---|---|---|
| Scan 1 | 2703.54 | 261.97 | 0.65 | 2.97 |
| Scan 2 | 2570.88 | 261.76 | 0.69 | 2.43 |
| Scan 3 | 2741.46 | 261.72 | 0.70 | 2.41 |
| Scan 4 | 2732.39 | 262.35 | 0.66 | 2.88 |
| Scan 5 | 2630.47 | 270.62 | 0.66 | 2.85 |
| Scan 6 | 2539.57 | 268.44 | 0.69 | 2.41 |
| Scan 7 | 2714.99 | 270.44 | 0.70 | 2.36 |
| Scan 8 | 2688.32 | 268.80 | 0.67 | 2.79 |
| Scan 9 | 2642.89 | 260.08 | 0.65 | 2.93 |
| Scan 10 | 2656.08 | 262.86 | 0.69 | 2.44 |
| Scan 11 | 2689.69 | 261.48 | 0.70 | 2.40 |
| Scan 12 | 2733.28 | 263.37 | 0.66 | 2.89 |
| Scan 13 | 2625.65 | 268.98 | 0.66 | 2.81 |
| Scan 14 | 2608.40 | 269.83 | 0.69 | 2.43 |
| Scan 15 | 2737.52 | 268.91 | 0.70 | 2.35 |
| Scan 16 | 2722.96 | 268.96 | 0.66 | 2.81 |
| Angularity | Texture | Sphericity | Flat or Elongated 3:1 | |
|---|---|---|---|---|
| Scan 1 | 2329.30 | 41.40 | 0.64 | 2.94 |
| Scan 2 | 2374.09 | 41.29 | 0.68 | 2.42 |
| Scan 3 | 2434.67 | 41.28 | 0.68 | 2.38 |
| Scan 4 | 2443.27 | 42.03 | 0.65 | 2.86 |
| Scan 5 | 2349.79 | 40.99 | 0.65 | 2.82 |
| Scan 6 | 2328.91 | 42.29 | 0.68 | 2.40 |
| Scan 7 | 2408.62 | 40.77 | 0.68 | 2.36 |
| Scan 8 | 2371.11 | 40.71 | 0.65 | 2.76 |
| Scan 9 | 2303.40 | 41.79 | 0.64 | 2.96 |
| Scan 10 | 2373.15 | 41.59 | 0.68 | 2.44 |
| Scan 11 | 2406.42 | 40.98 | 0.68 | 2.40 |
| Scan 12 | 2403.76 | 41.64 | 0.65 | 2.88 |
| Scan 13 | 2345.61 | 41.50 | 0.64 | 2.88 |
| Scan 14 | 2325.77 | 41.20 | 0.67 | 2.43 |
| Scan 15 | 2406.41 | 40.74 | 0.69 | 2.34 |
| Scan 16 | 2373.41 | 42.02 | 0.65 | 2.78 |
| Experiment 3 | |||
|---|---|---|---|
| Light | Dark | Factors | |
| Angularity | 64.12 | NS | Tray size |
| 7308.12 | 337.25 | Light illumination | |
| NS | NS | "Dummy Factor" | |
| 9.66 | NS | "Dummy Factor" | |
| 293.44 | NS | "Dummy Factor" | |
| 37.33 | NS | Tray Height | |
| NS | NS | Ambient light | |
| Texture | NS | 13151.15 | Tray size |
| NS | NS | Light illumination | |
| NS | NS | "Dummy Factor" | |
| NS | NS | "Dummy Factor" | |
| NS | NS | "Dummy Factor" | |
| NS | NS | Tray Height | |
| NS | NS | Ambient light | |
| Sphericity | 27.87 | 5344.64 | Tray size |
| 1602.37 | 3849.15 | Light illumination | |
| NS | NS | "Dummy Factor" | |
| 7.79 | NS | "Dummy Factor" | |
| NS | 11.26 | "Dummy Factor" | |
| 847660.40 | 7085309.92 | Tray Height | |
| NS | 21.33 | Ambient light | |
| Flat or Elongated 3:1 | 3753.97 | 746.50 | Tray size |
| 5271.79 | 207.21 | Light illumination | |
| 7.01 | NS | "Dummy Factor" | |
| NS | NS | "Dummy Factor" | |
| NS | NS | "Dummy Factor" | |
| 11256827.41 | 2005250.58 | Tray Height | |
| 480.54 | 42.50 | Ambient light | |
The angularity results of both aggregates (light and dark) showed significant variation to only the light illumination. Several factors for the light aggregate angularity were significant including tray size, tray height and two "dummy factors". The texture results have significant variations due to changes in the tray size only. The sphericity and flat or elongated 3:1 results were affected by changes in the tray size, light illumination, tray height, ambient light, and two "dummy factors".
Experiment 4
Since there were some "dummy factors" shown to be significant in Experiment 3, Experiment 4 was conducted using all factors as "dummy factors." This was done to determine if the normal variations within the AIMS2 system were rugged. The dark, 9.5mm (0.375 in) (Figure 2.1) and light and dark, 0.60 mm (ASTM #30) (Figure 2.3) fine aggregates were used in Experiment 4. In addition, the doors were changed to non-transparent which no longer allowed ambient light into the system. Table 2.19 lists the factors and the limits for Experiment 4. These were the same for the coarse and fine aggregates. The results from Experiment 4 for the coarse and fine aggregates are shown in Table 2.20, Table 2.21, and Table 2.22. The summary of the effect factors are shown in Table 2.23 for the coarse aggregates Table 2.24 for the fine aggregates.
| Factor | Coarse and Fine Aggregate Factors | Low Limit | High Limit |
|---|---|---|---|
| A | "Dummy Factor" | 0 | 0 |
| B | "Dummy Factor" | 0 | 0 |
| C | "Dummy Factor" | 0 | 0 |
| D | "Dummy Factor" | 0 | 0 |
| E | "Dummy Factor" | 0 | 0 |
| F | "Dummy Factor" | 0 | 0 |
| G | "Dummy Factor" | 0 | 0 |
| Angularity | Texture | Sphericity | Flat or Elongated 3:1 | |
|---|---|---|---|---|
| Scan 1 | 2731.88 | 656.32 | 0.66 | 2.78 |
| Scan 2 | 2751.49 | 657.16 | 0.66 | 2.79 |
| Scan 3 | 2719.72 | 660.84 | 0.66 | 2.78 |
| Scan 4 | 2722.21 | 657.90 | 0.67 | 2.73 |
| Scan 5 | 2680.50 | 659.98 | 0.66 | 2.77 |
| Scan 6 | 2697.37 | 658.39 | 0.67 | 2.75 |
| Scan 7 | 2728.48 | 662.15 | 0.66 | 2.78 |
| Scan 8 | 2747.92 | 661.14 | 0.66 | 2.77 |
| Scan 9 | 2702.50 | 661.24 | 0.66 | 2.77 |
| Scan 10 | 2747.12 | 663.30 | 0.66 | 2.76 |
| Scan 11 | 2706.37 | 660.57 | 0.66 | 2.77 |
| Scan 12 | 2719.17 | 657.08 | 0.66 | 2.75 |
| Scan 13 | 2709.70 | 657.85 | 0.66 | 2.76 |
| Scan 14 | 2677.41 | 661.83 | 0.66 | 2.76 |
| Scan 15 | 2730.12 | 661.51 | 0.67 | 2.75 |
| Scan 16 | 2660.21 | 658.07 | 0.67 | 2.73 |
| Angularity | 2D Form | |
|---|---|---|
| Scan 1 | 3841.29 | 7.83 |
| Scan 2 | 3727.50 | 7.72 |
| Scan 3 | 3900.22 | 7.74 |
| Scan 4 | 3772.68 | 7.79 |
| Scan 5 | 3761.00 | 7.80 |
| Scan 6 | 3775.48 | 7.82 |
| Scan 7 | 3712.38 | 7.73 |
| Scan 8 | 3810.79 | 7.78 |
| Scan 9 | 3737.36 | 7.76 |
| Scan 10 | 3815.72 | 7.74 |
| Scan 11 | 3897.90 | 7.82 |
| Scan 12 | 3800.96 | 7.73 |
| Scan 13 | 3845.72 | 7.73 |
| Scan 14 | 3851.68 | 7.79 |
| Scan 15 | 3884.05 | 7.76 |
| Scan 16 | 3892.99 | 7.74 |
| Angularity | 2D Form | |
|---|---|---|
| Scan 1 | 3330.09 | 6.91 |
| Scan 2 | 3241.78 | 6.91 |
| Scan 3 | 3293.31 | 6.94 |
| Scan 4 | 3306.61 | 6.95 |
| Scan 5 | 3318.89 | 6.96 |
| Scan 6 | 3359.40 | 6.95 |
| Scan 7 | 3351.62 | 6.95 |
| Scan 8 | 3326.83 | 6.94 |
| Scan 9 | 3324.90 | 6.95 |
| Scan 10 | 3380.49 | 6.95 |
| Scan 11 | 3376.37 | 6.95 |
| Scan 12 | 3375.59 | 6.96 |
| Scan 13 | 3362.93 | 6.95 |
| Scan 14 | 3410.54 | 6.95 |
| Scan 15 | 3334.68 | 6.93 |
| Scan 16 | 3359.42 | 6.92 |
| Experiment 4 | ||
|---|---|---|
| Dark | Factors | |
| Angularity | NS | "Dummy Factor" |
| NS | "Dummy Factor" | |
| NS | "Dummy Factor" | |
| NS | "Dummy Factor" | |
| NS | "Dummy Factor" | |
| NS | "Dummy Factor" | |
| NS | "Dummy Factor" | |
| Texture | NS | "Dummy Factor" |
| NS | "Dummy Factor" | |
| NS | "Dummy Factor" | |
| NS | "Dummy Factor" | |
| NS | "Dummy Factor" | |
| NS | "Dummy Factor" | |
| NS | "Dummy Factor" | |
| Sphericity | NS | "Dummy Factor" |
| NS | "Dummy Factor" | |
| NS | "Dummy Factor" | |
| NS | "Dummy Factor" | |
| NS | "Dummy Factor" | |
| NS | "Dummy Factor" | |
| NS | "Dummy Factor" | |
| Flat or Elongated 3:1 | NS | "Dummy Factor" |
| NS | "Dummy Factor" | |
| NS | "Dummy Factor" | |
| NS | "Dummy Factor" | |
| NS | "Dummy Factor" | |
| NS | "Dummy Factor" | |
| NS | "Dummy Factor" | |
| Experiment 4 | |||
|---|---|---|---|
| Dark | Light | Factors | |
| Angularity | NS | NS | "Dummy Factor" |
| NS | NS | "Dummy Factor" | |
| NS | NS | "Dummy Factor" | |
| NS | NS | "Dummy Factor" | |
| NS | NS | "Dummy Factor" | |
| NS | NS | "Dummy Factor" | |
| NS | NS | "Dummy Factor" | |
| 2D Form | NS | NS | "Dummy Factor" |
| NS | NS | "Dummy Factor" | |
| NS | NS | "Dummy Factor" | |
| NS | NS | "Dummy Factor" | |
| NS | NS | "Dummy Factor" | |
| NS | NS | "Dummy Factor" | |
| NS | NS | "Dummy Factor" | |
All of the "dummy factors" for the coarse and fine aggregates showed no significance in the results of the system. It can be concluded that AIMS2 is able to control normal variation in the factors and this normal variation does not present a statistically significant influence on the results.
Summary of ASCE ASTM C 1067-00 Ruggedness
The ASTM C 1067-00 ruggedness study has lead to identifying significant factors affecting the AIMS2 results. The AIMS2 transparent doors were not able to control effect of ambient lighting changes as originally predicted, so the doors were replaced with non-transparent doors. The new doors were designed to block any ambient light which was showed to be affecting the results. When all "dummy factors" were used and all of the limits were selected to their correct values, AIMS2 was able to control the normal variations in the system such that the AIMS2 controlled factors have no statistical significant effect on the results.
From the results of Experiments 1 and 2 discussed in this report, some factors were thought to be interacting with each other. This could cause factors effects to be artificially significant. ASTM C 1067-00 assumes that any interactions among factors tested are negligible and therefore not included in the test procedure. However, if the effect of the interactions are not negligible, the estimates of the effect could include be skewed due to interactions. Therefore, it was decided to conduct an additional ruggedness study using ASTM E 1169-07 to have a better understanding of the interaction of the factors.
Ruggedness Analysis Using ASTM E 1169-07
Another ruggedness study was conducted with a new set of ranges to identify factors that significantly influence the measurements provided by the AIMS2 and to estimate possible interaction between factors. The study was carried out in accordance with ASTM E 1169-07, "Standard Practice for Conducting Ruggedness Tests." ASTM E 1169-07 differs from the ASTM C 1067, since ASTM E 1169 is able to identify interactions which may arise from the interference of the individual factors.
Experimental Procedures
The ruggedness test requires 16 total scans of seven factors and specified high and low limits. The last eight scans (scans 9 through 16) are an inverse of the first eight scans (scans 1 through 8). This means that the low limits in scans 1 to 8 are used as the high limits in scans 9 to 16 and vice versa. Table 2.25 shows a template of the 16 scans and the limit levels (high or low) of each factor for all the scans.
| Replicate Scans Number 1 | ||||||||||
|---|---|---|---|---|---|---|---|---|---|---|
| Scan Number | ||||||||||
| Factor | Low Limit | High Limit | 1 | 2 | 3 | 4 | 5 | 6 | 7 | 8 |
| A | a | A | A | a | a | A | a | A | A | a |
| B | b | B | B | B | b | b | B | b | B | b |
| C | c | C | C | C | C | c | c | C | c | c |
| D | d | D | d | D | D | D | d | d | D | d |
| E | e | E | E | e | E | E | E | e | e | e |
| F | f | F | f | F | f | F | F | F | f | f |
| G | g | G | g | g | G | g | G | G | G | g |
| Duplicate Scans | |||||||||||||
|---|---|---|---|---|---|---|---|---|---|---|---|---|---|
| Scan Number | |||||||||||||
| Factor | Low Limit | High Limit | 9 | 10 | 11 | 12 | 13 | 14 | 15 | 16 | |||
| A | a | A | a | A | A | a | A | a | a | A | |||
| B | b | B | b | b | B | B | b | B | b | B | |||
| C | c | C | c | c | c | C | C | c | C | C | |||
| D | d | D | D | d | d | d | D | D | d | D | |||
| E | e | E | E | E | e | e | e | E | E | E | |||
| F | f | F | F | f | F | f | f | f | F | ||||
| G | g | G | G | G | g | G | g | g | g | G | |||
The calculated effect of each factor as explained in ASTM E 1169-07 is used to determine the statistical significance of the factor on the results. As discussed earlier, the ASTM E 1169-07 method considers the interactions between factors in the test as oppose to the ASTM C 1067. If the effect of one factor depends on the level of another factor, then these two factors interacts. As a general rule, factors only interact when factors have large effects or statistical significance by themselves. The suffix –I is used to indicate the two factor interaction. For example, the position of the door and the intensity of the ambient light may be interacting in causing error in the test results or a false increase in a factor’s effect. If an interaction is found, and both the door position and ambient light have large effects, then the interaction is mostly likely caused by these two factors. In this case, the door position and ambient light will typically be found to be statistically significant. If for the interaction, there are no possible factors with large individual effects, then the cause of the interaction may be unclear. The unclear interactions could be caused by more than one set of two factor interactions. The list of possible two factor interactions for each interaction effect is shown in Table 2.26. ASTM E 1169-07 contains the required details to calculate the effect factor and interaction for the different main factors.
| Interaction | Possible Causes | ||
|---|---|---|---|
| A-I | BF | CD | EG |
| B-I | AF | CG | DE |
| C-I | AD | BG | EF |
| D-I | AC | BE | FG |
| E-I | AG | BD | CF |
| F-I | AB | CE | DG |
| G-I | AE | BC | DF |
In order to determine the significant factors and interaction, effect factors are plotted on a half-normal plot. A half-normal plot is an analytical test for revealing the presence of outliers by comparing the residuals from the data to the expected observed values from a normal distribution. Both the residuals and expected values are ordered. Points from the plot usually align along a straight line. The values that do not fall along the line and are in the top right of the plot are considered outliers. The half normal plot is much like a normal probably plot, except the outliers of the sample appear only in to upper right corner of the plot instead of at both ends.4
A linear line to represent the standard error for the estimates is drawn through the smallest effects, which are linearly orientated. Potential significant effect factors are those which fall farthest to the right of the standard error line. The statistical significance of factors that lie close, but are to the right of the standard error line were considered to be unclear.
Several experiments were conducted using both coarse and fine aggregates with different limits until the method was concluded to be rugged. Experiments 5 and 6 dealt with coarse aggregate, while Experiment 7 and 8 were for the fine aggregates. Experiment 9 was conducted to further investigate the influence of narrowing the limits of factors used in Experiment 6 on the aggregate height measurements. Replicate measurements of the aggregate height dimensions were compared to determine the ability of AIMS2 to produce replicate measurements for different types and sizes of coarse aggregates in Experiment 10. A summary of the experiments is shown in Table 2.27.
| Experiment | Purpose of the Experiment | Aggregate Sizes |
|---|---|---|
| 5 | Study to Determine the Appropriate Limits for a Rugged System | 9.5 mm (0.375 in) and 4.75mm (ASTM #4 sieve) |
| 6 | Based on Experiment 5, a Further Investigation of the Limits | 9.5 mm (0.375 in) and 4.75mm (ASTM #4 sieve) |
| 7 | Study to Determine the Appropriate Limits for a Rugged System | 1.18 mm (ASTM #16 sieve) and 0.15 mm (ASTM #100 sieve) |
| 8 | Based on Experiment 7, a Further Investigation of the Limits | 1.18 mm (ASTM #16 sieve) and 0.15 mm (ASTM #100 sieve) |
| 9 | Further Investigation of the Limits that Affect the Aggregate Height Measurements from Experiment 6 | 9.5 mm (0.375 in) and 4.75mm (ASTM #4 sieve) |
| 10 | Comparison of Replicate Height Measurements Gather by AIMS2 | 25.0 mm (1.0 in) to 4.75mm (ASTM #4 sieve) |
Experiment 5
Experiment 5 was carried out on two different coarse aggregates (a dark-colored aggregate and a light-colored aggregate) with a size of 9.5 mm (0.375 in) (Figure 2.4). Table 2.28 lists the factors and limits chosen for this experiment.
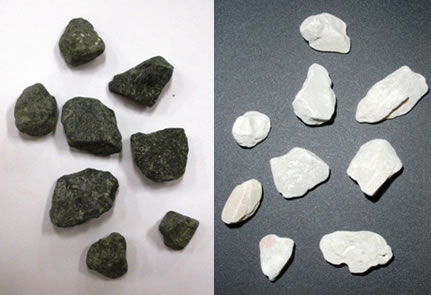
Figure 2.4. Dark and light 9.5 mm (0.375 in) aggregates used in Experiment 5.
| Factor | Coarse Aggregate Study Factors: | Low Limit | High Limit |
|---|---|---|---|
| A | Light Illumination | -1 | +1 |
| B | Tray Height | -0.25 mm | +0.25 mm |
| C | Tray Size | 4.75 mm | 9.5 mm |
| D | Door Position | Open | Closed |
| E | Ambient Light | Off | On |
| F | Zoom Level | -1% | +1% |
| G | Focus (DOF) | 1% | 0% |
The limits of the light illumination were selected as +1 and -1 light intensity from the operational setting which are used to decrease and increase light illumination setting of the system. The limits for the tray size were selected as the correct tray size, 9.5 mm, and one tray size below the correct tray size, 4.75 mm. The ambient light, either on or off, was included in order to consider the performance of the doors in eliminating the effect of changes in exterior lighting. The positions of the door limits were selected as completely closed or completely open. The focus, zoom level, and tray height limits were chosen to evaluate the acceptable variability for each factor.
Table 2.29 summarizes the texture, angularity, and sphericity results for the dark coarse aggregate. The light coarse aggregate results are summarized in Table 2.30.
| Angularity | Texture | Sphericity | |
|---|---|---|---|
| Scan 1 | 2755.46 | 649.97 | 0.683 |
| Scan 2 | 2634.78 | 650.33 | 0.673 |
| Scan 3 | 2615.31 | 661.51 | 0.692 |
| Scan 4 | 2680.15 | 667.60 | 0.702 |
| Scan 5 | 2677.53 | 661.01 | 0.679 |
| Scan 6 | 2703.25 | 658.79 | 0.699 |
| Scan 7 | 2701.79 | 660.62 | 0.686 |
| Scan 8 | 2649.91 | 659.61 | 0.700 |
| Scan 9 | 2648.56 | 664.01 | 0.694 |
| Scan 10 | 2693.35 | 657.70 | 0.702 |
| Scan 11 | 2695.93 | 664.36 | 0.682 |
| Scan 12 | 2623.58 | 654.00 | 0.677 |
| Scan 13 | 2697.51 | 653.63 | 0.703 |
| Scan 14 | 2647.31 | 657.26 | 0.681 |
| Scan 15 | 2664.08 | 655.03 | 0.697 |
| Scan 16 | 2714.22 | 658.51 | 0.672 |
| Angularity | Texture | Sphericity | |
|---|---|---|---|
| Scan 1 | 2369.09 | 108.08 | 0.663 |
| Scan 2 | 2270.35 | 105.52 | 0.660 |
| Scan 3 | 2319.58 | 108.62 | 0.682 |
| Scan 4 | 2487.44 | 102.65 | 0.691 |
| Scan 5 | 2407.35 | 100.73 | 0.668 |
| Scan 6 | 2368.62 | 104.98 | 0.680 |
| Scan 7 | 2467.20 | 102.23 | 0.676 |
| Scan 8 | 2433.93 | 102.35 | 0.688 |
| Scan 9 | 2420.17 | 101.37 | 0.684 |
| Scan 10 | 2439.31 | 102.18 | 0.694 |
| Scan 11 | 2493.94 | 101.67 | 0.673 |
| Scan 12 | 2352.91 | 106.55 | 0.664 |
| Scan 13 | 2366.58 | 107.07 | 0.688 |
| Scan 14 | 2399.35 | 102.62 | 0.672 |
| Scan 15 | 2353.66 | 106.14 | 0.677 |
| Scan 16 | 2417.20 | 107.34 | 0.664 |
Figure 2.5, Figure 2.6, and Figure 2.7 show the half-normal plot for the dark aggregates angularity, texture, and sphericity, respectively, while the light aggregate plots are shown in Figure 2.8, Figure 2.9, and Figure 2.10.
From the half-normal plots of the dark aggregate, three factors show to be statistically significant, one for each of the shape characteristics. Light illumination, Factor A, appears to affect the angularity results (Figure 2.5); tray size, Factor C, appears to be statistically significant for the texture results (Figure 2.6); and the sphericity results are affected by tray height, Factor B (Figure 2.7).
The factors tested appear to affect the light coarse aggregate results more than the dark-colored aggregate results. The angularity results were affected by tray size (Factor C) and light illumination (Factor A), and by several interaction factors, Factor C-I, F-I, and B-I (Figure 2.8). The most likely cause for the large C-I interaction factor was the AD interaction since A (light illumination) and D (door position) have large main effects. The interaction AB (light illumination and tray height) or CE (tray size and ambient light) was most likely the cause for the large F-1 factor; the interaction AF (light illumination and zoom level) was most likely the cause of the large B-1 factor. The significance of Factors D (door position), F (zoom level), A-1 and E-1 were unclear. Factor C, tray size, appears to be statistically significant for the texture results (Figure2.9). It was not clear whether the zoom level, Factor F, has a significant effect of the texture results or not. The sphericity results appears to be affected by Factors B, C, A, and F which were tray height, tray size, light illumination, and zoom level, respectively (Figure 2.10).
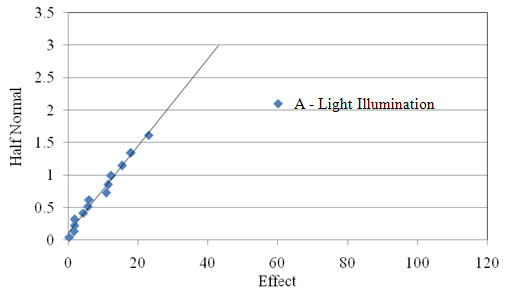
Figure 2.5. Half-normal plot of the angularity of the dark 9.5 mm (0.375 in) coarse aggregate used in Experiment 5.
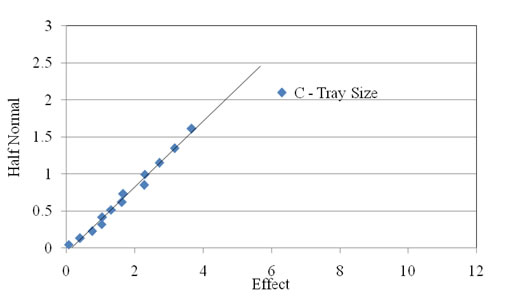
Figure 2.6. Half-normal plot of the texture of the dark 9.5 mm (0.375 in) coarse aggregate used in Experiment 5.
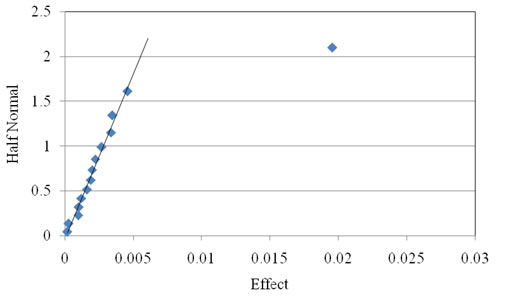
Figure 2.7. Half-normal plot of the sphericity of the dark 9.5 mm (0.375 in) coarse aggregate used in Experiment 5.
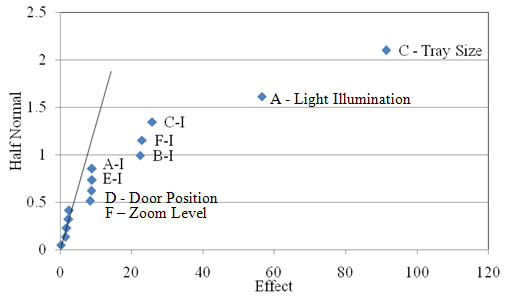
Figure 2.8. Half-normal plot of the angularity of the light 9.5 mm (0.375 in) coarse aggregate used in Experiment 5.
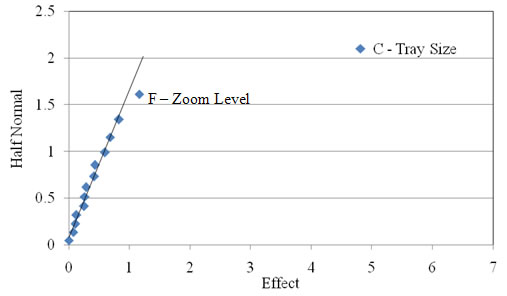
Figure 2.9. Half-normal plot of the texture of the light 9.5 mm (0.375 in) coarse aggregate used in Experiment 5.
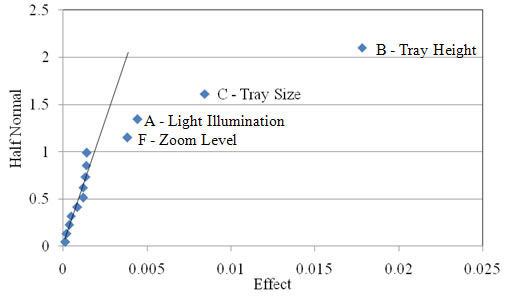
Figure 2.10. Half-normal plot of the sphericity of the light 9.5 mm (0.375 in) coarse aggregate used in Experiment 5.
An additional coarse size 4.75 mm (ASTM #4 sieve) was tested to confirm the results of the 9.5 mm size aggregate (0.375 in). Since more of the factors tested were significant for the light-colored aggregate than the dark-colored aggregate, only a light-colored aggregate was tested (Figure 2.11). The factors and limits were the same as the 9.5 mm (0.375 in) aggregates (Table 2.28). Since the aggregate size tested changed from 9.5mm (0.375 in) to 4.75 mm (ASTM #4 sieve), the tray size limits with respect to the aggregate size were different. For the 9.5 mm (0.375 in) aggregate, the trays used were the correct size (9.5 mm) and one tray size smaller (4.75 mm). For the 4.7 5mm (ASTM #4 sieve), the trays used were the correct size (4.75 mm) and one tray size larger (9.5mm). Table2.31 shows a summary of the texture, angularity, and sphericity results.
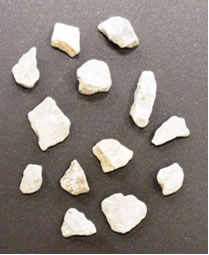
Figure 2.11. Light 4.75 mm (ASTM #4 sieve) aggregates used in Experiment 5.
| Scan | Angularity | Texture | Sphericity |
|---|---|---|---|
| Scan 1 | 2810.54 | 161.75 | 0.628 |
| Scan 2 | 2688.51 | 160.94 | 0.619 |
| Scan 3 | 2761.23 | 160.40 | 0.646 |
| Scan 4 | 2775.79 | 163.57 | 0.602 |
| Scan 5 | 2719.65 | 161.70 | 0.576 |
| Scan 6 | 2744.61 | 157.84 | 0.654 |
| Scan 7 | 2759.47 | 161.88 | 0.584 |
| Scan 8 | 2620.12 | 162.98 | 0.596 |
| Scan 9 | 2770.68 | 162.44 | 0.593 |
| Scan 10 | 2788.08 | 163.88 | 0.605 |
| Scan 11 | 2748.26 | 161.48 | 0.581 |
| Scan 12 | 2695.06 | 162.04 | 0.615 |
| Scan 13 | 2789.61 | 163.93 | 0.653 |
| Scan 14 | 2678.55 | 164.21 | 0.577 |
| Scan 15 | 2710.44 | 155.26 | 0.644 |
| Scan 16 | 2805.75 | 155.61 | 0.625 |
The half-normal plots for the angularity, texture, and sphericity are shown in Figure2.12, Figure 2.13, and Figure 2.14 respectively.
The light 4.75 mm (ASTM #4 sieve) aggregates were affected by several of the same factors that affected the light and dark 9.5 mm (0.375 in) aggregates. The light illumination (Factor A) was statistically significant for the angularity results (Figure2.12). For the texture results (Figure 2.13), the main factors, tray size (Factor C) and zoom level (Factor F) were statistical significant. The interaction Factors F-I and E-I were statistically significant, which were caused most likely by the interactions CE (tray size and ambient light) and CF (tray size and zoom level), respectively. The sphericity results were affected by Factor C (tray size), Factor B (tray height), Factor A (light illumination), and G-I. The G-I interaction was probably caused be the interaction BC (tray size and tray height) (Figure 2.14).
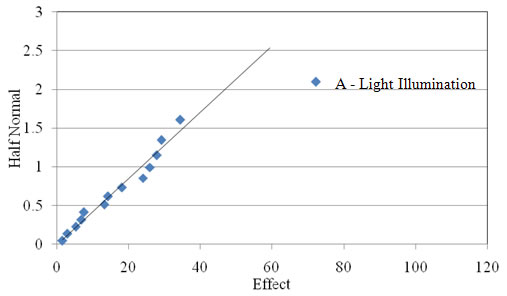
Figure 2.12. Half-normal plot of the angularity of the light 4.75 mm (ASTM #4 sieve) coarse aggregate used in Experiment 5.
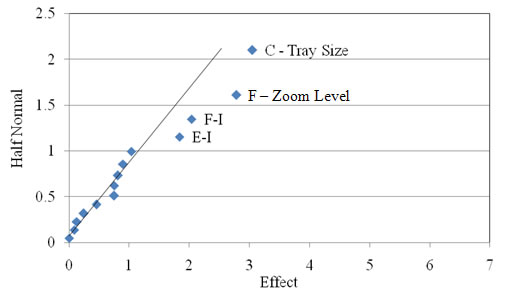
Figure 2.13. Half-normal plot of the texture of the light 4.75 mm (ASTM #4 sieve) coarse aggregate used in Experiment 5.
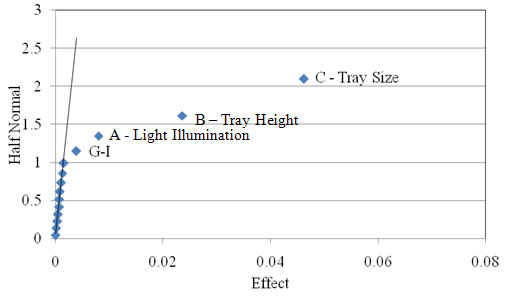
Figure 2.14. Half-normal plot of the sphericity of the light 4.75 mm (ASTM #4 sieve) coarse aggregate used in Experiment 5.
Overall for the 9.5 mm (0.375 in) and 4.75 mm (ASTM #4 sieve) coarse aggregates, light illumination (Factor A), tray height (Factor B), tray size (Factor C), and zoom level (Factor F) were statistically significant using the limits tested. Other factors that appeared to be statistically significant were C-I (AD), F-I (AB or CE), B-I (AF), F-I (CE), D-I (CF), and G-I (BC).
Experiment 6
This experiment was carried out to further investigate acceptable ranges for the factors that were found to be statistically significant in affecting the coarse aggregates based on the results of Experiment 5. These factors are light illumination (Factor A), tray height (Factor B), and zoom level (Factor F). The new, tighter, factor ranges are shown in Table 2.32. For Experiment 6, the same two aggregates as in Experiment 5 (Figure2.4) were tested: a dark-colored 9.5 mm (0.375 in) and a light-colored 9.5 mm (0.375 in) size aggregate. The summary of the results for the angularity, texture, and sphericity are shown in Table 2.33 and Table 2.34.
| Factor | Coarse Aggregate Study Factors: | Low Limit | High Limit |
|---|---|---|---|
| A | Light illumination | -1 | 0 |
| B | Tray Height | -0.10 mm | 0.10 mm |
| C | Tray Size | 4.75 mm | 9.5 mm |
| D | Door Position | Open | Closed |
| E | Ambient Light | Off | On |
| F | Zoom Level | -0.5% | +0.5% |
| G | Focus (DOF) | 1% | 0% |
| Angularity | Texture | Sphericity | |
|---|---|---|---|
| Scan 1 | 2633.74 | 635.27 | 0.680 |
| Scan 2 | 2679.19 | 639.65 | 0.678 |
| Scan 3 | 2622.26 | 635.84 | 0.685 |
| Scan 4 | 2655.28 | 631.71 | 0.687 |
| Scan 5 | 2719.17 | 630.36 | 0.677 |
| Scan 6 | 2669.10 | 633.06 | 0.684 |
| Scan 7 | 2678.98 | 630.07 | 0.680 |
| Scan 8 | 2678.43 | 624.20 | 0.689 |
| Scan 9 | 2743.88 | 634.66 | 0.684 |
| Scan 10 | 2637.89 | 620.24 | 0.688 |
| Scan 11 | 2676.12 | 630.75 | 0.682 |
| Scan 12 | 2660.87 | 634.31 | 0.679 |
| Scan 13 | 2701.93 | 634.88 | 0.687 |
| Scan 14 | 2709.30 | 632.69 | 0.681 |
| Scan 15 | 2659.13 | 631.22 | 0.685 |
| Scan 16 | 2689.69 | 635.59 | 0.677 |
| Angularity | Texture | Sphericity | |
|---|---|---|---|
| Scan 1 | 2462.38 | 106.35 | 0.666 |
| Scan 2 | 2388.29 | 103.94 | 0.666 |
| Scan 3 | 2417.29 | 105.75 | 0.670 |
| Scan 4 | 2337.13 | 101.59 | 0.683 |
| Scan 5 | 2444.97 | 100.00 | 0.676 |
| Scan 6 | 2390.14 | 104.24 | 0.672 |
| Scan 7 | 2379.26 | 100.83 | 0.677 |
| Scan 8 | 2343.70 | 100.86 | 0.684 |
| Scan 9 | 2358.73 | 100.76 | 0.682 |
| Scan 10 | 2367.75 | 100.63 | 0.685 |
| Scan 11 | 2364.89 | 100.46 | 0.677 |
| Scan 12 | 2471.44 | 103.52 | 0.666 |
| Scan 13 | 2482.36 | 105.35 | 0.674 |
| Scan 14 | 2391.33 | 100.95 | 0.679 |
| Scan 15 | 2357.64 | 103.94 | 0.671 |
| Scan 16 | 2446.15 | 104.02 | 0.665 |
The half-normal plots for the 9.5 mm (0.375 in) dark aggregate are shown in Figure 2.15, Figure 2.16, and Figure 2.17 for angularity, texture, and sphericity, respectively. The 9.5 mm (0.375 in) light aggregate plots are shown in Figure 2.18, Figure 2.19, and Figure2.20.
As result of using tighter ranges, the statistical significance of Factor A (light illumination), Factor B (tray height), and Factor F (zoom level) decreased or were no longer significant compared to Experiment 5. The texture and sphericity results were both affected by Factor C (tray size), as shown in Figure 2.16 and Figure 2.17. Factor D, door position, was also found to be statistically significant for the texture results (Figure2.16).
The light-colored aggregates texture and sphericity results were affected by Factor C, (tray size) (Figure 2.19 and Figure 2.20), and sphericity results were affected by Factor B (tray height) (Figure 2.20). No interaction factors were found to be statistically significant in Experiment 6. This was most likely due to the decrease in the effects of the main factors.
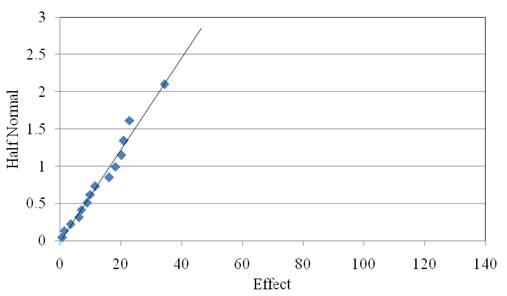
Figure 2.15. Half-normal plot of the angularity of the dark 9.5 mm (0.375 in) coarse aggregate used in Experiment 6.
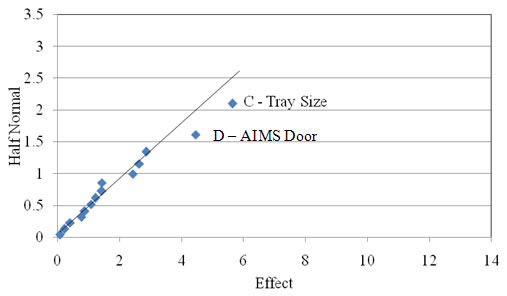
Figure 2.16. Half-normal plot of the texture of the dark 9.5 mm (0.375 in) coarse aggregate used in Experiment 6.
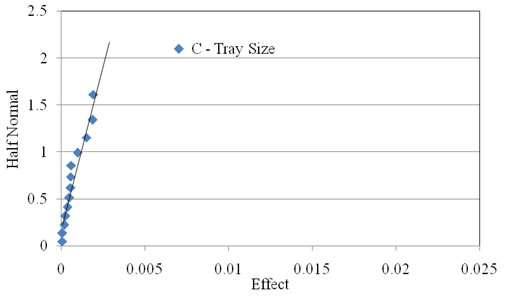
Figure 2.17. Half-normal plot of the sphericity of the dark 9.5 mm (0.375 in) coarse aggregate used in Experiment 6.
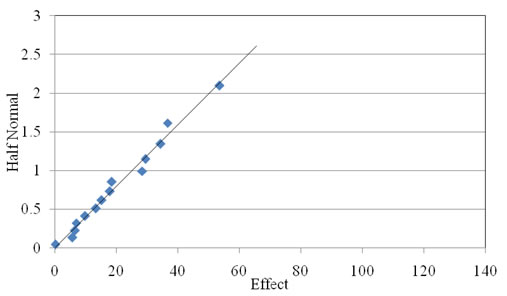
Figure 2.18. Half-normal plot of the angularity of the light 9.5 mm (0.375 in) coarse aggregate used in Experiment 6.
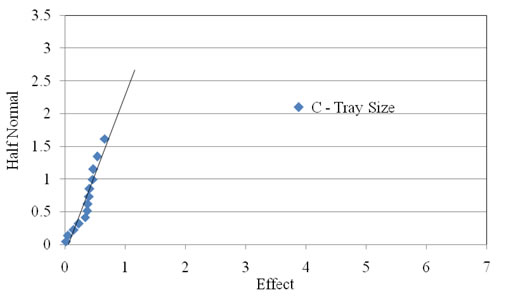
Figure 2.19. Half-normal plot of the texture of the light 9.5 mm (0.375 in) coarse aggregate used in Experiment 6. B – Tray Height
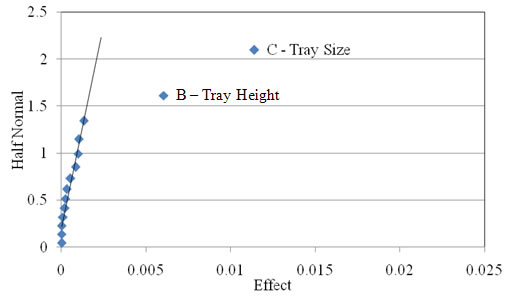
Figure 2.20. Half-normal plot of the sphericity of the light 9.5 mm (0.375 in) coarse aggregate used in Experiment 6.
The results from 9.5 mm (0.375 in) aggregates were confirmed using a light-colored 4.75 mm (ASTM #4 sieve) aggregate. All the factors remained the same as in Table2.32. The same light-colored 4.75 mm (ASTM #4 sieve) aggregate used in Experiment 5, was used for Experiment 6 (Figure 2.11). A summary of the angularity, texture, and sphericity results are listed in Table 2.35.
| Angularity | Texture | Sphericity | |
|---|---|---|---|
| Scan 1 | 2797.52 | 162.39 | 0.637 |
| Scan 2 | 2818.41 | 158.53 | 0.629 |
| Scan 3 | 2709.42 | 159.88 | 0.642 |
| Scan 4 | 2861.97 | 161.43 | 0.592 |
| Scan 5 | 2860.93 | 163.56 | 0.584 |
| Scan 6 | 2785.88 | 158.19 | 0.645 |
| Scan 7 | 2760.69 | 166.19 | 0.583 |
| Scan 8 | 2779.38 | 162.63 | 0.595 |
| Scan 9 | 2804.20 | 161.23 | 0.590 |
| Scan 10 | 2851.35 | 163.00 | 0.597 |
| Scan 11 | 2838.03 | 161.50 | 0.582 |
| Scan 12 | 2757.61 | 159.12 | 0.634 |
| Scan 13 | 2830.00 | 158.26 | 0.645 |
| Scan 14 | 2801.37 | 162.29 | 0.583 |
| Scan 15 | 2785.70 | 158.51 | 0.642 |
| Scan 16 | 2777.80 | 157.08 | 0.635 |
Figure 2.21, Figure 2.22, and Figure 2.23 show the half-normal plots of the 4.75 mm (ASTM #4 sieve) light aggregates. The results for the 4.75 mm (ASTM #4 sieve) light aggregates were the same as the 9.5 mm (0.375 in) light aggregate. Factor C (tray size) was statistically significant for the texture results (Figure 2.22). The sphericity results were affected by Factor C (tray size) and Factor B (tray height) (Figure 2.23).
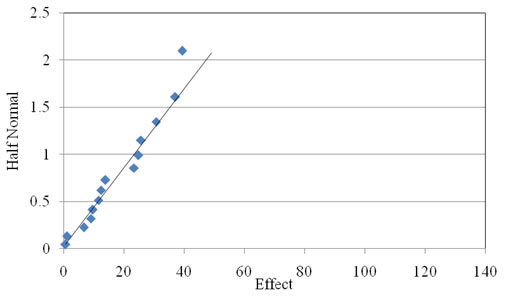
Figure 2.21. Half-normal plot of the angularity of the light 4.75 mm (ASTM #4 sieve) coarse aggregate used in Experiment 6.
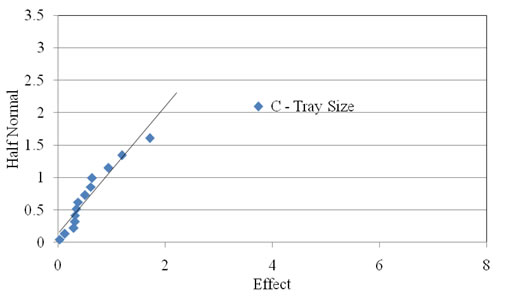
Figure 2.22. Half-normal plot of the texture of the light 4.75 mm (ASTM #4 sieve) coarse aggregate used in Experiment 6. B – Tray Height
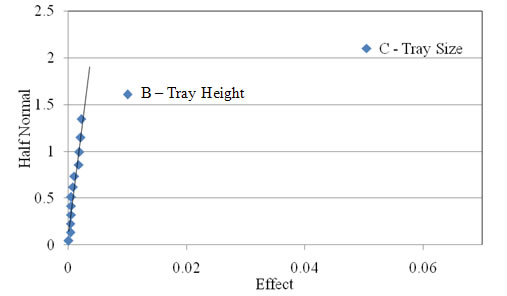
Figure 2.23. Half-normal plot of the sphericity of the light 4.75 mm (ASTM #4 sieve) coarse aggregate used in Experiment 6.
Overall tray height (Factor B), tray size (Factor C), and door position (Factor D) were statistically significant using the limits tested. No interaction factors were found to be significant in Experiment 6.
Experiment 7
This experiment was conducted using 2 different fine aggregates, a dark-colored and light-colored 1.18 mm (ASTM #16 sieve) aggregate (Figure 2.24). The factors and limits chosen are listed in Table 2.36. Results from the 16 scans for 1.18 mm (ASTM #16 sieve) aggregates are shown in Table 2.37 and Table 2.38 for the dark- and light-colored aggregates.
| Dark Aggregate | Light Aggregate |
 |
|
Figure 2.24. Dark and light 1.18 mm (ASTM #16 sieve) aggregates used in Experiment 7.
| Factor | Fine Aggregate Factors: | Low Limit | High Limit |
|---|---|---|---|
| A | Light Illumination | -1 | +1 |
| B | CHPR | -0.01 | 0 |
| C | Tray Color | Clear | Opaque |
| D | Door Position | Open | Closed |
| E | Ambient Light | Off | On |
| F | Zoom Level | -1% | +1% |
| G | Tray Height | -0.25 | +0.25 |
| Angularity | Form 2D | |
|---|---|---|
| Scan 1 | 3620.32 | 8.32 |
| Scan 2 | 4187.16 | 8.39 |
| Scan 3 | 4113.90 | 7.85 |
| Scan 4 | 2781.27 | 7.54 |
| Scan 5 | 2730.92 | 7.47 |
| Scan 6 | 3769.39 | 8.20 |
| Scan 7 | 2747.03 | 7.56 |
| Scan 8 | 2768.94 | 7.51 |
| Scan 9 | 2734.15 | 7.46 |
| Scan 10 | 2803.33 | 7.54 |
| Scan 11 | 2721.16 | 7.50 |
| Scan 12 | 3936.83 | 8.25 |
| Scan 13 | 3527.07 | 8.24 |
| Scan 14 | 2804.73 | 7.47 |
| Scan 15 | 3891.67 | 8.02 |
| Scan 16 | 3698.28 | 8.29 |
| Angularity | Form 2D | |
|---|---|---|
| Scan 1 | 3301.83 | 7.43 |
| Scan 2 | 3634.56 | 7.81 |
| Scan 3 | 3552.14 | 7.67 |
| Scan 4 | 3266.17 | 7.48 |
| Scan 5 | 3242.04 | 7.47 |
| Scan 6 | 3284.80 | 7.36 |
| Scan 7 | 3304.95 | 7.49 |
| Scan 8 | 3228.74 | 7.39 |
| Scan 9 | 3237.06 | 7.44 |
| Scan 10 | 3336.02 | 7.45 |
| Scan 11 | 3314.50 | 7.52 |
| Scan 12 | 3605.44 | 7.69 |
| Scan 13 | 3290.79 | 7.33 |
| Scan 14 | 3296.94 | 7.46 |
| Scan 15 | 3589.77 | 7.75 |
| Scan 16 | 3383.13 | 7.54 |
Figure 2.25 and Figure 2.26 show the half-normal plot of the angularity and 2D form, respectively, for the 1.18 mm (ASTM #16 sieve) dark aggregate. Similar plots for the 1.18 mm (ASTM #16 sieve) light aggregate are presented in Figure 2.27 and Figure2.28.
The dark aggregate angularity results were affected by Factor C (tray color), Factor A (light illumination), and D-I (Figure 2.25). The most likely cause of D-I was the interaction between Factors A (tray color) and C (light illumination). Figure 2.26 shows that the 2D Form results were affected by Factor C (tray color).
For the 1.18 mm (ASTM #16 sieve) light aggregates, Factor C (tray color), Factor D-I, Factor A (light illumination), Factor B (CHPR), and Factor E-I appear to be statistical significant for the angularity results (Figure 2.27). The interaction between Factors A (light illumination) and C (tray color), most likely was the cause for D-I. The interaction AG (light illumination and tray height), BD (CHPR and door position), or CF (tray color and zoom level) could be the cause of the larger E-I interaction. The 2D Form results appear to be affected by Factor D-I, Factor A (light illumination), Factor C (tray color), Factor B (CHPR), and Factor F (zoom level) (Figure 2.28). Again the most likely cause for the large D-I interaction was the AC (light illumination and tray color) interaction.
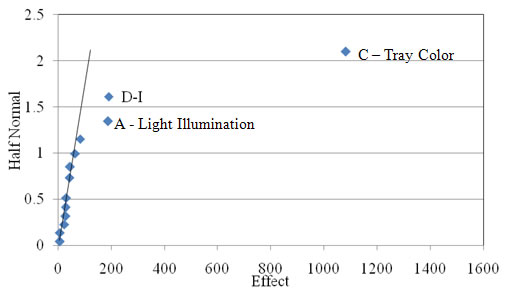
Figure 2.25. Half-normal plot of the angularity of the dark 1.18 mm (ASTM #16 sieve) fine aggregate used in Experiment 7. C – Tray Color
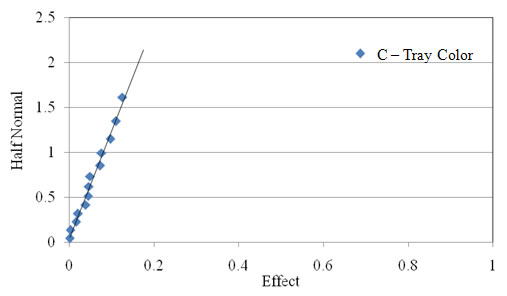
Figure 2.26. Half-normal plot of the 2D form of the dark 1.18 mm (ASTM #16 sieve) fine aggregate used in Experiment 7.
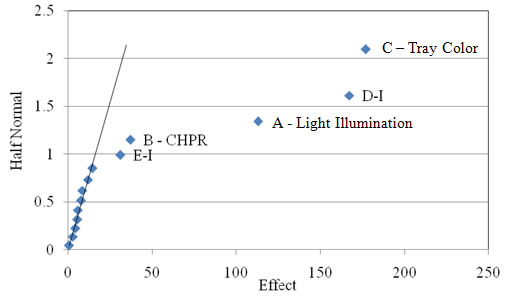
Figure 2.27. Half-normal plot of the angularity of the light 1.18 mm (ASTM #16 sieve) fine aggregate used in Experiment 7.
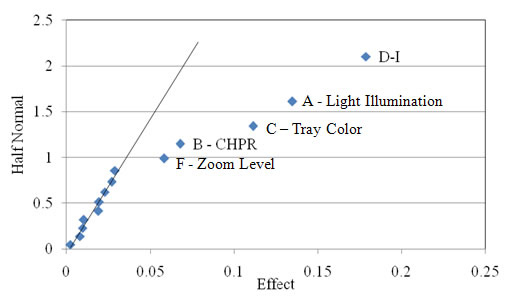
Figure 2.28. Half-normal plot of the 2D form of the light 1.18 mm (ASTM #16 sieve) fine aggregate used in Experiment 7.
The factors and limits used for the 1.18 mm (ASTM #16 sieve) fine aggregates were tested on an additional fine aggregates size, 0.15 mm (ASTM #100 sieve), to confirm the results. For 0.15 mm (ASTM #100 sieve) aggregates, only a light-colored aggregate (Figure 2.29) was studied since the light-colored aggregates seemed to be more affected by the changes in the different factors. Table 2.39 summarizes the angularity and 2D form results.
| Light Aggregate |
 |
Figure 2.29. Light 0.15 mm (ASTM #100 sieve) aggregates used in Experiment 7.
| Angularity | Form 2D | |
|---|---|---|
| Scan 1 | 1877.54 | 6.13 |
| Scan 2 | 2254.86 | 6.67 |
| Scan 3 | 2235.24 | 6.61 |
| Scan 4 | 2316.97 | 6.48 |
| Scan 5 | 2670.46 | 6.61 |
| Scan 6 | 1843.51 | 6.12 |
| Scan 7 | 2569.78 | 6.67 |
| Scan 8 | 2475.31 | 6.47 |
| Scan 9 | 2566.89 | 6.50 |
| Scan 10 | 2508.76 | 6.67 |
| Scan 11 | 2371.79 | 6.59 |
| Scan 12 | 2278.66 | 6.54 |
| Scan 13 | 1863.52 | 6.09 |
| Scan 14 | 2427.32 | 6.41 |
| Scan 15 | 2344.11 | 6.67 |
| Scan 16 | 1777.83 | 5.97 |
The half-normal plot for the angularity and 2D form for the 0.15 mm (ASTM #100 sieve) are shown in Figure 2.30 and Figure 2.31, respectively.
The plot in Figure 2.30 indicates that tray color (Factor C), light illumination (Factor A), tray height (Factor G), door position (Factor D), Factor D-I, and Factor B-I were statistically significant for the angularity results. The interaction D-I was most likely caused be the interaction AC (light illumination and tray color). The interaction between C and F (tray color and door position) were the most likely cause for the high B-I factor. The effects of Factors G-I and C-I were unclear. The 2D form results were affected by Factor A (light illumination), Factor C (tray color), Factor D-I, and Factor B-I (Figure2.31). The interactions D-I and B-I were most likely caused by AC (light illumination and tray color) and CF (tray color and door position), respectively. These interactions were the same as the angularity results. The statistically significance of Factor D (door position) and Factor G-I were unclear.
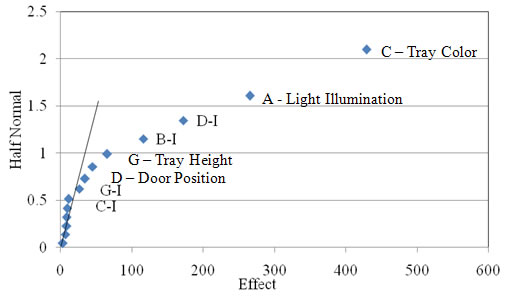
Figure 2.30. Half-normal plot of the angularity of the light 0.15 mm (ASTM #100 sieve) fine aggregate used in Experiment 7.
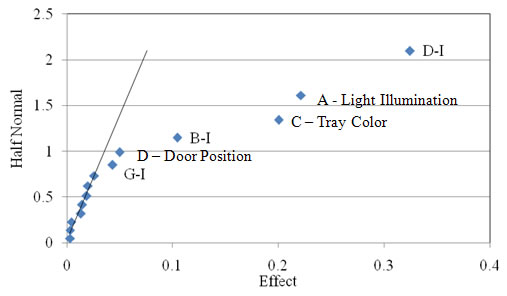
Figure 2.31. Half-normal plot of the 2D form of the light 0.15 mm (ASTM #100 sieve) fine aggregate used in Experiment 7.
In summary, for Experiment 7, Factors A, B, C, D, F, and G (light illumination, CHPR, tray color, door position, zoom level, and tray height) were statistical significant for the limits tested. Other factors that appeared to be significant due to interactions of the main factors were factors D-I (AC), E-I (AG, BD, or CF), and B-I (CG).
Experiment 8
The aim of this experiment was to investigate the effect of tightening the limits of the factors (A, B, F, and G) that showed statistical significance in Experiment 7. Table 2.40 lists the new limits for these factors. The tray color factor was removed and replaced with tray size for the analysis. The same aggregates used in Experiment 7 were used in this experiment, a dark- and light-colored 1.18 mm (ASTM #16 sieve) aggregate (Figure2.24). The results from these two aggregates are shown in Table 2.41 and Table 2.42.
| Factor | Fine Aggregate Factors: | Low Limit | High Limit |
|---|---|---|---|
| A | Light illumination | -1 | 0 |
| B | CHPR | -0.01 | 0 |
| C | Tray Size | 12.5 mm | 19 mm |
| D | Door Position | Open | Closed |
| E | Ambient Light | Off | On |
| F | Zoom Level | -0.5% | +0.5% |
| G | Tray Height | -0.10 mm | +0.10 mm |
| Angularity | Form 2D | |
|---|---|---|
| Scan 1 | 2806.59 | 7.22 |
| Scan 2 | 2757.55 | 7.17 |
| Scan 3 | 2765.31 | 7.18 |
| Scan 4 | 2897.77 | 7.56 |
| Scan 5 | 2915.38 | 7.55 |
| Scan 6 | 2798.36 | 7.20 |
| Scan 7 | 2932.93 | 7.57 |
| Scan 8 | 2902.82 | 7.64 |
| Scan 9 | 2912.24 | 7.53 |
| Scan 10 | 2924.59 | 7.61 |
| Scan 11 | 2935.47 | 7.64 |
| Scan 12 | 2787.75 | 7.24 |
| Scan 13 | 2766.95 | 7.19 |
| Scan 14 | 2896.07 | 7.63 |
| Scan 15 | 2809.58 | 7.20 |
| Scan 16 | 2810.88 | 7.22 |
| Angularity | Form 2D | |
|---|---|---|
| Scan 1 | 3271.76 | 7.37 |
| Scan 2 | 3266.46 | 7.41 |
| Scan 3 | 3256.10 | 7.34 |
| Scan 4 | 3304.98 | 7.56 |
| Scan 5 | 3337.61 | 7.57 |
| Scan 6 | 3287.02 | 7.37 |
| Scan 7 | 3275.73 | 7.56 |
| Scan 8 | 3234.57 | 7.51 |
| Scan 9 | 3330.38 | 7.49 |
| Scan 10 | 3255.30 | 7.54 |
| Scan 11 | 3307.82 | 7.60 |
| Scan 12 | 3274.35 | 7.35 |
| Scan 13 | 3261.85 | 7.40 |
| Scan 14 | 3282.11 | 7.57 |
| Scan 15 | 3263.61 | 7.37 |
| Scan 16 | 3343.92 | 7.43 |
The half-normal plot for each shape characteristic parameter (Angularity and 2D Form) of the 1.18 mm (ASTM #16 sieve) dark aggregate are shown in Figure 2.32 and Figure2.33. Figure 2.34 and Figure 2.35 show the half-normal plots for the 1.18 mm (ASTM #16 sieve) light aggregate.
The statistical significance of the factors decreased due to the tighter limits used in this experiment. For angularity and 2D form results of the dark aggregates (Figure 2.32 and Figure 2.33), the only statistically significant factor was Factor C (tray size).
The light-colored aggregate had similar factors as the dark-colored aggregate. Factor F (zoom level) appears to be statistically significant for the angularity (Figure 2.34). On the other hand, Factor C (tray size) was statistically significant for the 2D Form results (Figure 2.35). No interaction factors were found to be statistically significant in Experiment 8, which was most likely due to the decrease in the effects of the main factors.
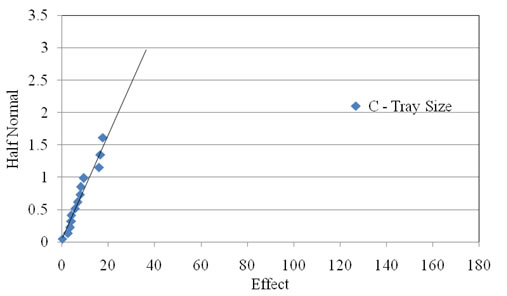
Figure 2.32. Half-normal plot of the angularity of the dark 1.18 mm (ASTM #16 sieve) fine aggregate used in Experiment 8.
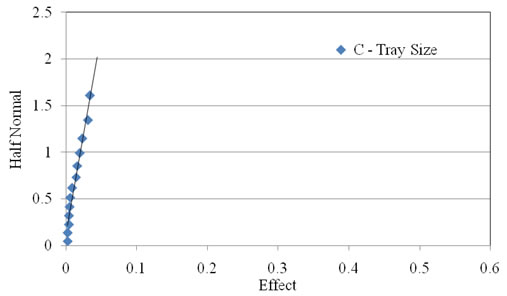
Figure 2.33. Half-normal plot of the 2D form of the dark 1.18 mm (ASTM #16 sieve) fine aggregate used in Experiment 8.
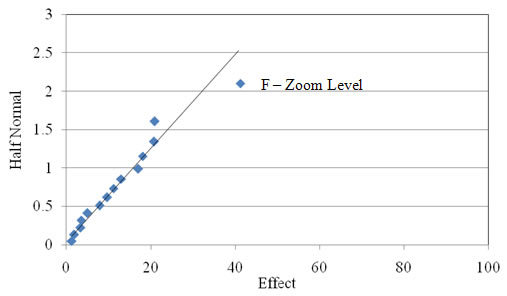
Figure 2.34. Half-normal plot of the angularity of the light 1.18 mm (ASTM #16 sieve) fine aggregate used in Experiment 8.
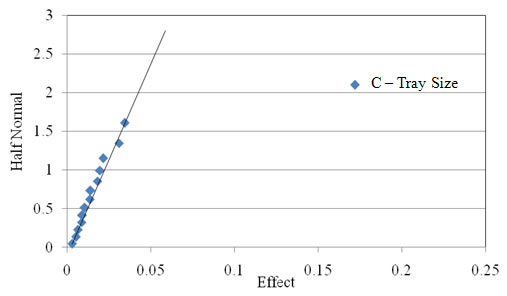
Figure 2.35. Half-normal plot of the 2D form of the light 1.18 mm (ASTM #16 sieve) fine aggregate used in Experiment 8.
The light 0.15 mm (ASTM #100 sieve) aggregate (Figure 2.29) were again used to confirm the result found using the 1.18 mm (ASTM #16 sieve) aggregate. The same factors and limits were used for both aggregate sizes (Table 2.40). The summary of the angularity and 2D form results are in Table 2.43.
| Angularity | Form 2D | |
|---|---|---|
| Scan 1 | 2442.63 | 6.59 |
| Scan 2 | 2432.03 | 6.54 |
| Scan 3 | 2457.91 | 6.47 |
| Scan 4 | 2205.87 | 6.50 |
| Scan 5 | 2296.71 | 6.60 |
| Scan 6 | 2497.23 | 6.63 |
| Scan 7 | 2309.90 | 6.41 |
| Scan 8 | 2240.49 | 6.49 |
| Scan 9 | 2379.27 | 6.53 |
| Scan 10 | 2209.78 | 6.40 |
| Scan 11 | 2187.52 | 6.41 |
| Scan 12 | 2531.24 | 6.48 |
| Scan 13 | 2358.65 | 6.59 |
| Scan 14 | 2265.81 | 6.56 |
| Scan 15 | 2355.22 | 6.39 |
| Scan 16 | 2454.94 | 6.65 |
The statistical significance of the factors tested can be determined from the half-normal plots in Figure 2.36 and Figure 2.37. Factor C (tray size) and Factor G (tray height) were statistically significant for the angularity results in Figure 2.36. The 2D form results were affected by Factor C (tray size), Factor D-I, and Factor F-I (Figure 2.37). The interaction AC (light illumination and tray size) was the most likely cause for the high D-I factor. The interaction F-I was most likely caused be the interactions AB (light illumination and CHPR), CE (tray size and ambient light), or DG (door position and tray height). The statistical significance of Factors D, F, and B, which were door position, zoom level, and CHPR, were unclear.
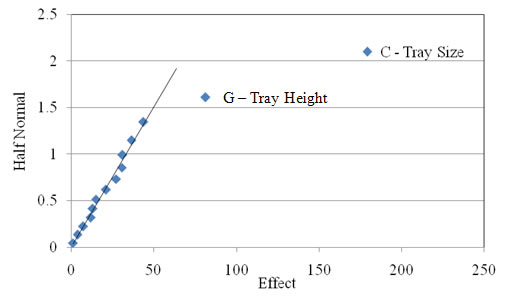
Figure 2.36. Half-normal plot of the angularity of the light 0.15 mm (ASTM #100 sieve) fine aggregate used in Experiment 8.
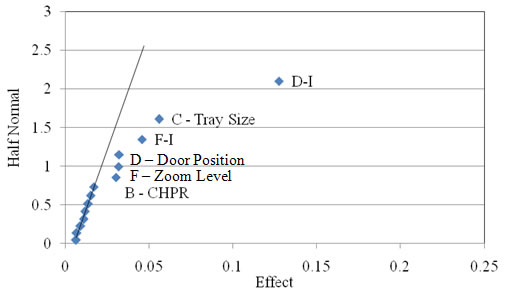
Figure 2.37. Half-normal plot of the 2D form of the light 0.15 mm (ASTM #100 sieve) fine aggregate used in Experiment 8.
Overall for Experiment 8, Factor C (tray size), Factor F (zoom level), and Factor G (tray height), were statistically significant for the limits tested. The other factors that appeared to be significant were Factor D-I (AC) and F-I (AB, CE, or DG).
Experiment 9
Since the tray height was found to affect the sphericity results in Experiment 6, the aggregate height dimension measurements were analyzed. The results of the three coarse aggregates from Experiment 6 were used to further investigate the impact of the tray height. Experiment 6 consisted of two coarse aggregates, one dark and one light, with a size of 9.5 mm (0.375in) (Figure 2.4) and one light-colored coarse aggregate with a size of 4.75 mm (ASTM #4 sieve) (Figure 2.11). Table 2.44 lists the factors and limits for Experiment 9, which are from Experiment 6. A list of the height measurement results of the three coarse aggregates are shown in Table 2.45.
| Factor | Coarse Aggregate Study Factors: | Low Limit | High Limit |
|---|---|---|---|
| A | Light illumination | -1 | 0 |
| B | Tray Height | -0.10 mm | 0.10 mm |
| C | Tray Size | 4.75 mm | 9.5 mm |
| D | Door Position | Open | Closed |
| E | Ambient Light | Off | On |
| F | Zoom Level | -0.5% | +0.5% |
| G | Focus (DOF) | 1% | 0% |
| Dark 9.5 mm (0.375in) Aggregate | Light 9.5 mm (0.375in) Aggregate | Light 4.75 mm (ASTM #4 sieve) Aggregate | |
|---|---|---|---|
| Scan 1 | 7.06 | 6.64 | 4.55 |
| Scan 2 | 7.16 | 6.68 | 4.47 |
| Scan 3 | 7.23 | 6.83 | 4.69 |
| Scan 4 | 7.67 | 6.87 | 3.76 |
| Scan 5 | 7.47 | 6.61 | 3.66 |
| Scan 6 | 7.28 | 6.83 | 4.75 |
| Scan 7 | 7.44 | 6.61 | 3.58 |
| Scan 8 | 7.69 | 6.9 | 3.82 |
| Scan 9 | 7.66 | 6.83 | 3.77 |
| Scan 10 | 7.69 | 6.81 | 3.83 |
| Scan 11 | 7.47 | 6.70 | 3.59 |
| Scan 12 | 7.09 | 6.65 | 4.52 |
| Scan 13 | 7.31 | 6.85 | 4.71 |
| Scan 14 | 7.51 | 6.66 | 3.62 |
| Scan 15 | 7.29 | 6.86 | 4.70 |
| Scan 16 | 7.06 | 6.62 | 4.54 |
The half-normal plots for the dark and light 9.5 mm (0.375 in) aggregates are shown in Figure 2.38 and Figure 2.39, respectively. The 4.75 mm (ASTM #4 sieve) half-normal plot is in Figure 2.40.
The measured aggregate heights for the dark 9.5 mm (0.375 in) aggregates are affected by Factor B (tray height) and Factor G (focus) (Figure 2.38). Factor B (tray height) and Factor C (tray size) are statistically significant for the measured aggregate height for the light 9.5 mm (0.375 in) and light 4.75 mm (ASTM #4 sieve) aggregates (Figure 2.39 and Figure 2.40). From Experiment 9, the tray height was found to still be statistically significant for the height measurements of the aggregates.
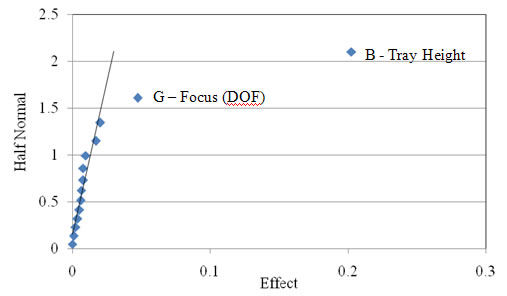
Figure 2.38. Half-normal plot of the aggregate height of the dark 9.5 mm (0.375 in) coarse aggregate used in Experiment 9.
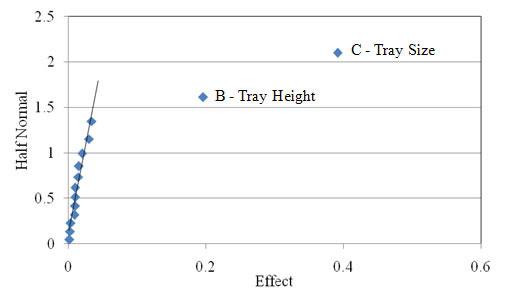
Figure 2.39. Half-normal plot of the aggregate height of the light 9.5 mm (0.375 in) coarse aggregate used in Experiment 9.
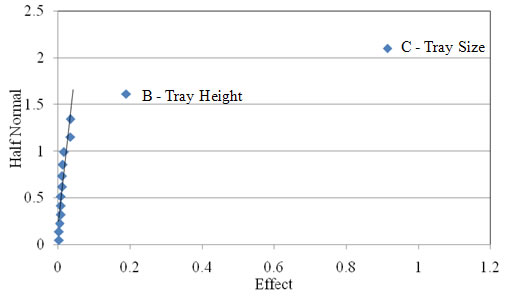
Figure 2.40. Half-normal plot of the aggregate height of the light 4.75 mm (ASTM #4 sieve) coarse aggregate used in Experiment 9.
Experiment 10
Although the tray height was shown to be statistically significant for the sphericity and the aggregate height results, this factor might be considered insignificant from an engineering standpoint. It is important to investigate the impact of the significance on the AIMS2 results and the engineering interpretation of these results. In order to investigate this issue, a set of 50 aggregate particles containing a mix of gravel, granite and limestone were scanned three times to determine the difference in AIMS2 results between the three scans of each set. Examples of the comparisons of the height measurements for the 25.0 mm (1.0 in) aggregate are shown in Figure 2.41, Figure 2.42, and Figure 2.43 of the three replicate scans. A list of all of the equations of the fitted line equations and R2 values for the all of the coarse aggregate sizes are shown in Table 2.46. The data in Table 2.46 show that the measurements are close to the line of equality with very small biases. The values of the confidence interval for the slope either contain or are very close to one and the values of the confidence interval for the intercepts either contain or are very close to zero (Table 2.47). The high R2 values show the minimal spread in the data.
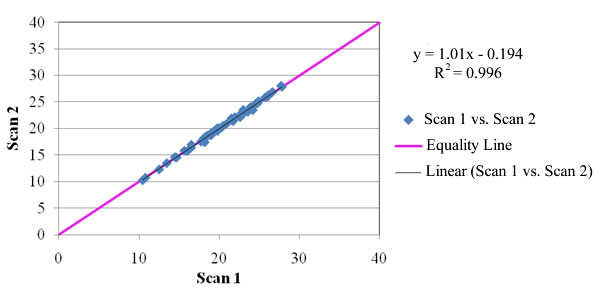
Figure 2.41. 25.0 mm (1.0 in) aggregate height measurement for Replicate Scan 1 vs. Scan 2.
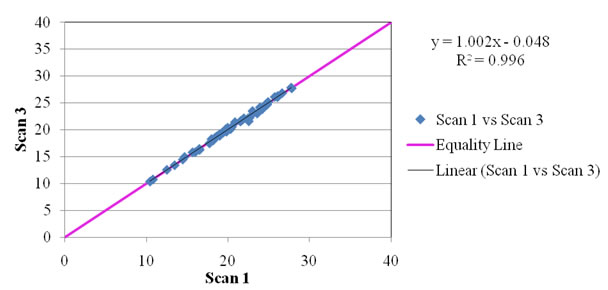
Figure 2.42. 25.0 mm (1.0 in) aggregate height measurement for Replicate Scan 1 vs. Scan 3.
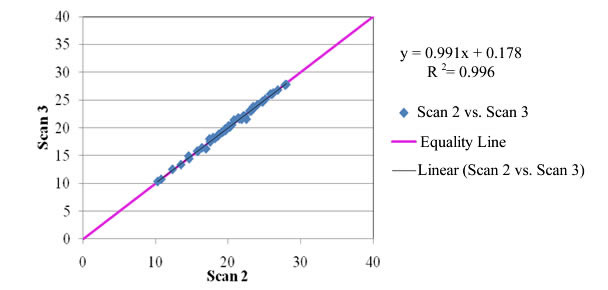
Figure 2.43. 25.0 mm (1.0 in) aggregate height measurement for Replicate Scan 2 vs. Scan 3.
| Aggregate Size | Scans Plotted | Best-fit Linear Equation | R² Value |
|---|---|---|---|
| 25.0 mm (1.0 in) | S1* vs. S2* | S1* = 1.01 × S2* - 0.194 | 0.996 |
| S1 vs. S3* | S1 = 1.002 × S3* - 0.048 | 0.996 | |
| S2 vs. S3 | S2 = 0.991 × S3 + 0.178 | 0.996 | |
| 19.0 mm (.75in) | S1 vs. S2 | S1 = 0.99 × S2 + 0.132 | 0.992 |
| S1 vs. S3 | S1 = 0.98 × S3 + 0.297 | 0.989 | |
| S2 vs. S3 | S2 = 0.989 × S3 + 0.172 | 0.996 | |
| 12.5 mm (.50in) | S1 vs. S2 | S1 = 0.973 × S2 + 0.292 | 0.995 |
| S1 vs. S3 | S1 = 0.969 × S3 + 0.287 | 0.996 | |
| S2 vs. S3 | S2 = 0.993 × S3 + 0.025 | 0.995 | |
| 9.5 mm (.375in) | S1 vs. S2 | S1 = 0.993 × S2 + 0.094 | 0.986 |
| S1 vs. S3 | S1 = 0.99 × S3 + 0.064 | 0.97 | |
| S2 vs. S3 | S2 = 0.994 × S3 - 0.002 | 0.976 | |
| 4.75 mm (#4 sieve) | S1 vs. S2 | S1 = 0.98 × S2 + 0.033 | 0.958 |
| S1 vs. S3 | S1 = 0.968 × S3 + 0.104 | 0.961 | |
| S2 vs. S3 | S2 = 0.974 × S3 + 0.132 | 0.975 |
*S1 = Scan 1, S2 = Scan 2, and S3 = Scan 3
| Aggregate Size | Scans Plotted | Slope CI | Intercept CI | |
|---|---|---|---|---|
| 25.0 mm (1.0 in) | S1* vs. S2* | (1.001, 1.018) | (-0.375, -0.012) | |
| S1 vs. S3* | (0.993, 1.012) | (-0.24, 0.144) | ||
| S2 vs. S3 | 0.982, 1) | (-0.005, 0.361) | ||
| 19.0 mm (.75 in) | S1 vs. S2 | (0.977, 1.003) | (-0.076, 0.339) | |
| S1 vs. S3 | (0.965, 0.995) | (0.055, 0.54) | ||
| S2 vs. S3 | (0.98, 0.998) | (0.032, 0.311) | ||
| 12.5 mm (.50 in) | S1 vs. S2 | (0.963, 0.983) | (0.182, 0.402) | |
| S1 vs. S3 | (0.96, 0.978) | (0.187, 0.386) | ||
| S2 vs. S3 | (0.984, 1.003) | (-0.083, 0.132) | ||
| 9.5 mm (.375 in) | S1 vs. S2 | (0.976, 1.01) | (-0.032, 0.22) | |
| S1 vs. S3 | (0.965, 1.016) | (-0.124, 0.252) | ||
| S2 vs. S3 | (0.971, 1.016) | (-0.172, 0.168) | ||
| 4.75 mm (#4 sieve) | S1 vs. S2 | (0.95, 1.01) | (-0.103, 0.169) | |
| S1 vs. S3 | (0.94, 0.996) | (-0.025, 0.232) | ||
| S2 vs. S3 | (0.951, 0.996) | (0.029, 0.234) | ||
*S1 = Scan 1, S2 = Scan 2, and S3 = Scan 3
Although the tray height was statistically significant based on the results of Experiments 5 and 6; Experiment 9 showed that the differences in replicate measurements of the same aggregate is minimal. The tray height factor therefore appears not to be affecting the results from the practical aspect and AIMS2 is able to control normal variations in the height dimension measurement of the aggregates.
Conclusions
The ruggedness study following ASTM C 1067-00 identified several factors that were found to be statistically significant in affecting the AIMS2 results. The transparent doors were not able to control the changes in ambient lighting, therefore these were replaced with non-transparent doors. The non-transparent doors were found to block the ambient light completely. There was concern that the results of the factors may be skewed due to the effect of interactions between the factors. Therefore, the ruggedness analysis was also conducted using the ASTM E 1169-07 procedure, which allows for the identification of the effects of the main factors and interactions between these factors. The ruggedness study following ASTM E 1169-07 lead to the identification of several significant factors that could affect the AIMS2 shape characteristics. Consequently, limits were proposed for these factors in order to eliminate their influence on the measured characteristics. The factors and limits listed in Table 2.48 are the recommended controls for the factors in order to ensure the ruggedness of the AIMS2 measurements. As long as these limits are achieved by the system, AIMS2 can control normal variations related to the factors without significantly changing the results.
| Aggregate Factors | Recommended Limits |
|---|---|
| Light Illumination | -1 and 0. |
| Tray Size | Use tray size specified for each aggregate size. |
| Tray Color | Use opaque tray for #50, #100, and #200 aggregates. |
| Door Position | Door must be closed. |
| Ambient Light | Not significant with doors closed. |
| Focus (DOF) | A maximum variation of 1% from the settings. |
| CHPR | Nonchangeable parameter (1.07). |
| Zoom Level | A variation ± 0.5% of nominal setting. |
| Tray Height | Height calibration must follow the Operation Manual procedure. |
| CHRP = convex hull perimeter ratio | |
4 Jay L. Devore (Ed.), Probability and Statistics for Engineering and the Sciences, 6th ed., 2004.