

Aggregate Image Measurement System 2 (AIMS2): Final Report
APPENDIX A
Chapter 3 – Interlaboratory Study
Introduction
The Interlaboratory Study (ILS) was conducted to determine the repeatability and reproducibility of AIMS2 for multiple users and laboratories. The ILS was carried out in accordance with ASTM C 802 – 96, "Standard Practice for Conducting an Interlaboratory Test Program to Determine the Precision of Test Methods for Construction Materials." The ILS results were used to develop a precision statement for the test method using ASTM C 670 – 03, "Standard Practice for Preparing Precision and Bias Statements for Test Methods for Construction Materials."
ILS provides two different precision estimates of the test method; single-operator precision (within-laboratory precision) and multi-laboratory precision (between-laboratory precision). The single-operator precision provides an estimate of the variance that may be expected between duplicate measurements of the same sample made by the same operator in the same laboratory. The multi-laboratory precision gives an estimate of the differences that may be expected between measurements of the same material made in different laboratories by different users. The single-operator and multi-laboratory precision statements were determined in this study for the outputs of the AIM2S system: angularity, texture, 2D Form, sphericity, flat or elongated 3:1 ratio.
Aggregate Sources and Sizes
Three different aggregates (Crushed Gravel, Limestone, and Granite) were used for all sizes except that a sandstone source was used instead of granite for the size passing the 0.15 mm sieve (ASTM #100 sieve) and retained on the 0.075 mm (ASTM #200 sieve). Based on previous characterization of these aggregates, the Crushed Gravel (CG) has the lowest angularity and texture among the three aggregates, the Granite (GR) has the highest angularity and texture, while the Limestone (LS) is in the middle. A list of the materials and sources used in this study are shown in Table 3.1. The coarse and fine aggregates sizes are listed in Table 3.2. Coarse aggregates are defined as those retained on 4.75 mm sieve (ASTM #4 sieve), while fine aggregates are those passing the 4.75 mm sieve (ASTM #4 sieve). In Table 3.2, the aggregate size range gives the sieve size that all particles pass through and the sieve size that all aggregates are retained on.
| Label | Source | Aggregate Description | Aggregate Size Range |
|---|---|---|---|
| CG | Texas | Crushed Gravel | 38.0 mm (1.5 in) – 0.15 mm (ASTM #100 sieve) |
| LS | Texas | Limestone | |
| GR | Oklahoma | Granite | |
| CG* | Georgia | Gravel | 0.15 mm (ASTM #100 sieve) – 0.075 mm (ASTM #200 sieve) |
| LS* | Texas | Limestone | |
| GR* | Texas | Sandstone |
| Aggregate Type | Aggregates Size Range |
|---|---|
| Coarse Aggregate | 37.5 mm (1.5 in) – 25.0 mm (1 in) |
| 25.0 mm (1 in) – 19.0 mm (0.75 in) | |
| 19.0 mm (0.75 in) – 12.5 mm (0.5 in) | |
| 12.5 mm (0.5 in) – 9.5 mm (0.37 5in) | |
| 9.5 mm (0.375 in) – 4.75 mm (ASTM #4 sieve) | |
| Fine Aggregate | 4.75 mm (ASTM #4 sieve) – 2.36 mm (ASTM #8 sieve) |
| 2.36 mm (ASTM #8 sieve) – 1.18 mm (ASTM #16 sieve) | |
| 1.18 mm (ASTM #16 sieve) – 0.6 mm (ASTM #30 sieve) | |
| 0.6 mm(ASTM #30 sieve) – 0.3 mm (ASTM #50 sieve) | |
| 0.3 mm (ASTM #50 sieve) – 0.15 mm (ASTM #100 sieve) | |
| 0.15 mm (ASTM #100 sieve) – 0.075 mm (ASTM #200 sieve) |
As discussed, different aggregates sources were used for the 0.075 mm size (ASTM #200 sieve). These were Crushed Gravel, Limestone, and Sandstone. For simplicity in this study the 0.075 mm (ASTM #200 sieve) sandstone will be grouped with the granite.
In addition to the average shape characteristics for each sieve range, the AIMS2 software includes a method to determine the weighted average of a certain property of an aggregate blend. The weighing averaging factors are determined based on aggregate size (see Appendix A). The hypothetical gradation shown in Table 3.3 was used in determining the shape characteristics of the blend. Since the 0.075 mm (ASTM #200 sieve) fine aggregates were not from the same sources as the other aggregates sizes, it was not included in the combined results.
| Retained Size | Percent Passing | Percent Retained |
|---|---|---|
| 37.5 mm (1.5 in) | 100.0% | 0.0% |
| 25.0 mm (1 in) | 93.0% | 7.0% |
| 19.0 mm (0.75 in) | 85.0% | 8.0% |
| 12.5 mm (0.5 in) | 70.0% | 15.0% |
| 9.5 mm (0.375 in) | 55.0% | 15.0% |
| 4.75 mm (ASTM #4 sieve) | 35.0% | 20.0% |
| 2.36 mm (ASTM #8 sieve) | 25.0% | 10.0% |
| 1.18 mm (ASTM #16 sieve) | 15.0% | 10.0% |
| 0.6 mm (ASTM #30 sieve) | 10.0% | 5.0% |
| 0.3 mm (ASTM #50 sieve) | 5.0% | 5.0% |
| 0.15 mm (ASTM #100 sieve) | 0.0% | 5.0% |
| 0.075 mm (ASTM #200 sieve) | 0.0% | 0.0% |
Each aggregate source was sieved according to the size ranges and randomly separated into samples which were shipped with each AIMS2 machine to the participating laboratories. Each coarse aggregate sample consisted of 60. All of the particles were placed on the tray and 50 of them were used in the analysis. Approximately 150 grams of each fine aggregate size, 2.36 mm (ASTM #8 sieve) to 0.15 mm (ASTM #100 sieve), and 50 grams of 0.075 mm (ASTM #200 sieve) aggregate were sent to the laboratories. A fine aggregate sample was spread onto the tray and 150 aggregate particles were used for the analysis.
Eight AIMS2 machines were used in this study. Given the number of participating laboratories (32 labs), three to four laboratories used the same exact machine and tested the same samples. This procedure satisfied the number of materials and participating laboratory requirements of ASTM C 802-96. Testing began with successfully calibrating the machines according to manufacture instructions. The user was instructed to scan the two replicate measurements on different days to provide meaningful replicate values. Data from each test was automatically saved into computer files.
Data Analysis
Following careful examination of the procedure followed to conduct measurements, three laboratories' data were removed from the ILS study due to user error by not following manufacture and procedure instructions. The within-laboratory and between-laboratory variances were calculated using data from the remaining 29 laboratories. A list of the raw data is show in Appendix B.
With an additional analysis of the raw data images, several 4.75 mm (ASTM #4 sieve) texture images were found to be of the aggregate edge instead of the aggregate surface. Figure 3.1 shows two texture images, one image including the aggregate edge and one image of the aggregate surface. The image of the edge of the aggregate contains both the surface of the aggregate and the surface of the tray. If several images are of the aggregate edge are within a sample data, these images can affect the AIMS2 results, in particularly the texture values. The images with aggregate edges were removed manually and the results were recalculated for the remaining images. The remaining coarse aggregate sizes were checked and the images did not have the same problems as the 4.75 mm (ASTM #4 sieve) aggregates.
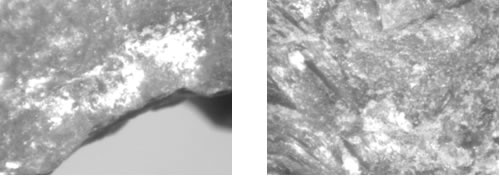
Figure 3.1. Texture image with and without aggregate edge.
The data was checked for agreement of variances and interactions between material and laboratories. ASTM C 802-96 assumes that different laboratories have the same within-laboratory variances. The variance of the each laboratory was checked for an agreement of variances based on the ratio of the largest variance to the sum of variances. The laboratories with the variances above the upper 5% level were eliminated to bring the variances into agreement. The interactions between laboratory and material were checked by plotting the averages values obtained by each laboratory to aggregate type. A similar pattern of change was found from one material to another which indicated little to no interaction between laboratory and materials. An example of the analysis results of all 29 laboratory data is shown in Figure 3.2 for the angularity measurement of 25.0 mm (1in) size aggregates.
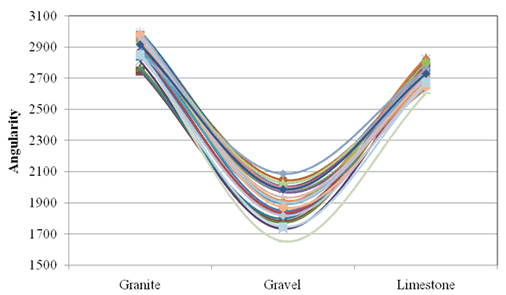
Figure 3.2. Interaction check for angularity versus material for 25.0 mm (1 in) aggregates.
The components of variance, variances, standard deviations, and coefficient of variations were calculated for each shape property for each aggregate type. The components of variance are the estimated amount of variation that can be attributed to the effects of the experiment from the factor.5 The averages, components of variance, and variances of the Gravel, Limestone, and Granite are shown in Table 3.4, Table 3.5, and Table 3.6, respectively. The standard deviation and coefficient of variation of the Gravel, Limestone, and Granite are shown in Table 3.7, Table 3.8, and Table 3.9 respectively. The combined data results for the weighted aggregate blend are listed in Table 3.10 and Table 3.11.
It should be noted that the analysis was conducted on the flat or elongated 3:1 ratio instead of the 5:1 ratio because the aggregate samples had a few or no particles that exceeded the 5:1 ratio. For example, the 25.0 mm (1 in) and 4.75 mm (ASTM #4 sieve) aggregates, it was found during the analysis that any small variation in measurements even by one particle would translate to a very high coefficient of variation if the 5:1 ratio was used. The coefficient of variation reported for the flat or elongated 3:1 ratio were calculated based on the average percent of particles that have a ratio less than (not more than) 3:1.
| Aggregate Shape Characteristic | Aggregate Size | Average | Components of Variance | Variance | ||
|---|---|---|---|---|---|---|
| Within-Laboratory | Between-Laboratory | Within-Laboratory | Between-Laboratory | |||
| Angularity | 25 (1.0") | 1895.6 | 3795.7 | 9033.3 | 3795.7 | 12829.0 |
| 19 (¾") | 2609.1 | 7630.1 | 8597.4 | 7630.1 | 16227.5 | |
| 12.5 (½") | 2777.9 | 5511.7 | 8718.2 | 5511.7 | 14229.9 | |
| 9.5 (3/8") | 2563.5 | 3038.2 | 20105.9 | 3038.2 | 23144.1 | |
| 4.75 (#4) | 2275.5 | 4403.8 | 14193.3 | 4403.8 | 18597.2 | |
| 2.36 (#8) | 2667.3 | 7588.7 | 1311.3 | 7588.7 | 8900.0 | |
| 1.18 (#16) | 3076.3 | 3482.6 | 1894.0 | 3482.6 | 5376.6 | |
| 0.6 (#30) | 3237.1 | 8033.0 | 824.2 | 8033.0 | 8857.2 | |
| 0.3 (#50) | 3179.5 | 12085.8 | 10815.3 | 12085.8 | 22901.1 | |
| 0.15 (#100) | 2735.1 | 13011.2 | 10529.8 | 13011.2 | 23541.0 | |
| 0.075 (#200) | 2251.8 | 31135.2 | 12453.6 | 31135.2 | 43588.8 | |
| Texture | 25 (1.0") | 224.7 | 78.1 | 155.4 | 78.1 | 233.5 |
| 19 (¾") | 249.8 | 221.8 | 165.4 | 221.8 | 387.3 | |
| 12.5 (½") | 233.6 | 161.4 | 103.6 | 161.4 | 264.9 | |
| 9.5 (3/8") | 227.5 | 143.6 | 213.2 | 143.6 | 356.8 | |
| 4.75 (#4) | 180.8 | 185.0 | 173.0 | 185.0 | 358.1 | |
| Sphericity | 25 (1.0") | 0.7 | 0.0 | 0.0 | 0.0 | 0.0 |
| 19 (¾") | 0.7 | 0.0 | 0.0 | 0.0 | 0.0 | |
| 12.5 (½") | 0.7 | 0.0 | 0.0 | 0.0 | 0.0 | |
| 9.5 (3/8") | 0.68 | 0.0000 | 0.0001 | 0.0000 | 0.0001 | |
| 4.75 (#4) | 0.70 | 0.0001 | 0.0003 | 0.0001 | 0.0004 | |
| Flat or Elongated 3:1 | 25 (1.0") | 0.58% | 0.0000 | 0.0002 | 0.0000 | 0.0002 |
| 19 (¾") | 0.76% | 0.0001 | 0.0001 | 0.0001 | 0.0002 | |
| 12.5 (½") | 1.12% | 0.0001 | 0.0002 | 0.0001 | 0.0003 | |
| 9.5 (3/8") | 3.83% | 0.0003 | 0.0014 | 0.0003 | 0.0016 | |
| 4.75 (#4) | 3.22% | 0.0005 | 0.0007 | 0.0005 | 0.0012 | |
| 2D Form | 2.36 (#8) | 6.7 | 0.0264 | 0.0043 | 0.0264 | 0.0307 |
| 1.18 (#16) | 7.4 | 0.0289 | 0.0067 | 0.0289 | 0.0357 | |
| 0.6 (#30) | 7.8 | 0.0335 | 0.0097 | 0.0335 | 0.0432 | |
| 0.3 (#50) | 7.6 | 0.0440 | 0.0334 | 0.0440 | 0.0774 | |
| 0.15 (#100) | 7.4 | 0.0462 | 0.0264 | 0.0462 | 0.0727 | |
| 0.075 (#200) | 8.5 | 0.1465 | 0.0799 | 0.1465 | 0.2265 | |
| Aggregate Shape Characteristic | Aggregate Size | Average | Components of Variance | Variance | ||
|---|---|---|---|---|---|---|
| Within-Laboratory | Between-Laboratory | Within-Laboratory | Between-Laboratory | |||
| Angularity | 25 (1.0") | 2730.7 | 3746.2 | 1704.9 | 3746.2 | 5451.1 |
| 19 (¾") | 2746.4 | 5320.3 | 2813.7 | 5320.3 | 8134.0 | |
| 12.5 (½ ") | 2702.3 | 4158.7 | 4364.5 | 4158.7 | 8523.2 | |
| 9.5 (3/8") | 2705.6 | 4695.5 | 1237.7 | 4695.5 | 5933.1 | |
| 4.75 (#4) | 2706.5 | 4656.6 | 1643.3 | 4656.6 | 6299.8 | |
| 2.36 (#8) | 2913.9 | 5244.4 | -155.9 | 5244.4 | 5088.5 | |
| 1.18 (#16) | 2948.6 | 3762.9 | 5953.5 | 3762.9 | 9716.4 | |
| 0.6 (#30) | 3006.6 | 3610.8 | 5327.9 | 3610.8 | 8938.6 | |
| 0.3 (#50) | 2914.5 | 10183.6 | 8965.8 | 10183.6 | 19149.4 | |
| 0.15 (#100) | 2412.9 | 11688.2 | 17729.0 | 11688.2 | 29417.2 | |
| 0.075 (#200) | 2798.3 | 124617.2 | 209763.9 | 124617.2 | 334381.0 | |
| Texture | 25 (1.0") | 275.4 | 143.7 | 198.9 | 143.7 | 342.6 |
| 19 (¾") | 268.6 | 84.4 | 157.5 | 84.4 | 241.8 | |
| 12.5 (½") | 257.3 | 103.0 | 108.1 | 103.0 | 211.2 | |
| 9.5 (3/8") | 225.6 | 93.1 | 93.2 | 93.1 | 186.3 | |
| 4.75 (#4) | 139.1 | 31.4 | 86.3 | 31.4 | 117.7 | |
| Sphericity | 25 (1.0") | 0.7 | 0.0 | 0.0 | 0.0 | 0.0 |
| 19 (¾") | 0.7 | 0.0 | 0.0 | 0.0 | 0.0 | |
| 12.5 (½") | 0.68 | 0.0001 | 0.0001 | 0.0001 | 0.0002 | |
| 9.5 (3/8") | 0.68 | 0.0001 | 0.0001 | 0.0001 | 0.0002 | |
| 4.75 (#4) | 0.67 | 0.0001 | 0.0002 | 0.0001 | 0.0003 | |
| Flat or Elongated 3:1 | 25 (1.0") | 0.83% | 0.0001 | 0.0001 | 0.0001 | 0.0002 |
| 19 (¾") | 0.31% | 0.0000 | 0.0000 | 0.0000 | 0.0001 | |
| 12.5 (½") | 0.97% | 0.0002 | 0.0000 | 0.0002 | 0.0002 | |
| 9.5 (3/8") | 2.04% | 0.0003 | 0.0003 | 0.0003 | 0.0006 | |
| 4.75 (#4) | 4.11% | 0.0005 | 0.0006 | 0.0005 | 0.0011 | |
| 2D Form | 2.36 (#8) | 7.3 | 0.0294 | 0.0134 | 0.0294 | 0.0428 |
| 1.18 (#16) | 7.5 | 0.0436 | 0.0088 | 0.0436 | 0.0524 | |
| 0.6 (#30) | 7.4 | 0.0208 | 0.0279 | 0.0208 | 0.0487 | |
| 0.3 (#50) | 7.2 | 0.0377 | 0.0376 | 0.0377 | 0.0753 | |
| 0.15 (#100) | 7.0 | 0.0715 | 0.0131 | 0.0715 | 0.0846 | |
| 0.075 (#200) | 8.8 | 0.1805 | 0.1919 | 0.1805 | 0.3724 | |
| Aggregate Shape Characteristic | Aggregate Size | Average | Components of Variance | Variance | ||
|---|---|---|---|---|---|---|
| Within-Laboratory | Between-Laboratory | Within-Laboratory | Between-Laboratory | |||
| Angularity | 25 (1.0") | 2901.4 | 3012.5 | 3479.6 | 3012.5 | 6492.2 |
| 19 (¾") | 2985.9 | 5617.4 | 3750.5 | 5617.4 | 9367.9 | |
| 12.5 (½") | 3117.7 | 3003.9 | 5429.6 | 3003.9 | 8433.5 | |
| 9.5 (3/8") | 3193.4 | 3916.6 | 6345.0 | 3916.6 | 10261.6 | |
| 4.75 (#4) | 3061.0 | 8969.4 | 2738.1 | 8969.4 | 11707.5 | |
| 2.36 (#8) | 3330.8 | 4573.7 | 331.6 | 4573.7 | 4905.3 | |
| 1.18 (#16) | 3373.1 | 6988.0 | 1074.0 | 6988.0 | 8062.0 | |
| 0.6 (#30) | 3428.1 | 8080.1 | 9902.4 | 8080.1 | 17982.5 | |
| 0.3 (#50) | 3436.1 | 9438.5 | 47278.8 | 9438.5 | 56717.2 | |
| 0.15 (#100) | 3182.0 | 14401.6 | 15384.8 | 14401.6 | 29786.3 | |
| 0.075 (#200) | 2845.4 | 115989.5 | 14255.0 | 115989.5 | 130244.5 | |
| Texture | 25 (1.0") | 471.8 | 100.4 | 132.3 | 100.4 | 232.7 |
| 19 (¾") | 476.5 | 68.6 | 246.7 | 68.6 | 315.3 | |
| 12.5 (½") | 465.0 | 169.6 | 205.2 | 169.6 | 374.8 | |
| 9.5 (3/8") | 463.2 | 97.4 | 381.4 | 97.4 | 478.8 | |
| 4.75 (#4) | 363.5 | 120.8 | 276.5 | 120.8 | 397.3 | |
| Sphericity | 25 (1.0") | 0.7 | 0.0 | 0.0 | 0.0 | 0.0 |
| 19 (¾") | 0.6 | 0.0 | 0.0 | 0.0 | 0.0 | |
| 12.5 (½") | 0.6 | 0.0 | 0.0 | 0.0 | 0.0 | |
| 9.5 (3/8") | 0.62 | 0.0000 | 0.0002 | 0.0000 | 0.0002 | |
| 4.75 (#4) | 0.68 | 0.0000 | 0.0002 | 0.0000 | 0.0002 | |
| Flat or Elongated 3:1 | 25 (1.0") | 6.81% | 0.0005 | 0.0025 | 0.0005 | 0.0030 |
| 19 (¾") | 9.66% | 0.0004 | 0.0027 | 0.0004 | 0.0032 | |
| 12.5 (½") | 7.91% | 0.0006 | 0.0008 | 0.0006 | 0.0013 | |
| 9.5 (3/8") | 5.72% | 0.0007 | 0.0010 | 0.0007 | 0.0017 | |
| 4.75 (#4) | 5.19% | 0.0011 | 0.0001 | 0.0011 | 0.0012 | |
| 2D Form | 2.36 (#8) | 7.6 | 0.0169 | 0.0152 | 0.0169 | 0.0321 |
| 1.18 (#16) | 7.7 | 0.0258 | 0.0329 | 0.0258 | 0.0587 | |
| 0.6 (#30) | 7.9 | 0.0302 | 0.0238 | 0.0302 | 0.0540 | |
| 0.3 (#50) | 8.0 | 0.0147 | 0.0563 | 0.0147 | 0.0710 | |
| 0.15 (#100) | 7.9 | 0.0401 | 0.0266 | 0.0401 | 0.0667 | |
| 0.075 (#200) | 9.5 | 0.2947 | 0.0373 | 0.2947 | 0.3320 | |
| Aggregate Shape Characteristic | Aggregate Size | Average | Standard Deviations | Coefficients of Variation | ||
|---|---|---|---|---|---|---|
| Within-Laboratory | Between-Laboratory | Within-Laboratory | Between-Laboratory | |||
| Angularity | 25 (1.0") | 1895.6 | 61.6 | 113.3 | 3.3 | 6.0 |
| 19 (¾") | 2609.1 | 87.4 | 127.4 | 3.3 | 4.9 | |
| 12.5 (½") | 2777.9 | 74.2 | 119.3 | 2.7 | 4.3 | |
| 9.5 (3/8") | 2563.5 | 55.1 | 152.1 | 2.2 | 5.9 | |
| 4.75 (#4) | 2275.5 | 66.4 | 136.4 | 2.9 | 6.0 | |
| 2.36 (#8) | 2667.3 | 87.1 | 94.3 | 3.3 | 3.5 | |
| 1.18 (#16) | 3076.3 | 59.0 | 73.3 | 1.9 | 2.4 | |
| 0.6 (#30) | 3237.1 | 89.6 | 94.1 | 2.8 | 2.9 | |
| 0.3 (#50) | 3179.5 | 109.9 | 151.3 | 3.5 | 4.8 | |
| 0.15 (#100) | 2735.1 | 114.1 | 153.4 | 4.2 | 5.6 | |
| 0.075 (#200) | 2251.8 | 176.5 | 208.8 | 7.8 | 9.3 | |
| Texture | 25 (1.0") | 224.7 | 8.8 | 15.3 | 3.9 | 6.8 |
| 19 (¾") | 249.8 | 14.9 | 19.7 | 6.0 | 7.9 | |
| 12.5 (½") | 233.6 | 12.7 | 16.3 | 5.4 | 7.0 | |
| 9.5 (3/8") | 227.5 | 12.0 | 18.9 | 5.3 | 8.3 | |
| 4.75 (#4) | 180.8 | 13.6 | 18.9 | 7.5 | 10.5 | |
| Sphericity | 25 (1.0") | 0.7 | 0.0 | 0.0 | 1.1 | 2.4 |
| 19 (¾") | 0.7 | 0.0 | 0.0 | 1.0 | 2.3 | |
| 12.5 (½") | 0.69 | 0.0066 | 0.0133 | 0.9574 | 1.9202 | |
| 9.5 (3/8") | 0.68 | 0.0069 | 0.0114 | 1.0096 | 1.6730 | |
| 4.75 (#4) | 0.70 | 0.0107 | 0.0205 | 1.5294 | 2.9281 | |
| Flat or Elongated 3:1 | 25 (1.0") | 0.58% | 0.0066 | 0.0148 | 0.6631 | 1.4909 |
| 19 (¾") | 0.76% | 0.0099 | 0.0124 | 0.9989 | 1.2523 | |
| 12.5 (½") | 1.12% | 0.0099 | 0.0167 | 1.0057 | 1.6901 | |
| 9.5 (3/8") | 3.83% | 0.0161 | 0.0406 | 1.6777 | 4.2236 | |
| 4.75 (#4) | 3.22% | 0.0232 | 0.0346 | 2.3940 | 3.5730 | |
| 2D Form | 2.36 (#8) | 6.7 | 0.1624 | 0.1752 | 2.4326 | 2.6235 |
| 1.18 (#16) | 7.4 | 0.1701 | 0.1888 | 2.2868 | 2.5379 | |
| 0.6 (#30) | 7.8 | 0.1830 | 0.2079 | 2.3469 | 2.6666 | |
| 0.3 (#50) | 7.6 | 0.2098 | 0.2783 | 2.7553 | 3.6536 | |
| 0.15 (#100) | 7.4 | 0.2150 | 0.2696 | 2.8944 | 3.6288 | |
| 0.075 (#200) | 8.5 | 0.3828 | 0.4759 | 4.5283 | 5.6292 | |
| Aggregate Shape Characteristic | Aggregate Size | Average | Standard Deviations | Coefficients of Variation | ||
|---|---|---|---|---|---|---|
| Within-Laboratory | Between-Laboratory | Within-Laboratory | Between-Laboratory | |||
| Angularity | 25 (1.0") | 2730.7 | 61.2 | 73.8 | 2.2 | 2.7 |
| 19 (¾") | 2746.4 | 72.9 | 90.2 | 2.7 | 3.3 | |
| 12.5 (½") | 2702.3 | 64.5 | 92.3 | 2.4 | 3.4 | |
| 9.5 (3/8") | 2705.6 | 68.5 | 77.0 | 2.5 | 2.8 | |
| 4.75 (#4) | 2706.5 | 68.2 | 79.4 | 2.5 | 2.9 | |
| 2.36 (#8) | 2913.9 | 72.4 | 71.3 | 2.5 | 2.4 | |
| 1.18 (#16) | 2948.6 | 61.3 | 98.6 | 2.1 | 3.3 | |
| 0.6 (#30) | 3006.6 | 60.1 | 94.5 | 2.0 | 3.1 | |
| 0.3 (#50) | 2914.5 | 100.9 | 138.4 | 3.5 | 4.7 | |
| 0.15 (#100) | 2412.9 | 108.1 | 171.5 | 4.5 | 7.1 | |
| 0.075 (#200) | 2798.3 | 353.0 | 578.3 | 12.6 | 20.7 | |
| Texture | 25 (1.0") | 275.4 | 12.0 | 18.5 | 4.4 | 6.7 |
| 19 (¾") | 268.6 | 9.2 | 15.6 | 3.4 | 5.8 | |
| 12.5 (½") | 257.3 | 10.2 | 14.5 | 3.9 | 5.6 | |
| 9.5 (3/8") | 225.6 | 9.6 | 13.7 | 4.3 | 6.1 | |
| 4.75 (#4) | 139.1 | 5.6 | 10.8 | 4.0 | 7.8 | |
| Sphericity | 25 (1.0") | 0.72 | 0.0054 | 0.0155 | 0.7598 | 2.1676 |
| 19 (¾") | 0.68 | 0.0057 | 0.0165 | 0.8326 | 2.4187 | |
| 12.5 (½") | 0.68 | 0.0074 | 0.0142 | 1.0887 | 2.0887 | |
| 9.5 (3/8") | 0.68 | 0.0076 | 0.0133 | 1.1196 | 1.9515 | |
| 4.75 (#4) | 0.67 | 0.0100 | 0.0164 | 1.5023 | 2.4658 | |
| Flat or Elongated 3:1 | 25 (1.0") | 0.83% | 0.0071 | 0.0127 | 0.7173 | 1.2764 |
| 19 (¾") | 0.31% | 0.0070 | 0.0073 | 0.6990 | 0.7350 | |
| 12.5 (½") | 0.97% | 0.0124 | 0.0137 | 1.2473 | 1.3826 | |
| 9.5 (3/8") | 2.04% | 0.0159 | 0.0240 | 1.6281 | 2.4467 | |
| 4.75 (#4) | 4.11% | 0.0225 | 0.0326 | 2.3424 | 3.4007 | |
| 2D Form | 2.36 (#8) | 7.3 | 0.1715 | 0.2069 | 2.3464 | 2.8304 |
| 1.18 (#16) | 7.5 | 0.2089 | 0.2289 | 2.8027 | 3.0717 | |
| 0.6 (#30) | 7.4 | 0.1442 | 0.2206 | 1.9395 | 2.9662 | |
| 0.3 (#50) | 7.2 | 0.1941 | 0.2743 | 2.6878 | 3.7988 | |
| 0.15 (#100) | 7.0 | 0.2675 | 0.2909 | 3.8203 | 4.1550 | |
| 0.075 (#200) | 8.8 | 0.4249 | 0.6103 | 4.8284 | 6.9350 | |
| Aggregate Shape Characteristic | Aggregate Size | Average | Standard Deviations | Coefficients of Variation | ||
|---|---|---|---|---|---|---|
| Within-Laboratory | Between-Laboratory | Within-Laboratory | Between-Laboratory | |||
| Angularity | 25 (1.0") | 2901.4 | 54.9 | 80.6 | 1.9 | 2.8 |
| 19 (¾") | 2985.9 | 74.9 | 96.8 | 2.5 | 3.2 | |
| 12.5 (½") | 3117.7 | 54.8 | 91.8 | 1.8 | 2.9 | |
| 9.5 (3/8") | 3193.4 | 62.6 | 101.3 | 2.0 | 3.2 | |
| 4.75 (#4) | 3061.0 | 94.7 | 108.2 | 3.1 | 3.5 | |
| 2.36 (#8) | 3330.8 | 67.6 | 70.0 | 2.0 | 2.1 | |
| 1.18 (#16) | 3373.1 | 83.6 | 89.8 | 2.5 | 2.7 | |
| 0.6 (#30) | 3428.1 | 89.9 | 134.1 | 2.6 | 3.9 | |
| 0.3 (#50) | 3436.1 | 97.2 | 238.2 | 2.8 | 6.9 | |
| 0.15 (#100) | 3182.0 | 120.0 | 172.6 | 3.8 | 5.4 | |
| 0.075 (#200) | 2845.4 | 340.6 | 360.9 | 12.0 | 12.7 | |
| Texture | 25 (1.0") | 471.8 | 10.0 | 15.3 | 2.1 | 3.2 |
| 19 (¾") | 476.5 | 8.3 | 17.8 | 1.7 | 3.7 | |
| 12.5 (½") | 465.0 | 13.0 | 19.4 | 2.8 | 4.2 | |
| 9.5 (3/8") | 463.2 | 9.9 | 21.9 | 2.1 | 4.7 | |
| 4.75 (#4) | 363.5 | 11.0 | 19.9 | 3.0 | 5.5 | |
| Sphericity | 25 (1.0") | 0.7 | 0.0 | 0.0 | 0.8 | 2.9 |
| 19 (¾") | 0.64 | 0.0054 | 0.0180 | 0.8389 | 2.8273 | |
| 12.5 (½") | 0.62 | 0.0078 | 0.0126 | 1.2580 | 2.0376 | |
| 9.5 (3/8") | 0.62 | 0.0064 | 0.0148 | 1.0388 | 2.3872 | |
| 4.75 (#4) | 0.68 | 0.0065 | 0.0153 | 0.9542 | 2.2500 | |
| Flat or Elongated 3:1 | 25 (1.0") | 6.81% | 0.0222 | 0.0550 | 2.3831 | 5.9008 |
| 19 (¾") | 9.66% | 0.0208 | 0.0562 | 2.3017 | 6.2250 | |
| 12.5 (½") | 7.91% | 0.0241 | 0.0366 | 2.6180 | 3.9717 | |
| 9.5 (3/8") | 5.72% | 0.0257 | 0.0407 | 2.7262 | 4.3195 | |
| 4.75 (#4) | 5.19% | 0.0332 | 0.0345 | 3.4992 | 3.6437 | |
| 2D Form | 2.36 (#8) | 7.6 | 0.1299 | 0.1791 | 1.7012 | 2.3456 |
| 1.18 (#16) | 7.7 | 0.1606 | 0.2422 | 2.0854 | 3.1457 | |
| 0.6 (#30) | 7.9 | 0.1739 | 0.2325 | 2.1978 | 2.9387 | |
| 0.3 (#50) | 8.0 | 0.1212 | 0.2665 | 1.5243 | 3.3506 | |
| 0.15 (#100) | 7.9 | 0.2003 | 0.2583 | 2.5197 | 3.2500 | |
| 0.075 (#200) | 9.5 | 0.5429 | 0.5762 | 5.7193 | 6.0704 | |
| Aggregate Shape Characteristic | Aggregate Size | Average | Components of Variance | Variance | ||
|---|---|---|---|---|---|---|
| Within-Laboratory | Between-Laboratory | Within-Laboratory | Between-Laboratory | |||
| Gravel | Angularity | 2878.1 | 3400.8 | 4697.5 | 3400.8 | 8098.3 |
| Texture | 203.4 | 44.7 | 123.9 | 44.7 | 168.6 | |
| Sphericity | 0.70 | 0.0001 | 0.0003 | 0.0001 | 0.0003 | |
| Flat or Elongated 3:1 | 1.52% | 0.0000 | 0.0001 | 0.0000 | 0.0002 | |
| 2D Form | 7.5 | 0.0124 | 0.0093 | 0.0124 | 0.0217 | |
| Limestone | Angularity | 2689.8 | 2715.7 | 6833.3 | 2715.7 | 9549.0 |
| Texture | 183.4 | 11.0 | 58.0 | 11.0 | 69.0 | |
| Sphericity | 0.67 | 0.0001 | 0.0001 | 0.0001 | 0.0002 | |
| Flat or Elongated 3:1 | 1.46% | 0.0000 | 0.0000 | 0.0000 | 0.0001 | |
| 2D Form | 7.2 | 0.0213 | 0.0109 | 0.0213 | 0.0322 | |
| Granite | Angularity | 3262.2 | 5341.0 | 12882.9 | 5341.0 | 18223.9 |
| Texture | 399.5 | 75.2 | 167.8 | 75.2 | 243.0 | |
| Sphericity | 0.67 | 0.0001 | 0.0001 | 0.0001 | 0.0002 | |
| Flat or Elongated 3:1 | 4.36% | 0.0001 | 0.0001 | 0.0001 | 0.0002 | |
| 2D Form | 7.9 | 0.0131 | 0.0109 | 0.0131 | 0.0241 | |
| Aggregate Material | Aggregate Size | Average | Standard Deviations | Coefficients of Variation | ||
|---|---|---|---|---|---|---|
| Within-Laboratory | Between-Laboratory | Within-Laboratory | Between-Laboratory | |||
| Gravel | Angularity | 2878.1 | 58.3 | 90.0 | 2.0 | 3.1 |
| Texture | 203.4 | 6.7 | 13.0 | 3.3 | 6.4 | |
| Sphericity | 0.70 | 0.0083 | 0.0183 | 1.1981 | 2.6291 | |
| Flat or Elongated 3:1 | 1.52% | 0.0066 | 0.0138 | 0.6733 | 1.4002 | |
| 2D Form | 7.5 | 0.1112 | 0.1472 | 1.4885 | 1.9700 | |
| Limestone | Angularity | 2689.8 | 52.1 | 97.7 | 1.9 | 3.6 |
| Texture | 183.4 | 3.3 | 8.3 | 1.8 | 4.5 | |
| Sphericity | 0.67 | 0.0090 | 0.0151 | 1.3578 | 2.2602 | |
| Flat or Elongated 3:1 | 1.46% | 0.0052 | 0.0084 | 0.5295 | 0.8491 | |
| 2D Form | 7.2 | 0.1459 | 0.1794 | 2.0338 | 2.4999 | |
| Granite | Angularity | 3262.2 | 73.1 | 135.0 | 2.2 | 4.1 |
| Texture | 399.5 | 8.7 | 15.6 | 2.2 | 3.9 | |
| Sphericity | 0.67 | 0.0092 | 0.0151 | 1.3633 | 2.2521 | |
| Flat or Elongated 3:1 | 4.36% | 0.0103 | 0.0141 | 1.0753 | 1.4739 | |
| 2D Form | 7.9 | 0.1146 | 0.1551 | 1.4509 | 1.9645 | |
The standard deviations and coefficient of variations were plotted against the average of each materials source. Figure 3.3 and Figure 3.4 are examples of the standard deviation and coefficient of variations relationships for the angularity measurement of 25.0 mm (1 in) aggregates.
The precision statement of the data was established by analyzing the relationships of the standard deviations and/or coefficient of variations. The ASTM C 670-96 procedure includes two provisions for the data analysis. One provision is for a constant standard deviation case and the second provision is for a constant coefficient of variation case. The constant standard deviation case is where pooled within-laboratory standard deviation over all the materials becomes the single-operator standard deviation and the pooled between-laboratory standard deviation becomes the multi-laboratory standard deviation. In the case of a constant coefficient of variation, the average within-laboratory and between-laboratory coefficient of variation becomes the single-operator and the multi-laboratory coefficient of variation, respectively.
Neither of the constant standard deviation or constant coefficient of variation conditions was strictly satisfied in the analysis results. However, from an engineering perspective, the variation of the standard deviation and coefficient of variation is considered small. Therefore, it was decided to determine the precision statements for both a constant standard deviation and a constant coefficient of variation for the single-operator (within-laboratory) and multi-laboratory (between-laboratory) precision.
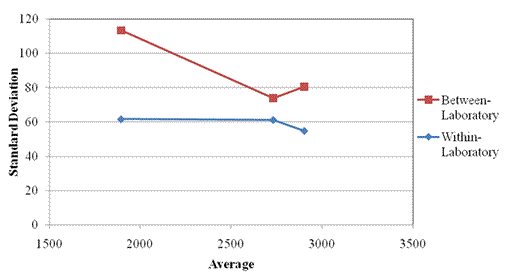
Figure 3.3. Standard deviation versus average angularity of 25.0 mm (1 in).
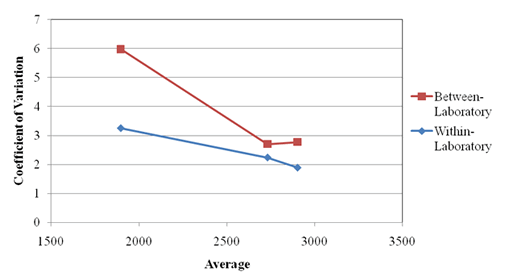
Figure 3.4. Coefficient of variation versus average angularity of 25.0 mm (1 in).
The precision statements (1s%) based on the assumption of constant standard deviation are shown in Table 3.12 for the single-operator and multi-laboratory results. The precision statements (1s%) based on the assumption of constant coefficient of variation are shown in Table 3.13. The combined results precision statements (1s%) based on the assumptions of constant standard deviation and constant coefficient of variation are shown in Table 3.14 and 3.15, respectively.
| Aggregate Shape Characteristic | Aggregate Size | Standard Deviation | |
|---|---|---|---|
| Single-Operator | Multi-Laboratory | ||
| Angularity | 25 (1.0") | 59.3 | 90.9 |
| 19 (3/4") | 78.7 | 106.0 | |
| 12.5 (1/2") | 65.0 | 102.0 | |
| 9.5 (3/8") | 62.3 | 114.5 | |
| 4.75 (#4) | 77.5 | 110.5 | |
| 2.36 (#8) | 76.2 | 79.4 | |
| 1.18 (#16) | 68.9 | 87.9 | |
| 0.6 (#30) | 81.1 | 109.2 | |
| 0.3 (#50) | 102.8 | 181.4 | |
| 0.15 (#100) | 114.2 | 166.1 | |
| 0.075 (#200) | 301.0 | 411.6 | |
| Texture | 25 (1.0") | 10.4 | 16.4 |
| 19 (¾") | 11.2 | 17.7 | |
| 12.5 (½") | 12.0 | 16.8 | |
| 9.5 (3/8") | 10.6 | 18.5 | |
| 4.75 (#4) | 10.6 | 17.1 | |
| Sphericity | 25 (1.0") | 0.0066 | 0.0178 |
| 19 (¾") | 0.0061 | 0.0171 | |
| 12.5 (½") | 0.0073 | 0.0134 | |
| 9.5 (3/8") | 0.0070 | 0.0132 | |
| 4.75 (#4) | 0.0092 | 0.0175 | |
| Flat or Elongated 3:1 | 25 (1.0") | 0.0140 | 0.0337 |
| 19 (¾") | 0.0139 | 0.0335 | |
| 12.5 (½") | 0.0167 | 0.0245 | |
| 9.5 (3/8") | 0.0198 | 0.0360 | |
| 4.75 (#4) | 0.0271 | 0.0331 | |
| 2D Form | 2.36 (#8) | 0.1556 | 0.1876 |
| 1.18 (#16) | 0.1811 | 0.2212 | |
| 0.6 (#30) | 0.1679 | 0.2206 | |
| 0.3 (#50) | 0.1793 | 0.2731 | |
| 0.15 (#100) | 0.2294 | 0.2733 | |
| 0.075 (#200) | 0.4553 | 0.5570 | |
| Aggregate Shape Characteristic | Aggregate Size | Coefficient of Variation | |
|---|---|---|---|
| Single-Operator | Multi-Laboratory | ||
| Angularity | 25 (1.0") | 2.5% | 3.8% |
| 19 (¾") | 2.8% | 3.8% | |
| 12.5 (½") | 2.3% | 3.6% | |
| 9.5 (3/8") | 2.2% | 4.0% | |
| 4.75 (#4) | 2.8% | 4.2% | |
| 2.36 (#8) | 2.6% | 2.7% | |
| 1.18 (#16) | 2.2% | 2.8% | |
| 0.6 (#30) | 2.5% | 3.3% | |
| 0.3 (#50) | 3.2% | 5.5% | |
| 0.15 (#100) | 4.1% | 6.0% | |
| 0.075 (#200) | 10.8% | 14.2% | |
| Texture | 25 (1.0") | 3.5% | 5.6% |
| 19 (¾") | 3.7% | 5.8% | |
| 12.5 (½") | 4.1% | 5.6% | |
| 9.5 (3/8") | 3.9% | 6.4% | |
| 4.75 (#4) | 4.9% | 7.9% | |
| Sphericity | 25 (1.0") | 0.9% | 2.5% |
| 19 (¾") | 0.9% | 2.5% | |
| 12.5 (½") | 1.1% | 2.0% | |
| 9.5 (3/8") | 1.1% | 2.0% | |
| 4.75 (#4) | 1.3% | 2.5% | |
| Flat or Elongated 3:1 | 25 (1.0") | 1.3% | 2.9% |
| 19 (¾") | 1.3% | 2.7% | |
| 12.5 (½") | 1.6% | 2.3% | |
| 9.5 (3/8") | 2.0% | 3.7% | |
| 4.75 (#4) | 2.8% | 3.5% | |
| 2D Form | 2.36 (#8) | 2.2% | 2.6% |
| 1.18 (#16) | 2.4% | 2.9% | |
| 0.6 (#30) | 2.2% | 2.9% | |
| 0.3 (#50) | 2.3% | 3.6% | |
| 0.15 (#100) | 3.1% | 3.7% | |
| 0.075 (#200) | 5.0% | 6.2% | |
| Aggregate Shape Characteristic | Constant Standard Deviation | |
|---|---|---|
| Single-Operator | Multi-Laboratory | |
| Angularity | 61.8 | 109.3 |
| Texture | 6.6 | 12.7 |
| Sphericity | 0.0089 | 0.0162 |
| Flat or Elongated 3:1 | 0.0077 | 0.0124 |
| 2D Form | 0.1249 | 0.1612 |
| Aggregate Shape Characteristic | Coefficient of Variation | |
|---|---|---|
| Single-Operator | Multi-Laboratory | |
| Angularity | 2.1% | 3.6% |
| Texture | 2.4% | 4.9% |
| Sphericity | 1.3% | 2.4% |
| Flat or Elongated 3:1 | 0.8% | 1.2% |
| 2D Form | 1.7% | 2.1% |
Based on these precisions statements, the results of two properly conducted tests (d2s%) which are tested either by a single-operator or multi-laboratory are not expected to differ more than the values shown in Table 3.16, Table 3.17, Table 3.18, and Table 3.19. These numbers are based on the calculations described in ASTM C 670-96.
| Aggregate Shape Characteristic | Aggregate Size | Standard Deviation | |
|---|---|---|---|
| Single-Operator | Multi-Laboratory | ||
| Angularity | 25 (1.0") | 167.8 | 257.0 |
| 19 (¾") | 222.5 | 299.9 | |
| 12.5 (½") | 183.8 | 288.4 | |
| 9.5 (3/8") | 176.3 | 323.9 | |
| 4.75 (#4) | 219.3 | 312.4 | |
| 2.36 (#8) | 215.4 | 224.5 | |
| 1.18 (#16) | 194.8 | 248.5 | |
| 0.6 (#30) | 229.3 | 308.9 | |
| 0.3 (#50) | 290.8 | 513.2 | |
| 0.15 (#100) | 322.9 | 469.7 | |
| 0.075 (#200) | 851.3 | 1164.1 | |
| Texture | 25 (1.0") | 29.3 | 46.4 |
| 19 (¾") | 31.6 | 50.2 | |
| 12.5 (½") | 34.0 | 47.6 | |
| 9.5 (3/8") | 29.8 | 52.2 | |
| 4.75 (#4) | 30.0 | 48.2 | |
| Sphericity | 25 (1.0") | 0.0186 | 0.0504 |
| 19 (¾") | 0.0172 | 0.0483 | |
| 12.5 (½") | 0.0206 | 0.0379 | |
| 9.5 (3/8") | 0.0198 | 0.0374 | |
| 4.75 (#4) | 0.0261 | 0.0496 | |
| Flat or Elongated 3:1 | 25 (1.0") | 0.0396 | 0.0953 |
| 19 (¾") | 0.0393 | 0.0948 | |
| 12.5 (½") | 0.0471 | 0.0694 | |
| 9.5 (3/8") | 0.0560 | 0.1018 | |
| 4.75 (#4) | 0.0765 | 0.0938 | |
| 2D Form | 2.36 (#8) | 0.4402 | 0.5306 |
| 1.18 (#16) | 0.5122 | 0.6255 | |
| 0.6 (#30) | 0.4748 | 0.6238 | |
| 0.3 (#50) | 0.5070 | 0.7724 | |
| 0.15 (#100) | 0.6488 | 0.7729 | |
| 0.075 (#200) | 1.2877 | 1.5756 | |
| Aggregate Shape Characteristic | Aggregate Size | Coefficient of Variation | |
|---|---|---|---|
| Single-Operator | Multi-Laboratory | ||
| Angularity | 25 (1.0") | 7.0% | 10.8% |
| 19 (¾") | 8.0% | 10.8% | |
| 12.5 (½") | 6.4% | 10.0% | |
| 9.5 (3/8") | 6.3% | 11.3% | |
| 4.75 (#4) | 8.0% | 11.7% | |
| 2.36 (#8) | 7.3% | 7.6% | |
| 1.18 (#16) | 6.1% | 7.9% | |
| 0.6 (#30) | 7.0% | 9.4% | |
| 0.3 (#50) | 9.2% | 15.5% | |
| 0.15 (#100) | 11.7% | 17.1% | |
| 0.075 (#200) | 30.6% | 40.2% | |
| Texture | 25 (1.0") | 9.8% | 15.8% |
| 19 (¾") | 10.5% | 16.4% | |
| 12.5 (½") | 11.5% | 15.8% | |
| 9.5 (3/8") | 11.0% | 18.0% | |
| 4.75 (#4) | 13.7% | 22.4% | |
| Sphericity | 25 (1.0") | 2.5% | 7.1% |
| 19 (¾") | 2.5% | 7.1% | |
| 12.5 (½") | 3.1% | 5.7% | |
| 9.5 (3/8") | 3.0% | 5.7% | |
| 4.75 (#4) | 3.8% | 7.2% | |
| Flat or Elongated 3:1 | 25 (1.0") | 3.5% | 8.2% |
| 19 (¾") | 3.8% | 7.7% | |
| 12.5 (½") | 4.6% | 6.6% | |
| 9.5 (3/8") | 5.7% | 10.4% | |
| 4.75 (#4) | 7.8% | 9.8% | |
| 2D Form | 2.36 (#8) | 6.1% | 7.4% |
| 1.18 (#16) | 6.8% | 8.3% | |
| 0.6 (#30) | 6.1% | 8.1% | |
| 0.3 (#50) | 6.6% | 10.2% | |
| 0.15 (#100) | 8.7% | 10.4% | |
| 0.075 (#200) | 14.2% | 17.6% | |
| Aggregate Shape Characteristic | Standard Deviation | |
|---|---|---|
| Single-Operator | Multi-Laboratory | |
| Angularity | 174.8 | 309.3 |
| Texture | 18.7 | 35.8 |
| Sphericity | 0.0250 | 0.0459 |
| Flat or Elongated 3:1 | 0.0217 | 0.0350 |
| 2D Form | 0.3533 | 0.4558 |
| Aggregate Shape Characteristic | Coefficient of Variation | |
|---|---|---|
| Single-Operator | Multi-Laboratory | |
| Angularity | 5.8% | 10.3% |
| Texture | 6.8% | 14.0% |
| Sphericity | 3.7% | 6.7% |
| Flat or Elongated 3:1 | 2.1% | 3.5% |
| 2D Form | 4.7% | 6.1% |
The machines were calibrated before each laboratory scanned the materials to eliminate possible sources of error. The 0.075 mm (ASTM #200 sieve) has larger than expected single-operator and multi-laboratory standard deviation. After investigation into the possible sources of error, the CHPR value, which is used to eliminate touching particles from the data before it is analyzed, was found to be the source of error.6 The limits of the CHPR value were believed allow several touching particles to be analyzed. This was determined by an inspection of the number of touching particles in the images from the analyzed data. Therefore, the 0.075 mm (ASTM #200 sieve) results should be further examined after developing a more robust method to eliminate touching particles. Once such a method is developed, precision statements for the standard deviation and coefficient of variation results will be developed for this size.
Conclusions
The analysis conducted in this chapter lead to the development of precision statements for the different shape indices and parameters given by AIMS2. In general, the experiments gave very reasonable coefficient of variation for the various indices for all sizes except the 0.075 mm size. The results from the constant coefficient of variation should be used to describe the precision statement since the standard deviation results have a slight trend of increase with an increase in average. Therefore, a precision statement based on constant standard deviation will be biased against materials with low average and work in favor of materials with high average. Overall, the maximum coefficient of variation was less than 5% for a single operator and less than 8% for multi laboratories when individual sizes were analyzed. The maximum coefficient of variation for the combined results of a blend was less than 3% for a single operator and less than 5% for multi laboratories. These are considered acceptable coefficient of variation values given the natural variation in aggregate samples from the same source.
Further tests will be necessary to determine the proper CHRP calibrated value for the 0.075 mm (ASTM #200 sieve) in order to remove touching particles in the analysis. The determination of this value is expected to reduce the variations in the measurements conducted on the 0.075 mm sieve, and reduce the precision coefficient of variation reported for this size.
The precision statements from the constant coefficient of variations were combined for aggregates sizes, excluding 0.075 mm (ASTM #200 sieve), for each aggregate shape characteristic. The was done by taking the square root of the sum divided by n-1 of the squares of all sizes except 0.075 mm (ASTM #200 sieve) for each aggregate shape property. Where n is the number of values sum. The precision statements for the single limit (1s%) and difference of two results (d2s%) are shown in Table 3.20 and Table 3.21, respectively.
| Aggregate Shape Characteristic | Constant Coefficient of Variation | |
|---|---|---|
| Within-Laboratory | Between-Laboratory | |
| Angularity | 2.9% | 4.3% |
| Texture | 4.5% | 7.1% |
| Sphericity | 1.2% | 2.6% |
| Flat or Elongated 3:1 | 2.1% | 3.4% |
| 2D Form | 2.7% | 3.5% |
| Aggregate Shape Characteristic | Constant Coefficient of Variation | |
|---|---|---|
| Within-Laboratory | Between-Laboratory | |
| Angularity | 8.3% | 12.2% |
| Texture | 12.7% | 20.0% |
| Sphericity | 3.4% | 7.4% |
| Flat or Elongated 3:1 | 5.9% | 9.7% |
| 2D Form | 7.7% | 10.0% |
5 Jay L. Devore (Ed.), Probability and Statistics for Engineering and the Sciences, 6th ed., 2004.
6 E. Mahmoud, L. Gates, E. Masad, S. Erdogafan, and E. Garboczi, "Comprehensive Evaluation of AIMS Texture, Angularity, and Dimension Measurements," Journal of Materials in Civil Engineering, vol. 22, no. 4, pp. 369–79, 2010.