

Evaluation of The TAPCO Sequential Dynamic Curve Warning System
SELECTION OF TEST SITES FOR SDCW
The intent of this project was to evaluate the TAPCO SDCWS in five participant States (Iowa, Missouri, Texas, Washington, and Wisconsin). The research team developed site selection criteria for each and worked with each State to develop a list of candidate locations. The site selection criteria included the following:
- Two-lane rural paved roads.
- Posted speed limit of 50 mph or above.
- Existing chevrons.
- No unusual conditions within the curve (e.g., railroad crossing or major access).
- High crash location (10 or more crashes in the last 5 years, not including animal collisions); speed-related crashes preferred.
- No major rehabilitation/changes in alignment/operations in the last 3 years.
- No major rehabilitation/changes in alignment/operations planned for the next 2 years.
Specific information requested for each candidate site included:
- Curve location (Google map, latitude/longitude, etc.).
- Crash data including the location, direction, type, date, causation, etc.
- Posted speed limit (mph).
- Advisory curve speed, if present (mph).
- AADT.
- Truck traffic data, if available.
- Presence of passing lanes.
After reviewing the information from each State, the team developed a finalized list of potential sites and then conducted site visits. Final test sites were then selected in each State. The general methodology used to select sites in each State is described in the following sections.
Initial Review
A request for initial data was made to each State. The States were asked to provide data on multiple high-crash curve sites on rural two-lane roadways. It was left up to the discretion of each agency to determine what they thought were high-crash locations. Rural was defined as being at least 1 mile outside an incorporated area. Each curve was required to meet the following criteria:
- No rehabilitation or reconstruction activities that change the geometry of the roadway scheduled during the 2-year assessment.
- No geometric or cross-section changes made for 3 years prior to the study.
- Posted speed limit on tangent section 50 mph or greater.
Each State was also asked to provide the following information about the potential sites:
- Crash frequency.
- Traffic volume (AADT and percent trucks).
- Geometry (lane width, shoulder width, and type).
- Speed limit (posted or advisory) in mph.
The research team spatially located each site using Google Earth or the aerial images provided by the agency. The suitability of each curve location was evaluated, and locations that had major developments, railroads, or major points of access, including intersections other than low-volume intersections, were eliminated. Following this, additional information about the remaining sites was requested from each State, including:
- Presence of posted speed advisory on curve.
- Information about crashes (speed-related, severity, etc.).
- Expert opinion about safety and speed problems.
- Existence of unusual traffic or other conditions.
Based on the information received, the sites were ranked in terms of number of crashes with a threshold of at least 5 crashes over a 5-year period being used to define a high-crash location.
Figure 8 shows the 10 candidate curve locations identified by the Washington State Department of Transportation (DOT) for which the team conducted site visits. A similar site visit map of candidate test locations was developed for each State.
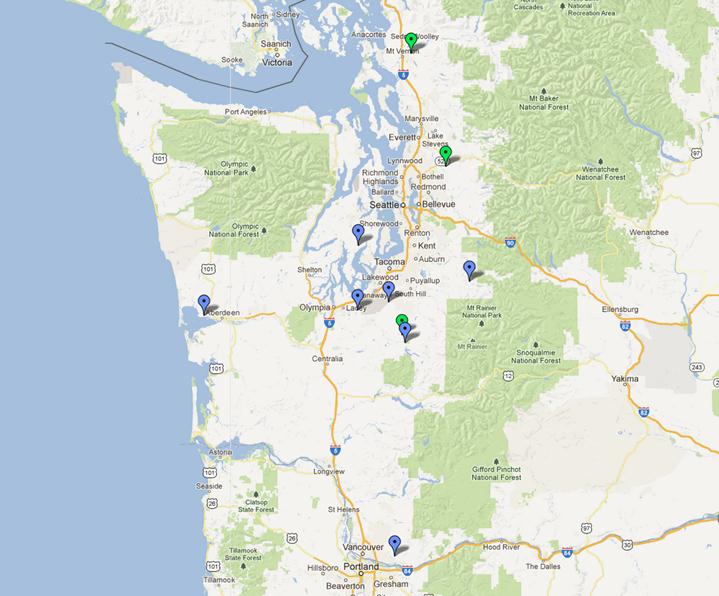
Figure 8. Map. Washington State DOT candidate sites.
Site Visits
The research team conducted site visits to all candidate locations. These field observations identified roadway characteristics including curve layout, operational conditions, presence of speed and advisory signs, and relevant roadway conditions (see the example photo in figure 9).
In addition, a speed study was conducted using a radar gun to verify whether a speeding problem exists. (An example of the site visit data collection form is shown in figure 10.) At least 25 speed observations were collected for both directions of traffic unless physically prohibited due to site conditions or topography. Mean speed, by direction, was calculated for each location. When sample size was sufficient, 85th percentile speeds were calculated. A speeding problem was identified if at least one of the following conditions existed:
- Mean speed exceeded the advisory speed limit by 5 mph or more, or, if an advisory speed was not posted, exceeded the posted speed limit by 5 mph or more.
- 85th percentile speed exceeded the advisory speed limit by 5 mph or more, or exceeded the posted speed limit by 5 mph or more, if an advisory speed was not present.
A field report was prepared which included all of the field information collected for each site visited; see the example shown in figure 11.
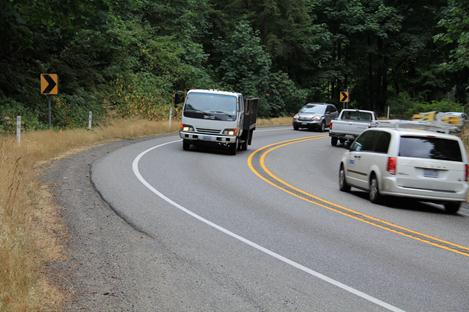
Figure 9. Photo. Candidate curve site in Washington State.
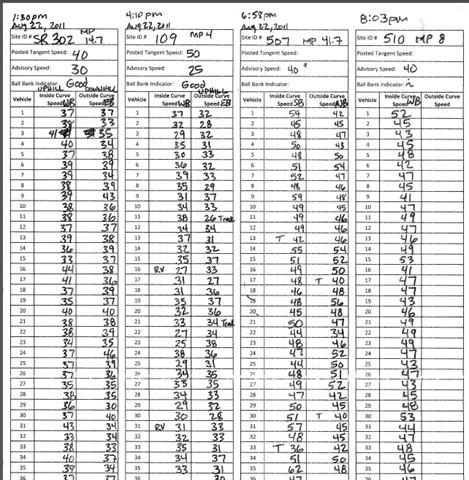
Figure 10. Chart. Example site visit speed data collection form.
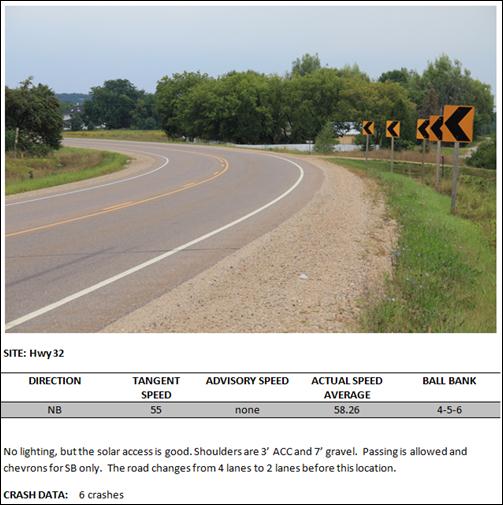
Figure 11. Photo. Example field report from initial visit.
Selection of Final Sites
Following the site visits, the research team selected the final test curve locations for installation of the TAPCO SDCWS, as shown in table 2 and figure 12.
| State | Number of Test Sites |
|---|---|
| Iowa | 1 |
| Missouri | 1 |
| Texas | 4 |
| Washington | 3 |
| Wisconsin | 3 |
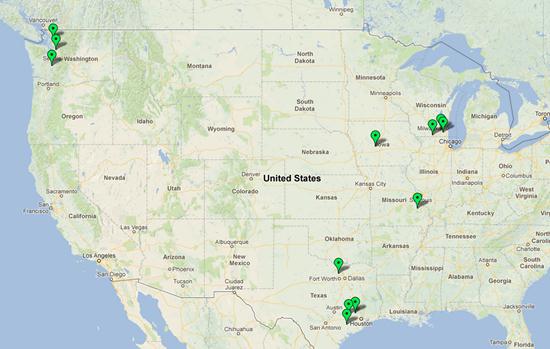
Figure 12 Map. Final test site locations.
Selection of Study Direction
Since only one SDCWS was installed per curve location, it was necessary to determine in which direction of travel the system would be installed (e.g., eastbound versus westbound). If one direction had a higher percentage of speed-related and/or single-vehicle run-off-road crashes than the other direction, the SDCWS was placed for this direction. It should be noted that direction information was not available for all crashes. If no predominant crash direction was noted, the SDCWS was assigned to whichever direction of travel had the highest speeds based on the initial speed study.
Final Site Information by State
Table 3 provides a summary of curve site characteristics for each final test site location. Appendix A includes a summary of the baseline data for each test location.
Study |
Crashes |
Years |
Crashes/ |
ADT |
Roadway Geometry | Posted |
Curve |
Chevrons |
Chevron |
Access |
||||
|---|---|---|---|---|---|---|---|---|---|---|---|---|---|---|
Lanes |
Lane |
Road |
Shoulder |
Shoulder |
||||||||||
| EB | 8 | 5 | 1.6 | 1,435 | 2 | 12 | Asphalt | 4 | Gravel | 55 | 45 | 7 | 30x36 | Yes |
| NB | 31 | 5 | 6.2 | 1,000 | 2 | 11 | Asphalt | 4 | Asphalt | 55 | 40 | 6 | 18x24 | No |
| WB | 7 | 3 | 2.3 | 3,583 | 2 | 12 | Asphalt | 2 | Mix | 55 | 30 | 9 | 18x24 | Yes |
| SB | 9 | 3 | 3.0 | 3,494 | 2 | 12 | Asphalt | 3 | Mix | 55 | 25 | 5 | 18x24 | No |
| SB | 7 | 3 | 2.3 | 2,369 | 2 | 12 | Asphalt | 3 | Asphalt | 55 | 50 | 5 | 18x24 | Yes |
| SB | 19 | 5 | 3.8 | 1,408 |
2 | 11 | Asphalt | 3 | Asphalt | 50 | 20 | 3 | 24x30 | Yes |
| SB | 6 | 5 | 1.2 | 5,800 | 2 | 10 | Asphalt | 2 | Asphalt | 50 | 40 | 3 | 18x24 | Yes |
| SB | 5 | 5 | 1.0 | 11,000 | 2 | 11 | Asphalt | 5 | Asphalt | 55 | 40 | 6 | 18x24 | No |
| EB | 10 | 7 | 1.4 | 5,000 | 2 | 11 | Treated Surface | 1 | Treated Surface | 55 | 40 | 5 | 18x24 | Yes |
| NB | 8 | 7 | 1.1 | 4,400 | 2 | 11 | Treated Surface | 4 | Treated Surface | 55 | 40 | 13 | 18x24 | No |
| NB | 16 | 7 | 2.3 | 2,500 | 2 | 11 | Treated Surface | 2 | Treated Surface | 60 | 35 | 6 | 18x24 | Yes |
| WB | 9 | 7 | 1.3 | 560 | 2 | 11 | Asphalt | 2 | Asphalt | 60 | 35 | 6 | 18x24 | Yes |