

Evaluation of The TAPCO Sequential Dynamic Curve Warning System
METHODOLOGY FOR SPEED DATA COLLECTION
The collection of traffic speed and volume data was integral to this project because these data provide the before-and-after contrast necessary to assess the effectiveness of the SDCWS.
Equipment
Pneumatic road tubes and counters were used to collect speed and volume data. The advantage of the road tubes is that they are reasonably accurate, can collect individual vehicle speeds (allowing for spot-checking of the data), are low-cost, and are nondestructive to the existing roadway surface. The counters used were Trax I automatic traffic recorders manufactured by JAMAR Technologies, Inc. The units can collect individual vehicle speeds, headways, vehicle class, and volume.
For each data collection period, the counters were set up to record time, vehicle speed, and vehicle class for individual vehicles. Other metrics such as volume, headway, average speed, etc., can be calculated from these data. Since time on the counter can drift the counters, clocks were checked and reset each time they were used.
Data Collection Periods
Speed and volume data were collected at each test location using the pneumatic road tubes. Data collected about 1 month before installation are referred to as "before" data. Data collected about 1 month after installation are referred to as "1 month after" data. In all States, data will be collected again at about 12 and 18 months after installation (referred to as "1 year" and "18 months" data).
Data Collection Protocol and Quality Assurance
Speed and volume data were collected at three locations per test site. The goal was to understand driver speed selection in advance, at the beginning of the curve, and within the curve. These three locations are described below and shown in figure 15:
- Upstream – Road tubes were placed approximately 500 ft before the advanced curve warning sign (just in advance of being detected by the radar within the advance curve warning sign).
- PC – These tubes were placed at the point of curvature or beginning point of the curve.
- CC – Tubes placed within the center of the curve.
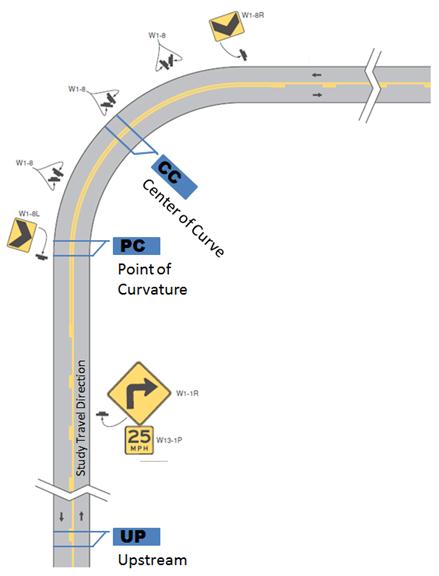
Figure 15. Diagram. Typical traffic counter placement.
In most cases, data were collected for at least 1 day (24 hours) during the week (Monday through Friday). During data collection, the equipment was spot checked to determine whether any problems had occurred. Common problems included the pneumatic tubes getting pulled up from the pavement, the tubes being damaged in some way, or the counters malfunctioning.
Data were checked in the field during data collection to spot problems early, and the full data sets were checked when data collection was complete. Data were checked for the following situations that, based on the team's experience, indicate problems with the counters:
- Large number of low speeds (≤5 mph).
- Large number of high speeds (90 mph and higher) (this usually indicates a problem with road tube layout).
- Large number of vehicles with vehicle classification = 14 (class = 14 are vehicles that the counter cannot identify).