Instructors
Patrick DeCorla-Souza
P3 Program Manager
Center for Innovative Finance Support

Marcel Ham
Vice President
IMG Rebel

P3-VALUE 2.0 Webinars
- P3: Public Private Partnership
- P3-VALUE 2.0: Analytical tool to help practitioners
understand processes used to quantitatively evaluate P3 options
- This is one of a series of webinars on P3-VALUE
- P3 Evaluation Overview (January 25, 2016)
- Value for Money Analysis (February 8, 2016)
- Value for Money Exercise (Feb. 16, 2016)
- Project Delivery Benefit-Cost Analysis (Feb. 22)
- Project Delivery BCA Exercise (Feb. 29, 2016)
- Risk Assessment (March 7, 2016)
- Risk Assessment Exercise (March 14)
- Financial Viability Assessment (today)
Webinar Outline
Part 1 - P3 Project Financing
Part 2 - P3 Financial Structure
Part 3 - Traffic & Revenue Forecasting
Part 4 - Financial Viability Analysis
Part 5 - Financial Models
Part 6 - Using P3-VALUE for Financial Viability Assessment
Recap - Summary of Webinar
Webinar Objectives
After this webinar you should be able to:
- Explain how P3s are structured
- Describe the process for toll revenue forecasting
- Describe the key metrics used to evaluate the financial viability
of a P3 project
- Describe the role of financial models and list key inputs and
outputs
Part 1 - What is P3 Project Financing
What is Financing?
Method by which an investment is paid for:
- A temporary provision of funds in exchange for a return paid
to investors from future revenues
- Bridges mismatch in timing between ultimate funding source (e.g.
tolls/availability payments) and required investments (e.g. capex)
What is Project Finance?
- Financing of (infrastructure) projects based on future project
cash revenues (typically tolls or availability payments for roads)
- Non-recourse debt secured by project assets and repaid from
project cash flows only
View larger version of the chart
Special Purpose Vehicle
- Set up to finance the activities of a specific project
- Created to ring fence project's assets and cash flows from
private sponsor's other activities
- No recourse to private sponsor's balance sheet, limiting
exposure of private sponsors in case of bankruptcy
- Financiers may ignore the private sponsor's other activities
that are not part of the project
Typical Toll Concession
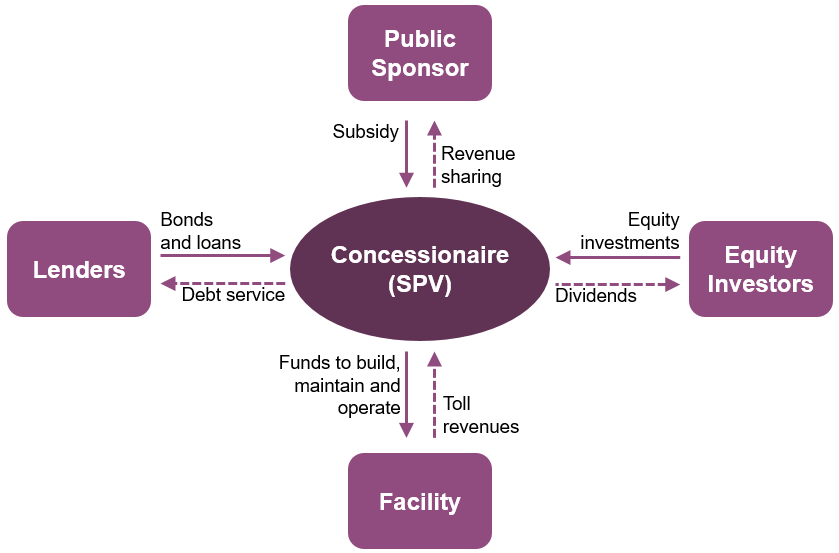
View larger version of the Typical Toll Concession flow chart
Typical Availability Payment P3
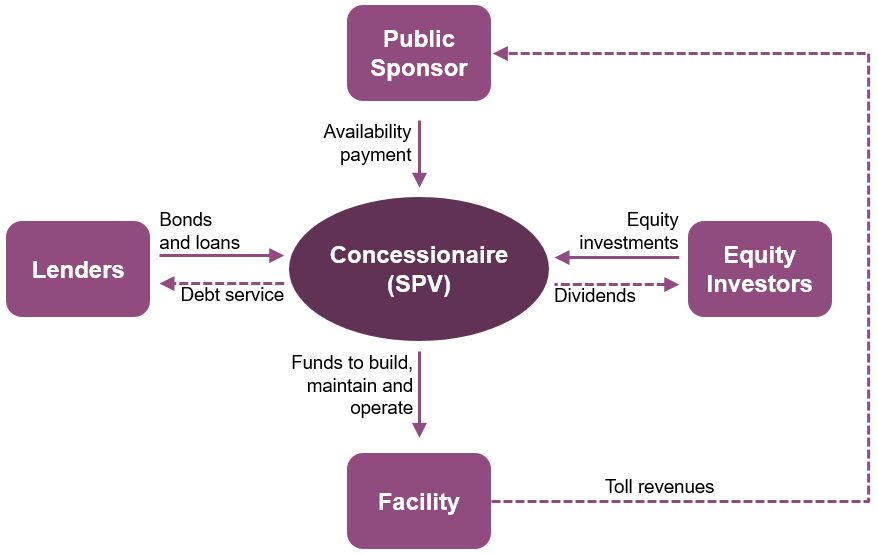
View larger version of the Typical Availability Payment P3 flow chart
Test Your Knowledge
True or False
- An SPV's debt providers have no recourse to the private sponsor's
balance sheet in case of bankruptcy of the SPV.
Questions?
Submit a question using the chat box
Part 2 - P3 Financial Structure
Typical Cash Flow Waterfall
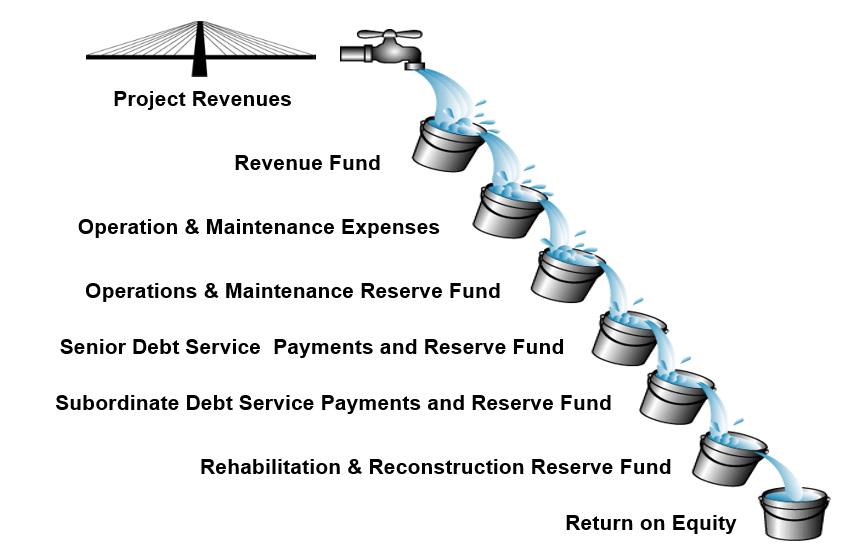
View larger version of the Cash Flow Waterfall
Text of Typical Cash Flow Waterfall
- Project Revenues
- Revenue Fund
- Operation & Maintenance Expenses
- Operations & Maintenance Reserve Fund
- Senior Debt Service Payments and Reserve
Fund
- Subordinate Debt Service Payments
and Reserve Fund
- Rehabilitation & Reconstruction
Reserve Fund
Sources of Project Revenues
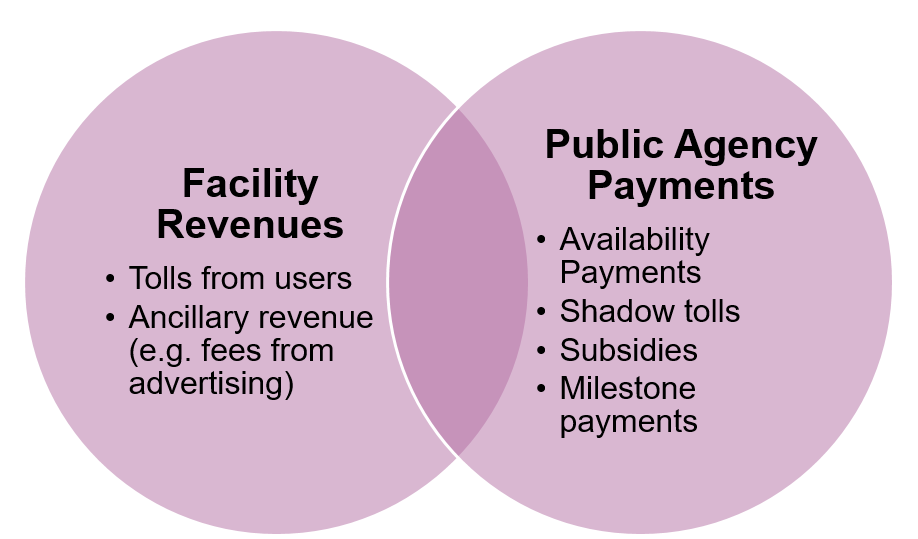
Text of graphic
| Facility Revenues |
Public Agency Payments |
- Tolls from users
- Ancillary revenue (e.g. fees from advertising)
|
- Availability Payments
- Shadow tolls
- Subsidies
- Milestone payments
|
Sources of Project Financing: Equity
- Infrastructure development companies
- Private equity and infrastructure funds
- Pension funds, foundations, insurance companies, etc.
Sources of Project Financing: Debt
Loans
- Private bank loans
- TIFIA loans
Bonds
- Private Activity Bonds (PABs)
- Project revenue bonds
Debt Repayment
Annuity type:
- Equal payment amount every period
- Multiple tranches may be used with differing maturities
Interest only:
- "Bullet" payment of principal at maturity
Sculpted repayment:
- Debt service payment is a mix of interest and principal that
is "sculpted" to match the revenue stream profile
Annuity Debt Repayment
Example of annuity type debt service: Equal debt service payments
in all years
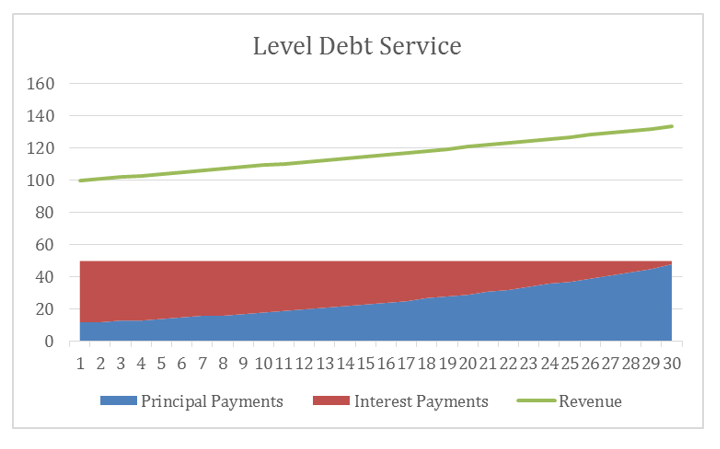
View larger version of the Level Debt Service chart
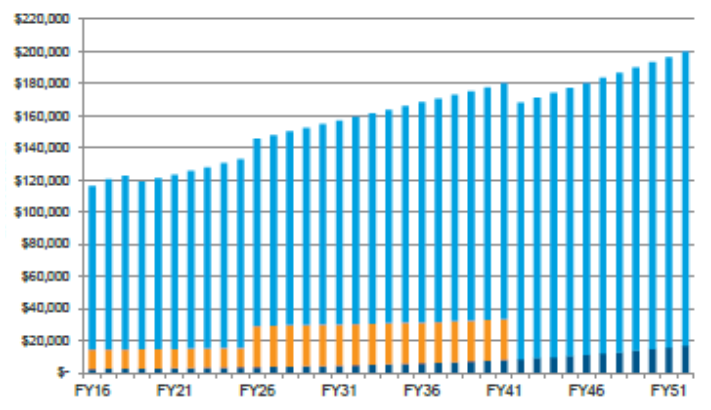
Sculpted Debt Repayment
Example of sculpted debt service: Debt service follows net revenue
profile, hence optimizing debt capacity
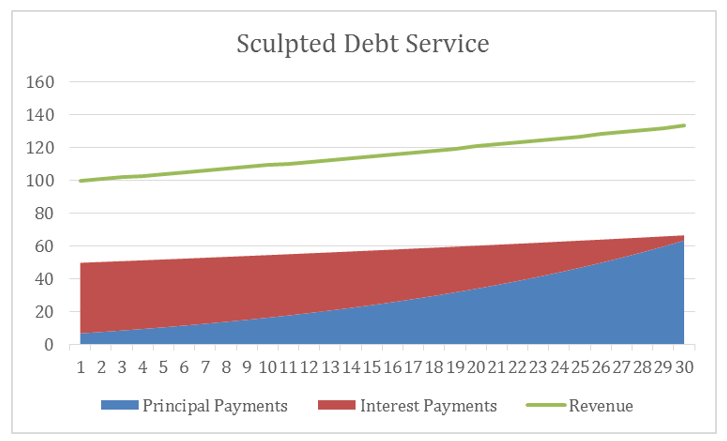
View larger version of the Sculpted Debt Service chart
Risk and Leverage
- Leverage (or gearing or debt-to-equity ratio) indicates debt
as a share of total required financing
- As debt service is paid before dividends, equity finance forms
a buffer for debt, making debt less risky
- Lenders require less equity for projects with lower risks
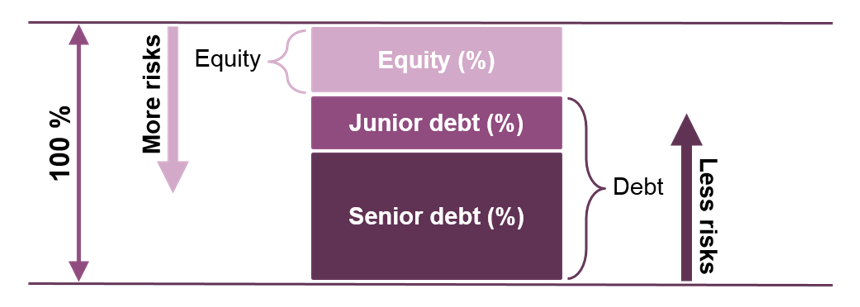
View larger version of the equity and debt risk and leverage chart
Leverage vs. Required Revenues
| |
50/50
leverage |
90/10
leverage |
| Project cost (millions) |
$1,000 |
$1,000 |
| (a) Debt |
$500 |
$900 |
| (b) Equity |
$500 |
$100 |
| (c) Required rate of return on equity |
15% |
15% |
| (d) Annual return on equity: (b) x (c) |
$75 |
$15 |
| (e) Annual interest rate on debt |
5% |
6% |
| (f) Interest payment: (a) x (e) |
$25 |
$54 |
| Annual revenue required to pay for financing: (d)
+ (f) |
$100 |
$69 |
Note: his simplified example assumes "bullet"
repayments of the principal on debt and the equity investment at the
end of the concession term. It also does not consider minimum DSCR requirements
(see later).
Equity in US Transportation P3s
| Project |
Concession Type |
Equity (% of
Financing) |
Equity (% of Cost) |
| I-95 HOT Lanes |
Toll |
35% |
32% |
| LBJ-635 Corridor |
Toll |
31% |
25% |
| North Tarrant Express |
Toll |
29% |
21% |
| I-495 HOT Lanes |
Toll |
23% |
18% |
| Midtown Tunnel |
Toll |
17% |
11% |
| SH-130 Segment V-VI |
Toll |
16% |
16% |
| I-595 |
AP |
13% |
11% |
| Presidio Parkway |
AP |
12% |
12% |
| Port of Miami Tunnel |
AP |
11% |
7% |
| East End Crossing |
AP |
10% |
10% |
Source: Official bond statements
Credit Enhancements
External
- Letters and lines of credit
- Bond insurance
- Construction risk guaranties
- Governmental guaranties
Internal
- Cash reserves
- Debt tranches (senior vs. junior)
- Cash flow optimization (apply excess cash to prepay ahead of
scheduled amortization)
Test Your Knowledge
True or False
- A sculpted debt repayment schedule is able to optimize debt
capacity.
Questions?
Submit a question using the chat box
Part 3 - Traffic & Revenue Forecasting
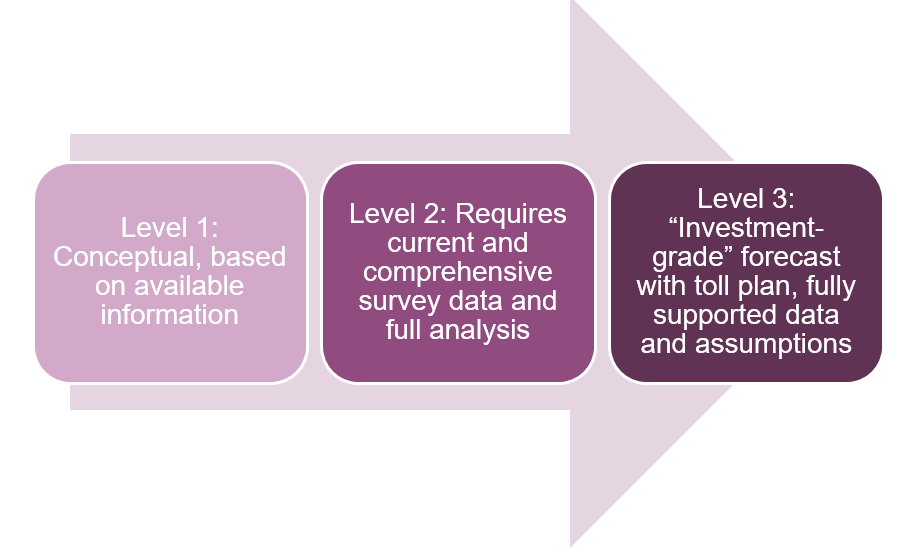
Traffic & Revenue Forecasts
Text of graphic
Level 1: Conceptual, based on available information
Level 2: Requires current and comprehensive survey data and
full analysis
Level 3: "Investment- grade" forecast with toll
plan, fully supported data and assumptions
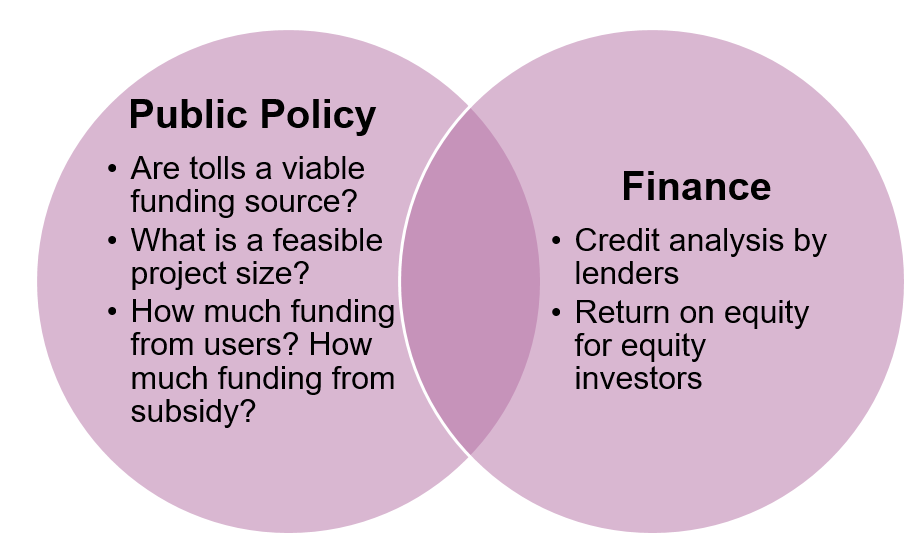
Use of Traffic & Revenue Forecasts
Text of graphic
| Public Policy |
Finance |
- Are tolls a viable funding source?
- What is a feasible project size?
- How much funding from users? How much funding
from subsidy?
|
- Credit analysis by lenders
- Return on equity for equity investors
|
Debt Rating
Credit agencies rate transaction (not forecast):
- Stress test the traffic & revenue (T&R) forecasts
- Assess security of the finance structure (DSCR, leverage)
- Borrowers typically structure a finance plan to the standards
of a specific, desired "investment grade" rating
Regional Travel Forecasts
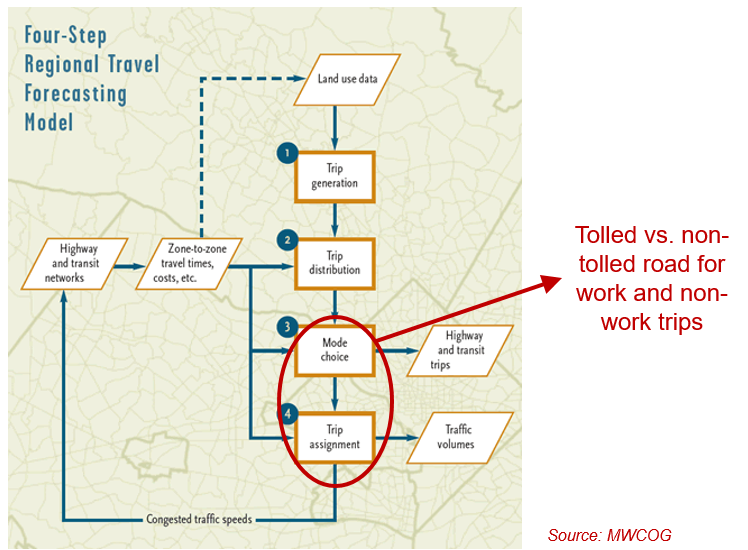
View larger version of the Regional Travel Forecasts map
Source: MWCOG
Project Traffic & Revenue Forecast
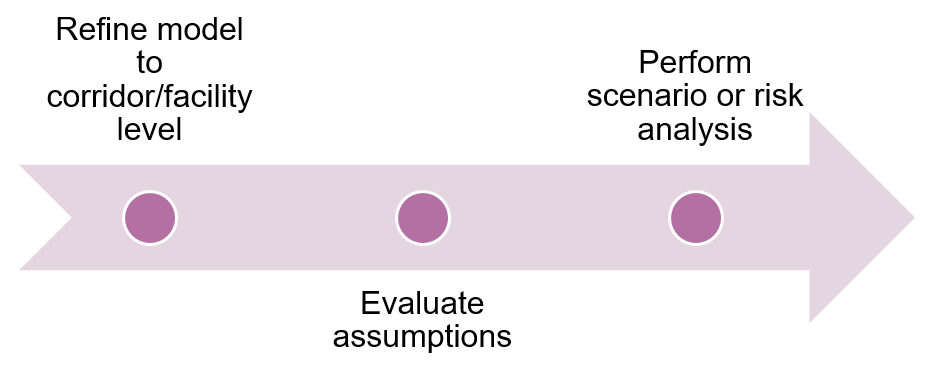
text of graphic
- Refine model to corridor/facility level
- Perform scenario or risk analysis
- Evaluate assumptions
Modeling Considerations
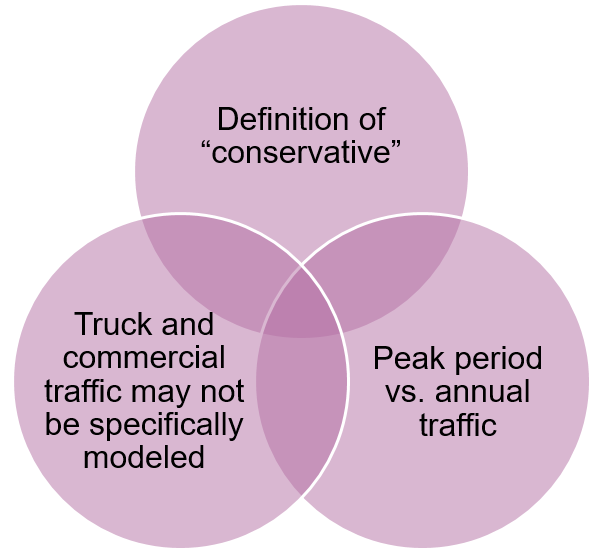
text of graphic
- Definition of "conservative"
- Truck and commercial traffic may not be specifically
modeled
- Peak period vs. annual traffic
Major Variables
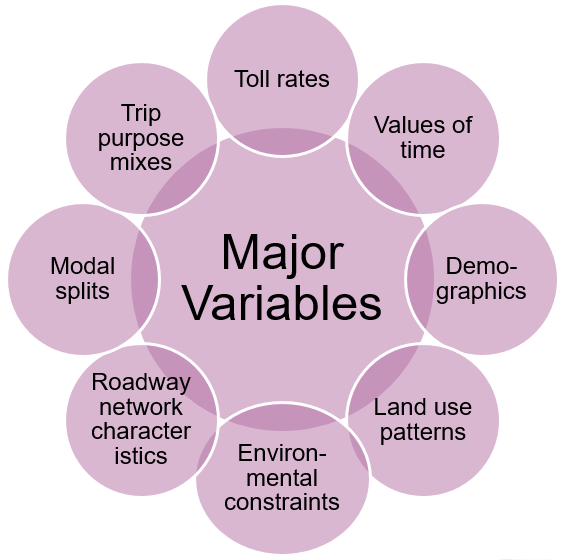
text of graphic
Major Variables
- Trip purpose mixes
- Toll rates
- Values of time
- Modal splits
- Demographics
- Roadway network characteristics
- Environmental constraints
- Land use patterns
Probabilistic Forecast
- Perform sensitivity analyses for each major variable (separately)
to estimate its relative significance
- Develop probability distribution functions for revenues
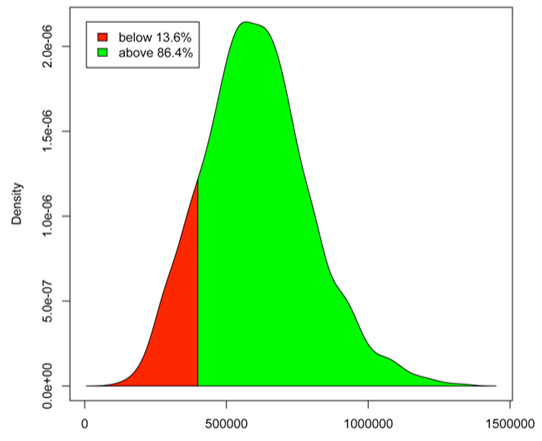
View larger version of the Probabilistic Forecast chart
Probabilistic Confidence Levels
- P50: 50% probability of revenue attainment
"Most likely" case, may be used by equity investors
- P90: 90% probability of revenue attainment
"Severe downside" case, may be used by debt providers
Test Your Knowledge
True or False
- Traffic forecasts obtained from regional travel models developed
by MPOs are more than adequate for the purpose of rating debt.
Questions?
Submit a question using the chat box
Part 4 - Financial Viability Analysis
Purpose
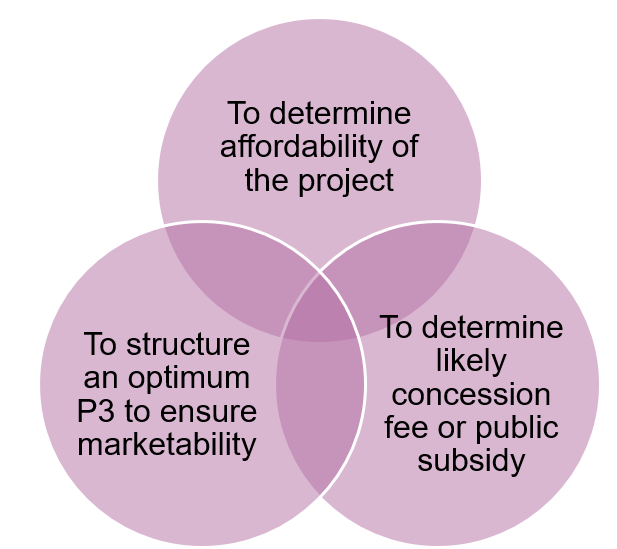
text of graphic
- To determine affordability of the project
- To structure an optimum P3 to ensure marketability
- To determine likely concession fee or public subsidy
Key Metrics for Public Agency
- Concession fee - for "NPV positive" projects
- Public subsidy - for "NPV negative" projects
- Toll rates
- Concession term
Key Financial Metrics
- Debt service coverage ratio (DSCR)
- Gearing (or debt-to-equity ratio)
- Equity internal rate of return (Equity IRR)
- Weighted average cost of capital (WACC)
Debt Service Coverage Ratio (DSCR)
- Debt service coverage ratio (DSCR) =
Cash Flow Available for Debt Service
(CFADS)
Required Annual Debt Service
Higher minimum debt service coverage ratio requirement reduces
debt capacity
2. Gearing
- Gearing (or debt-to-equity ratio) =
Debt Amount
Equity Amount
Higher gearing is the result of higher debt capacity and a lower
equity requirement
3. Equity Internal Rate of Return
- Equity IRR is the discount rate at which the NPV of equity cash
flows is zero
- Solve for r in the formula:
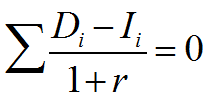
Where
Di = Equity distributions
Ii = Equity investments
Weighted Average Cost of Capital
- WACC is calculated by combining both cost of debt and equity
- Text book formula (applicable only if gearing is constant):
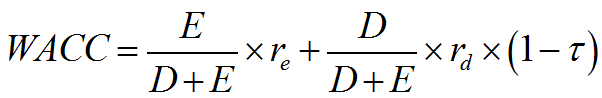 Where
Where
E = equity amount
D = debt amount
re= required equity return
rd=
debt interest rate
(1- r) = tax shield
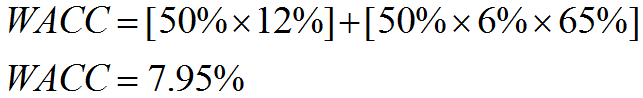
WACC Calculation: Textbook Example
- Equity amount = 50% of total financing
- Required equity return = 12%
- Debt amount = 50% of total financing
- Interest rate = 6%
- Tax rate = 35%, tax shield = 65%
WACC Calculation in Project Finance
- In project finance, debt-to-equity ratio changes over time,
so text book WACC formula cannot be applied
- WACC can be calculated by determining the internal rate of return
(IRR) of all financing cash flows, i.e., the Project IRR:
- Debt drawdown & debt service
- Equity investment & dividend payments
- Reserve movements
Project Internal Rate of Return
- Project IRR is the discount rate at which the NPV of financing
cash flows is zero
- Solve for r in the formula:
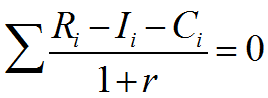
Where Ri= Revenues
Ii=
Investments
Ci= Operating costs
Test Your Knowledge
True or False
- A higher required minimum DSCR will allow a project to obtain
a higher amount of debt
Questions?
Submit a question using the chat box
Part 5 - Financial Models
Financial Calculations
| Funding/financing sources |
Uses of funds |
- Equity & debt
- Subsidies/Agency budget
- Toll revenues
|
- Capital expenses
- Operating expenses
- Debt service
- Tax & dividends
|
 |
|
| P3-VALUE 2.0 Financial
Model |
|
- Capacity of project revenues to repay debt
- Capacity to attract equity
- Required public subsidy payments
|
Discounting of Cash Flows
- Converts future costs and revenues to "present value"
terms
- Discount rate reflects risk and the time value of money
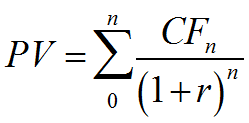
Where PV= Present Value
CFn=
Cash Flow in year n r = discount rate
n = year
Effects of Discounting
- Cash flows later in a concession period will have a relatively
lower impact
- In the example depicted below, the nominal and present value
of the cost cash flows in year 2020 are:
- Nominal value: $472M
- Present value: $370M
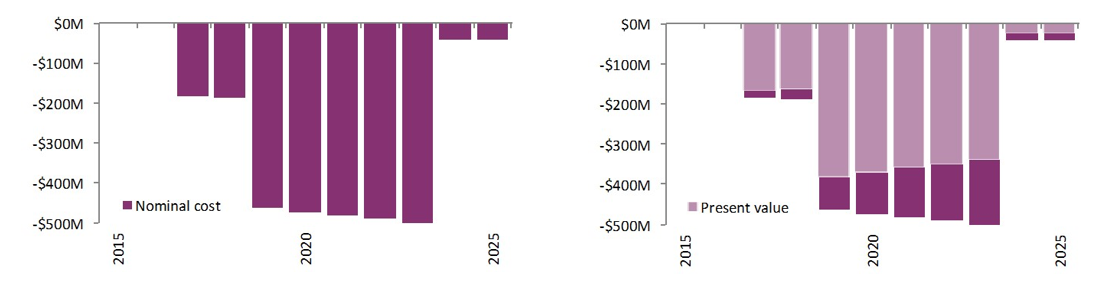
View larger version of the effects of discounting charts
Use of Financial Modeling
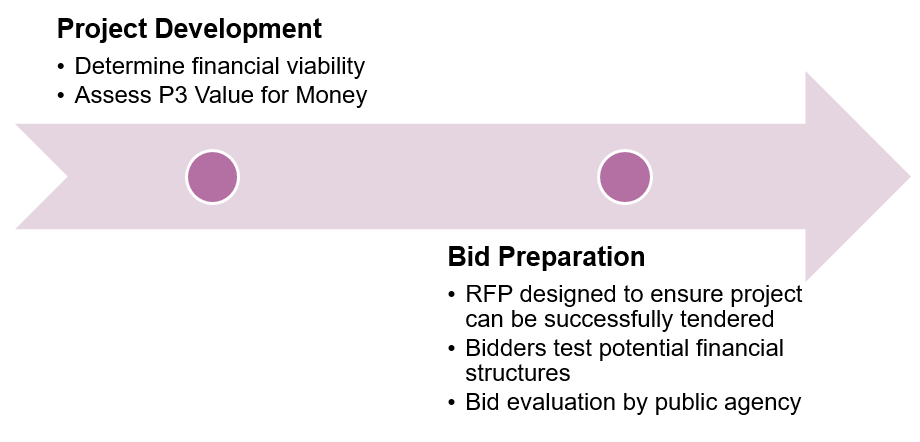
View larger version of the Financial Modeling steps
text of graphic
Project Development
- Determine financial viability
- Assess P3 Value for Money
Bid Preparation
- RFP designed to ensure project can be successfully tendered
- Bidders test potential financial structures
- Bid evaluation by public agency
Use of Financial Modeling
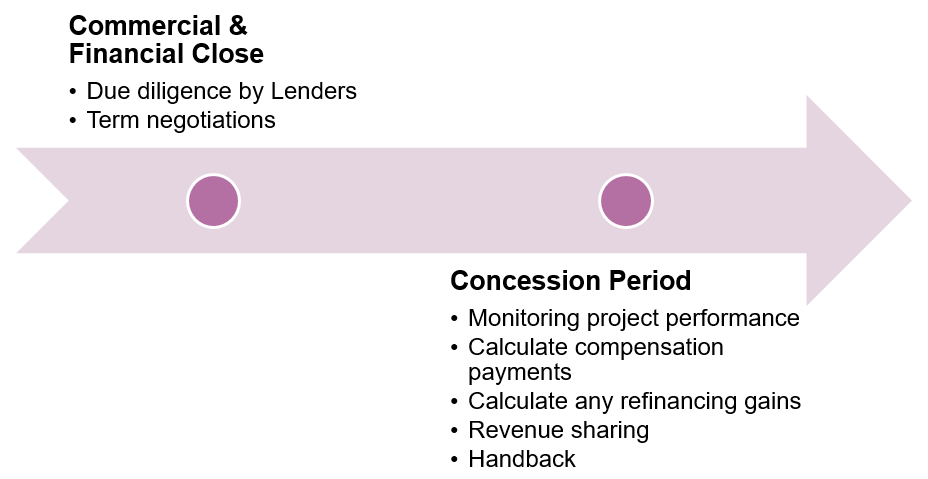
View larger version of the second Financial Modeling steps
text of graphic
Commercial & Financial Close
- Due diligence by Lenders
- Term negotiations
Concession Period
- Monitoring project performance
- Calculate compensation payments
- Calculate any refinancing gains
- Revenue sharing
- Handback
Test Your Knowledge
True or False
- Using a high discount rate with a stream of future cash flows
will result in a lower NPV
Questions?
Submit a question using the chat box
Part 6 - Using P3-VALUE for Financial Viability Assessment
FHWA's P3-VALUE 2.0
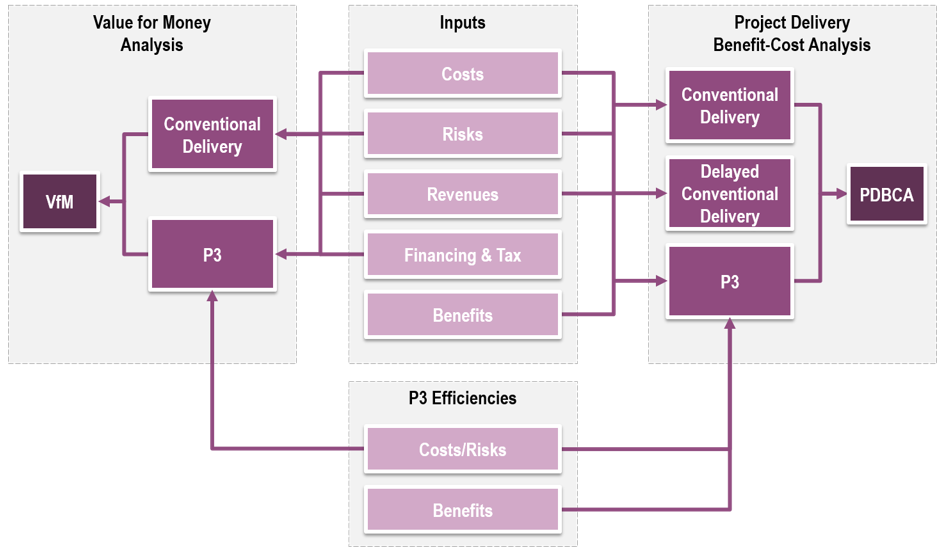
View larger version of the P3-VALUE content flow chart
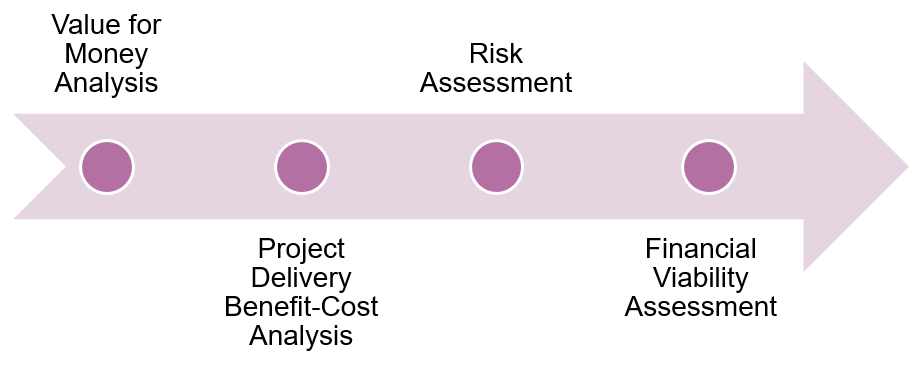
Training Modules
Training Navigator User Interface
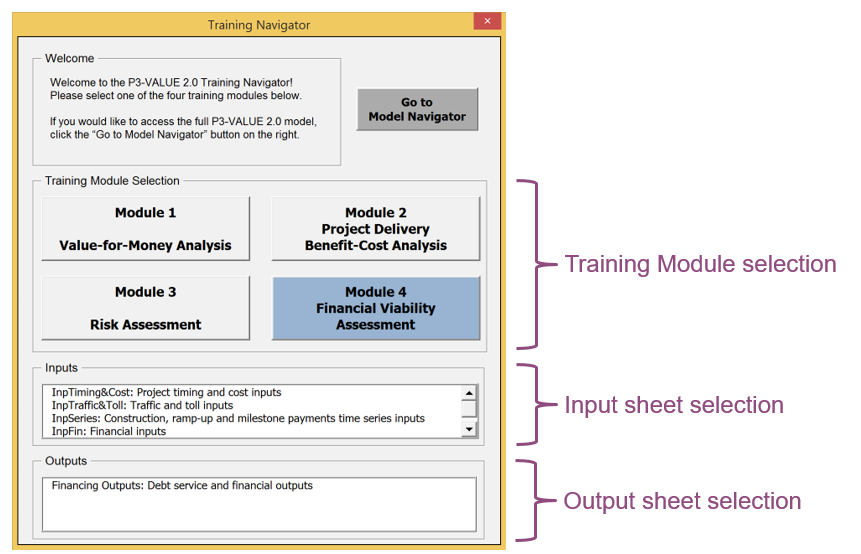
View larger version of the Training Navigator User Interface screen
Demonstration of Financial Module
Please stand by as we open the Excel file
Tool and References
Questions?
Submit a question using the chat box
Webinar Summary
Webinar Recap
Part 1 - P3 Project Financing
Part 2 - P3 Financial Structure
Part 3 - Traffic & Revenue Forecasting
Part 4 - Financial Viability Analysis
Part 5 - Financial Models
Part 6 - Using P3-VALUE for Financial Viability
Assessment
Resources
FHWA's Center for Innovative Finance Support Website: https://www.fhwa.dot.gov/ipd/
P3 Website: https://www.fhwa.dot.gov/ipd/p3/
Financial Assessment Exercise
- Exercise instructions may be downloaded from the web room
- Technical assistance options:
- Exercise review webinar - March 28 at 12:30pm EST
To access the Exercise Review webinar, please
use the following link and telephone number:
Link: https://connectdot.connectsolutions.com/p3/
Telephone: 1-888-363-4749, Passcode: 6139168#
Contact Information
P3 Program Manager
Center for Innovative Finance Support
Federal Highway Administration
(202)
366-4076
Patrick.DeCorla-Souza@dot.gov


