Submitted to FHWA Center for Innovative Finance Support
Submitted by Parsons Brinckerhoff
This document synthesizes the findings of a series of reports prepared for the Federal Highway Administration (FHWA) in conjunction with an international public-private partnership (P3) scan conducted in 2008. The P3 scan was conducted as part of the International Technology Scan Program sponsored by FHWA, the American Association of State Highway and Transportation Officials, and the National Cooperative Highway Research Program, which evaluates innovative foreign technologies and practices that could benefit the highway transportation system in the United States (U.S.). During the P3 scan, the team visited the United Kingdom (U.K.), Spain, Portugal and Australia-each of which have mature and active P3 markets-and met with public- and private-sector P3 practitioners.
Based on the recommendations that emerged from the scan, FHWA undertook a series of follow-on investigations of international P3 practices that may be beneficial to the emerging P3 sector in the U.S. This effort resulted in a series of four reports completed in 2011 describing the analytical tools and techniques used in the four scan countries as well as Canada, overviews of P3 trends and activities in the five countries, and profiles of P3 projects in them.
This document synthesizes the information presented in the original scan report and the more recent FHWA investigations to consolidate the knowledge emerging from these investigations and make it more accessible. The report contains four sections. The first summarizes notable P3 practices used in the scan countries and Canada. These include the following:
The second section provides an overview of the P3 sector in the five countries, together with information on 12 P3 projects in them. Presented in a parallel format to facilitate comparisons, the project profiles identify which of the four P3 practices mentioned above have been utilized on the different projects.
The report concludes with a summary of lessons learned from the collective experience in the scan countries that may advance the implementation of P3 projects in the U.S. Profiles of the major international P3 projects included in the scan reports are found throughout the summaries of P3 activity in the four scan countries and Canada.
FHWA defines P3s as "contractual agreements formed between a public agency and a private-sector entity that allow for greater private-sector participation in the delivery and financing of transportation projects." [1] P3s present transportation agencies with the opportunity to shift risk and financial burdens to the private sector, while gaining more efficiency in project delivery and long-term operation and maintenance of large and complex infrastructure assets.
Implementing P3 projects is a complex process that involves many areas of expertise and a number of sophisticated analysis tools. Most public agencies sponsoring P3 projects need to develop their internal capabilities and also retain the services of external experts in order to implement P3 procurements successfully. While no two P3 projects are the same, as sponsoring agencies gain experience in implementing P3 projects they may codify their experience in a programmatic approach to future P3 procurements using standard procedures, templates and analysis tools.
This chapter reviews critical decisions and analytical processes used by P3 sponsors in the four international scan countries and Canada. These five nations have active and mature P3 sectors with established best practices that may also be helpful to agencies interested in pursuing P3 procurements in the U.S.
P3s may involve different levels of private-sector participation, ranging from simple bundled design-build (DB) services to a private partner designing, building, operating, financing and maintaining (DBFOM) transportation assets. Public agencies have become more interested in greater private involvement in infrastructure development due to the high costs of infrastructure, lack of public funds, increasing budget allocation to debt service and costs of debt, and construction and long-term operational risks.
During the scan, the team focused on P3 delivery options in which the private partner has responsibility for arranging all or a majority of the financing. These are illustrated in Table 2-1.
For more in-depth information about P3 project delivery options and associated risks and characteristics of each, the P3 page of the Center for Innovative Finance Support website describes a large universe of P3s, including projects that do not have a private financing component. Understanding the difference among P3 delivery options informs how agencies procure P3s.
| Delivery Structure | Main Characteristic |
|---|---|
| Design-Build-Finance (DBF) | Private sector design, construction and short-term financing |
| Design-Build-Finance-Operate-Maintain (DBFOM) | Private sector design, construction, financing and management over a specified concession period in exchange for the right to collect tolls or receive other designated project revenues |
| Build-Operate-Transfer (BOT) | Private sector design, construction, financing and management and limited term ownership, with ownership and all other rights and responsibilities transferred back to the public sponsor at the end of a designated period of time |
| Build-Own-Operate (BOO) | Complete private-sector ownership |
One of the most critical issues in implementing P3 projects is identifying which projects would have the potential to be feasible if they were implemented on a P3 basis. Project sponsors in the four scan countries and Canada have a range of methods for identifying potential P3 projects. Some have identified specific criteria or thresholds such as the following:
Others have no fixed criteria and promote projects that they believe can garner the interest of private developers. Some may accept unsolicited bids from concessionaires, while others only allow P3 procurements to advance for projects that have been identified by public-sector sponsors.
In Australia, national guidelines dictate that P3 projects must be at least AU$50 million (US$54 million), although strong VfM analysis could make a case for using P3 procurements for lower cost projects. The three major states in Australia where P3 activity is highest - Queensland, Victoria, and New South Wales - all encourage P3s when a project is expected to have a long lifecycle, especially when operation and maintenance contracts are involved, and when the project is complex and long-term efficiencies could save the project sponsor time and money.
In the U.K., where P3 activity dates back to 1989, the government encouraged the private sector to propose "schemes for privately financed roads which offer VfM to the user and taxpayer." [2]As P3s became more widely used, the program has developed more formally with the support of specially dedicated P3 bodies, formal benefit and cost analysis programs, and bidding for public agencies to obtain "private finance credits" to use toward project procurement. Private finance credits are revenue support from the central government to aid local governments in funding PFI projects. Those credits are used to pay the private sector for their services. In the U.K. the majority of projects have been social infrastructure, like hospitals and schools, with transportation projects being limited.
In Spain and Portugal, the impetus behind P3 development was to build out the countries' infrastructure at an accelerated pace at the least fiscal cost to the government. As a result, comparatively few formal requirements are in place to identify P3s; if the private sector is open to financing them, the public agency will consider it as a P3. Over time, practices have developed to help public agencies ascertain which deals will be successful. While no formal requirements exist, almost all potential P3 projects in Spain and Portugal are long-term projects with concession periods of 15 to 30+ years.
Like Australia, P3 investment in Canada is concentrated in several provinces that are supported by national policy and guidance. P3 activity is highest in Ontario, British Columbia, Alberta and Quebec, and has been used for roads, rail, and social infrastructure projects including hospitals and schools. One of the ways in which projects are chosen in Canada is through the national P3 Canada Fund. The Fund makes capital (US$1.2 billion) available to provincial, municipal and community agencies interested in pursuing P3s. Funding is allocated via an application process, and the Fund targets infrastructure modes deemed to be most critical to the government. For example in the transportation sector, the Fund focuses on projects related to the national highway system, local roads, short-line rail, short sea shipping, airports, and tourism. The application involves a multi-phase review that includes screening, creation of a business case, and investment analysis.
After identifying potential P3 projects, public agencies must make two important decisions: choosing whether to proceed on a P3 basis and identifying which P3 structure to pursue if they do. Recognizing that P3 enabling legislation may pose some limitations on what is possible, these decisions are closely linked and are informed by a series of iterative technical analyses. The decision-making practices used by project sponsors may be systematic and rely on a set of mandatory analytical tools and business processes developed over time and applied to almost every project. In other cases, project sponsors may take a more ad-hoc approach. The two most important processes used to inform P3 procurement decisions are VfM analysis and risk valuation and allocation.
VfM analysis is a process used to compare the financial impacts of a P3 project against those for the traditional public delivery alternative. The methodology for carrying out a VfM analysis involves the following:
The aim of VfM analysis is to identify the procurement method that will deliver the maximum benefit for the public-sector agency, in part through the measurement of private-sector efficiencies, innovation, and risk transfer. VfM analysis may also be used to compare traditional public procurement options such as design-build with P3 options such as DBFOM and others.
VfM analysis comprises two important components: a public-sector comparator (PSC) calculation and the preparation of a shadow bid model (SBM), both of which are conducted during the pre-bid stage. The PSC is a risk-adjusted cost estimate for delivering a project as a traditional public project. The SBM is the estimated cost to the public sector if the same project were delivered as a P3. These estimates are used by project sponsors to determine whether to pursue a P3 option and if so, what expected risks and costs would be associated with the project. For more in-depth information about the VfM process, including the analysis of lifecycle financial costs and revenues and the assessment of qualitative and quantitative risks, see FHWA Center for Innovative Finance Support's Value for Money for Public-Private Partnerships primer.
Another integral process used in developing P3 procurements is allocating risk among private and public partners. Project sponsors give attention to risk allocation because value (both economic and monetary) for each partner lies in the transfer and/or sharing of risks. The risk allocation process begins with the identification of key risks that are likely to arise during the project's lifecycle. Examples of the most common risks found in P3 projects are described in Table 2-2. The general rule of thumb is that individual risks should be allocated to the party best able to manage them.
| Category of Risks | Examples of Risk | Description | P3 Concessions | Publicly-Financed Toll Projects | Untolled Public Highway Projects |
|---|---|---|---|---|---|
| Development Phase Risks | Political will | Lack of support from executive and legislature, and/or general public | X | X | X |
| Regulatory | Inadequate statutory framework to enable P3s | X | |||
| Site | Related to site's ground conditions such as environmental contamination, poor geological conditions, poor community relations | X | X | X | |
| Permitting | Difficulty or inability to acquire required federal, state, and/or local permits | X | X | X | |
| Procurement | Failed procurements due to general market conditions, flaws in the procurement process, unsuitable project structure expectations, etc. | X | X | ||
| Financing | Risks associated with inability to reach financial close or default of project debt during operating period (can be related to risks outside of the development phase) | X | |||
| Construction Phase Risks | Engineering and construction | Negative effects to project because of flawed project design, increase in construction costs (labor and materials) | X | X | X |
| Changes in market conditions | Changes in macroeconomic conditions that affect inflation, projected material and labor costs | X | X | X | |
| Operation Phase Risks | Traffic | Risk that actual levels of traffic are lower than projected traffic, negatively affecting project revenue and ability to repay debt and generate equity (can be affected by macroeconomic conditions) | X | X | |
| Competing facilities | Existing or new transportation facilities can affect revenue of project | X | X | ||
| Operation and maintenance | Unforeseen physical issue with facility, or increase in cost of operation and maintenance greater than projected | X | X | X | |
| Refinancing | Risks to obtaining financing at mandatory refinancing period | X | X | ||
| Political | Lack of political support during operation phase | X |
After identifying and analyzing the risks, public and private partners determine which party should bear each risk, or how they may be shared. The goal may be for the public agency to transfer as much of the risk as possible to the private sector, but that may in turn increase the return on investment that the private entity expects to receive. The public sector can transfer only as much risk as the private sector is willing to absorb. Many successful P3s aim to achieve an optimal allocation of risk-a structure where each party handles the risks they are best suited to mitigate. This means that the risks of each party should fall below their risk threshold. The public agency strives to achieve the risk allocation that has the lowest possible cost for taxpayers, while the private partner strives to maximize its returns within acceptable boundaries.
Risk allocation and management may be affected by the type of P3 delivery option chosen, the statutory environment and macroeconomic conditions the project faces during procurement, and the risk appetite of the parties to the P3. For a more in-depth analysis of these conditions, types of risks faced in P3, and how risk is priced and included in the VfM analysis, see FHWA's Center for Innovative Finance Support primer on Risk Assessment for Public-Private Partnerships.
Transparency is critical to the success of any P3 procurement. All aspects of the process should be conducted in a manner that is as open, accountable, and as consistent as possible for both the public and private partners. Because of the complexity of P3 procurements, the long length of many P3 concessions, and number of partners involved, ensuring transparency when structuring a P3 is important to successful outcomes. Transparency also makes P3 practices fair and predictable to all parties involved.
Transparency can be fostered during procurement by creating a competitive bid process and monitoring contract negotiation to minimize risks throughout the project. Public agencies can achieve transparency by ensuring that P3 solicitations are public and creating rules that do not restrict competition in the bidding process (e.g., exclusive negotiating rights, acceptance of first unsolicited bid). Agencies also create transparency by creating a consistent and open process for analyzing the value of P3 proposals and allocating risk. Through use of a detailed and systematic VfM analysis or analogous cost-benefit process, potential private partners, public officials and the public at large will understand how proposals have been scored and how they would compare to the traditional public delivery option. The distribution of risk should also be documented and shared in a transparent manner, allowing each party to negotiate the risks assigned to them. The success of a P3 project is rooted in allocating risks to the party best able to manage individual risks at the lowest cost. An effective allocation process is crucial to achieving an optimal balance of risk.
The countries included in this report have taken different steps to ensure transparency at different phases of the procurement process. In Portugal, Estradas de Portugal-which has responsibility for oversight and development of the country's highway network-creates transparency in the bid process by making all proposals received available to proposers for a period of ten calendar days after receipt in all rounds of the Request for Proposal process. Spain publishes well-defined parameters for its proposals and award criteria, which eases the process for respondents.
Australia, the U.K., and Canada create transparency in their procurement processes by having an established VfM process by which they examine P3 proposals. These countries hold comprehensive risk workshops during the VfM process in which the public sponsors and experts outline possible risks to the project that are included in the risk adjustment calculations. All three countries also use probity practitioners to monitor the procurement process and act as advisors to the project team. Making the P3 process as transparent as possible reduces the burden of a long and complex process for all parties involved.
Countries with programmatic procurement practices use a set group of analytical tools and business procedures to analyze the possibility of procuring projects on a P3 basis. This approach provides predictability by invoking most of the same steps regardless of size of the project, infrastructure mode, or where the project is to be built. Australia and the U.K. have the best examples of a systematic approach to P3 procurement. In the U.K., the process includes a VfM and risk allocation process for all projects under P3 consideration. The goal of this process is to confirm that the P3 option will give the public partner the best economic value.
Australia's approach is similar to the U.K.'s VfM analysis, in that all projects considering P3 procurement are subject to the state's PSC approach to determine if the public or P3 option provides the best value over time. Projects are compared using their net present value (NPV), a quantitative measure of the current value of the project over its lifecycle. The NPV approach takes into account all the costs and savings associated with a P3, capturing the financial benefits to the sponsoring agency over the project's lifecycle.
Canada also has a very systematic approach in procuring P3 projects, although practices vary from province to province because enabling legislation and guidelines are implemented at the sub-national level. Still, for each project the public agency conducts a VfM analysis or business case to illustrate quantitatively and qualitatively the value in pursuing the project through a P3 structure. The public agencies also host risk workshops to assess potential risks and assign costs to them and probability of occurrence. These measures are included in the overall procurement process.
Spain employs a more ad-hoc approach to P3 procurement. This approach is only ad hoc in that it is not systematic; not every project undergoes the same level of analysis because there are few national guidelines. The goal of P3 procurement in Spain is to choose projects that will attract private financing and transfer enough risk to the private sector to keep it out of the public budget. As a result, the nature of the project (mode, lifecycle length, revenue characteristics) guides the process to determine whether it will be procured as a P3 and identifying an appropriate P3 model.
Portugal lies along the spectrum between systematic and ad hoc approaches to P3 procurement. Like Spain, it began pursuing P3s as a way to build infrastructure quickly with minimum exposure on the public sector's balance sheet. Although Portugal has added cost-benefit analysis to its procurement process, it is not a requirement for project approval. The project does however need to be approved by the Finance Minister.
International experience demonstrates that there is a broad range of approaches in formulating the important decisions on whether and how P3 procurements will be advanced. Employing a programmatic approach to procurement ensures predictability in the process for all parties, and uses thorough analysis to evaluate whether the P3 will add positive economic value. The ad-hoc approach, while less predictable, provides public agencies with flexibility in choosing the type of projects that can be procured as P3s. The variability of procurement practices in these countries illustrates the range of options that project sponsors in the U.S. can use in procuring projects as P3s.
This section provides overviews of the P3 sector in each of the four scan countries and Canada, focusing on the history of P3 regulation and how possible P3 projects are vetted. All five countries have decades of experience with P3s, dating as far back as the 1970s for some. They have learned valuable lessons from their experience and have evolved the management structure of their P3s to reflect lessons learned.
In addition to information on national P3 practices, the original scan report and the other follow-on studies commissioned by FHWA have developed information on 12 P3 projects undertaken in the five countries studied. The length and detail of the project-specific information varies greatly. In order to make this information more balanced and accessible, this report synthesizes that material into a series of project profiles. These profiles follow the country overviews provided in this section.
Table 3-1 identifies the projects that have been captured in this process, noting the countries in which they are located, the P3 practices they demonstrate and the different reports in which the original information is available. The P3 project profiles are presented in a concise tabular format to facilitate easy comparisons among the 12 P3 projects captured in this review. This format is also consistent with that of the project profiles provided on the FHWA Center for Innovative Finance Support website.
The project profiles provide information for 13 key characteristics:
The profiles provide helpful information on the three key P3 practices identified in Table 3-1 and illustrate how they have been used on actual projects.
| Countries | Projects | Scan Team Reports | P3 Practices | ||||||
|---|---|---|---|---|---|---|---|---|---|
| 2009 Scan Report | PPP Case Study | Value for Money | Project Delivery | Risk Allocation | P3 Method | Value for Money | Risk Allocation | ||
| Australia | CityLink | X | X | X | |||||
| EastLink | X | X | X | X | X | ||||
| Peninsula Link | X | X | X | X | X | ||||
| Sydney Harbour Tunnel | X | X | X | ||||||
| Cross City Tunnel | X | X | |||||||
| Canada | Sea-to-Sky Highway Improvement | X | X | X | X | ||||
| Port Mann Project | X | X | X | X | |||||
| Portugal | Beiras Litoral/Alta Shadow Toll Road | X | X | ||||||
| Spain | Madrid Calle 30 | X | X | ||||||
| United Kingdom | M25 Motorway | X | X | X | X | X | X | ||
| M80 | X | X | X | ||||||
| Hounslow Highways Maintenance and Management | X | X | X | ||||||
Australia
Australia's P3 program dates back to the late 1980s when most of the projects, concentrated in the transportation sector, were structured as build-own-operate-transfer (BOOT) agreements. Since then, the P3 market has grown across all sectors (social infrastructure, water, and information technologies) and now transportation projects make up a minority of P3 projects. Most P3s are concentrated in the states of New South Wales (NSW), Victoria, and Queensland, home to over 60 percent of Australia's population. Historically, P3 guidance has been shaped at the state level due to policy leadership of NSW and Victoria. More recently formal P3 guidance has been developed at the national level in the form of dedicated public agencies and published policy guidance.
NSW was an early adopter of P3s, and the first built was the Sydney Harbour Tunnel in 1987. In the 1990s, the government of NSW relied on P3s as Sydney was facing major congestion issues and public funding was scarce. The goal of P3 development in NSW is to achieve optimal risk allocation rather than transfer all risks to the private sector. While there is a preferred risk allocation framework, final risk allocation is created on a case-by-case basis.
In Queensland, the P3 framework is centered on VfM analysis, which is used for all projects whose lifecycle costs exceed AU$100 million (US$107.2 million). The VfM process has six stages. Stages 1-3 occur during the project development period and focus on structure and developing the project to ensure that it meets the government's service needs. At the end of stage 3, the public sponsor has determined whether a P3 method is suited to the project's needs and which delivery method is most appropriate. Stages 4-6 finalize the P3 through expressions of interest, the bidding process and management of project agreements. The risk allocation and management framework is developed during the VfM process, applying the preferred allocation scheme for the most commonly found risks.
P3s in the state of Victoria are managed by Partnerships Victoria, a dedicated team within the Commercial Division of the Department of Treasury and Finance established in 2000. Any project whose lifecycle costs are in excess of AU$50 million (US$53.6 million) are required to be considered as a P3 project. Of the 21 P3 projects completed in Victoria, only three are roads: City Link and East Link are toll roads, and Peninsula Link is financed through availability payments. The remainder are social infrastructure (schools, prisons, and hospitals) projects. Of all of the state-level P3 regulations in Australia, Victoria's are the most similar to the National Public Private Partnerships Policy and Guidelines (P3 Guidelines) developed in 2008, for which Victoria had considerable influence due to Partnerships Victoria's leadership. In 2010, Partnerships Victoria released a document highlighting state-level requirements in the context of the national P3 Guidelines.
An important part of the national P3 framework is the National Public-Private Partnerships Forum, a public agency formed in 2004. It comprises members from all states, territories and the national government. The Forum's purpose is to improve P3 projects and related services by bringing policies and processes together that encourage better coordination and information sharing among local governments. The Forum's National P3 Working Group leads the development of policy and process improvement for governments, and its policy work is supported by the Council of Australian Governments. The Council is an organization made up of the federal government and six state governments, purposed with coordinating policy between various levels of governments. The Forum was the driving force behind the P3 Guidelines, which is the first comprehensive P3 framework formally published on a national level in Australia.
In April 2008, the Department of Infrastructure, Transport, Regional Development and Local Government created Infrastructure Australia, a new national government body that would oversee future infrastructure development. Infrastructure Australia advises governments, investors and infrastructure owners on information related to Australia's present and future infrastructure needs, financing mechanisms, and effects of regulation and policy on infrastructure development, pricing, and efficiency. Infrastructure Australia and the Forum work together to provide technical assistance, market research, and policy direction for the federal and local governments.
The goal behind Infrastructure Australia's work as articulated in the P3 Guidelines is to, "Deliver improved services and better VfM, primarily through optimal risk transfer, management synergies, encouraging innovation, efficient asset utilization and integrated whole-of-life asset management." [4] One of the primary vehicles to achieve this is Infrastructure Australia's VfM process. VfM analysis is completed at several stages throughout the procurement process. The first iteration, called a Procurement Options Analysis, occurs in the initial phases after the project sponsor decides to consider investment in the project. The Analysis is conducted to determine which project delivery method would create the best VfM.
A Business Case is also created to identify service needs, project objectives and scope, financial analysis and risk analysis. As part of the Business Case, a preliminary PSC is created that measures the cost of completing the project under a traditional public delivery model. The PSC includes four elements: the raw PSC (base cost), the value of government retained risk, the value of transferred risk, and a competitive neutrality adjustment that quantifies the tax advantages available to the public sector that are not available to the private sector. Once the PSC and the P3 delivery options have been compared, and it is determined which P3 approach would provide the best VfM, the procurement process can proceed under the P3 Guidelines.
The P3 Guidelines also outline how most risks should be allocated between public and private partners. The guidelines stress the importance of risk allocation through several requirements during the procurement process: identifying the risk allocation model that best optimizes the project outcomes, conducting a detailed risk assessment of the proposed delivery option, stress test of the delivery option, creating a risk management process, and ensuring that risk allocation is explicitly stated in the proposal and contract documentation.
Once a P3 approach has been vetted and chosen for a project, a Request for Proposals is issued that addresses key commercial principles in the framework summary. These principles include the length of the concession term, payment mechanisms, site issues, force majeure, change in law, modifications, termination, and hand-back requirements. These parameters provide potential private partners with an understanding of the sponsor's expectation and flexibility regarding these key issues. The P3 Guidelines also require the contract negotiation process to include the development of a probity plan overseen by a "practitioner." The practitioner is an advisor or auditor that provides oversight and monitors the contract process to ensure transparency and consistency throughout the procurement process. The probity plan covers several key aspects of contract negotiation including: the integrity of the procurement process, conformity to government policies and legislation, oversight of decision making, project records access and management oversight, security and confidentiality, conflict of interest, and intellectual property. Every P3 in Australia requires a probity plan and practitioner.
What follows are two-page project profiles of five Australian P3 projects for which information is drawn from the documents synthesized in this report. Three of these documents provided detailed information on the East Link in Melbourne and two reviewed the city's Peninsula Link project. Information on the remaining three projects was provided in only one report. These projects include the City Link in Melbourne and the Cross City Tunnel and Sydney Harbour Tunnel in Sydney.
| CityLink Melbourne, Victoria |
|
|---|---|
 |
|
| Mode | Highway |
| Type of P3 | 34-yr BOOT direct toll concession |
| Description | CityLink is a 22 km (14 mi) tollway that links the Tullamarine, WestGate, and Monash freeways to provide improved access across Melbourne by bypassing the city center. |
| Cost | The design and construction cost was $2.2 billion. |
| Public Sponsor | The public sponsor is Melbourne City Link Authority, created by the State of Victoria to specifically manage the CityLink project. The Authority ended its operation in February 2002 and the Office of the Director at Melbourne CityLink took over operations. That was succeeded by VicRoads and briefly the Department of Infrastructure. |
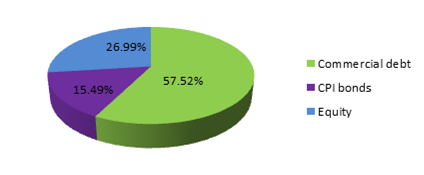
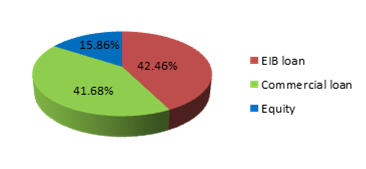
| Private Partner(s) | The private partner is Transurban Group, contracted to build, own and operate the facility. The concession period was 34 years, after which Transurban will turn the project over to the government. Transurban contracted design and construction of City Link to Transfield-Obayashi Joint Venture, a joint venture between Transfield and Obayashi Corporation, a Japanese firm. Transfield-Obayashi subsequently outsourced the design and construction of the Western Link to Baulderstone Hornibrook Engineering. Transfield-Obayashi outsourced the electronic tolling system to Translink Systems, a company jointly owned by Transfield and Transroute, a French company. Ongoing operation and maintenance is subcontracted to Translink Operations, a joint venture between Egis (a company also owned by Transfield and Transroute) and Transurban Group. |
| Financial Sources | The total cost of design and construction of the project
was $2.2 billion. Total financing sources needed are $610
million of equity and $1.3 billion in debt. Total equity:
Financial Breakdown (pie chart below):
|
| Status | Transurban still owns and operates CityLink. In 2009 the revenue was $386.4 million. |
| Year Opened to Traffic | Western Link, part of the CityLink project, opened to traffic in August 1999. The project fully opened in December 2000, and tolling commenced in January 2001. |
| P3 Tools & Approaches | P3 Method: The project was designed as a 34 year BOOT concession. The government of Victoria and Transurban Group entered into a contract in October 1994. Transurban is responsible for the design, build, finance, operation, toll collection, and maintenance of the project. Risk Allocation: The majority of project risks were transferred to Transurban. These include: construction, operation risk related to the electronic toll collection system, and traffic/demand risk. The risk associated with the electronic toll collection system is that there is no way to collect tolls if there is an outage or the system fails. The State of Victoria assumed responsibility for any actions it would take that would "adversely impact" the project such as financial responsibility if government action would cause the termination of the contract, or implement measures that adversely impacted traffic volumes. |
| Innovations | N/A |
| Project Links | Project website: https://www.linkt.com.au/melbourne |
| EastLink Melbourne, Victoria |
|
|---|---|
 |
|
| Mode | Highway |
| Type of P3 | 39-yr DBFOM direct toll concession |
| Description | EastLink is a 39 km (24 mile) toll road connecting Melbourne's northeast and southeast suburbs. The toll road includes two 3-lane, 1.6 km (1 mi) tunnels under Mullum Mullum Valley, 17 interchanges, 88 bridges and two toll-free bypass roads. |
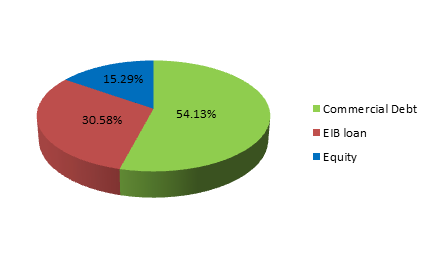
| Cost | The total project cost was AU$3.8 billion (US$ 4.07 billion). Included in that figure are construction costs which amounted to AU$2.5 billion (US$ 2.7 billion). |
| Public Sponsor | The State of Victoria established the Southern & Eastern Integrated Transport Authority to manage the State's interest in the EastLink project and oversee the P3 procurement process. In July 2010, SEITA was renamed Linking Melbourne Authority. EastLink was transferred to VicRoads in April 2010. |
| Private Partner(s) | ConnectEast was awarded the concession. ConnectEast contracted Theiss John Holland to design and construct the project. Theiss John Holland is a joint venture between Theiss and John Holland, two of Australia's largest construction and engineering firms. They awarded operation and maintenance to Transfield Services. |
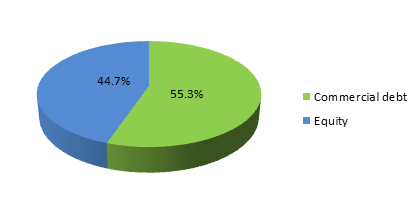
| Financial Sources | The project's financial sources consist of A$2.1 billion in bank debt, and A$1.7 billion in equity funding. Financial Breakdown (pie chart below):
|
| Status | ConnectEast was chosen as the concessionaire in October 2004. The project opened 5 months ahead of schedule. Traffic has been an issue for the project; it has fallen below project projections. In 2009, ConnectEast had a net loss for the fiscal year. Traffic has increased since. |
| Year Opened to Traffic | June 2008 |
| P3 Tools & Approaches | P3 Method: The project was structured as a design, build, finance, operate, and maintain concession for a period of 39 years. As part of the concession deed, ConnectEast agreed to a set of performance indicators and disincentives. For example, failure to meet the indicators could result in up to $17 million in deductions for the concessionaire. The indicators include road conditions, customer service and satisfaction, landscape and architectural features, maintenance and tolling accuracy. Risk Allocation: The risk allocation for the project was determined using the guidance established by Partnerships Victoria. The risk allocation was determined early in the procurement process, allowing bidders to adequately price their risk. Most of the risks were transferred to the private sector, with the exception of early planning risk. Included in the early planning was environmental risk, due to the location of the tunnels in Mullum Mullum Valley, a creek surrounded by substantial local vegetation. Due to its location, mitigating environmental risk was a crucial part of garnering public support for the project. |
| Innovations | East Link was the first P3 highway project delivered under the Partnerships Victoria framework. This framework is based on the extensive experience of Australian P3s. To minimize impact on the local community, bridges were built early in the construction phase so that they could be hauled on construction-dedicated roads instead of local roads. This lowered the amount of dust, mud, impact of road users, energy consumption, and emissions. |
| Project Links | Project website: http://www.eastlink.com.au/default.aspx |
| Peninsula Link Southeast of Melbourne, Victoria |
|
|---|---|
 |
|
| Mode | Highway |
| Type of P3 | 25-yr DBFOM availability payment concession |
| Description | Peninsula Link is a 27km (16.7 mi) highway linking southeastern suburbs of Melbourne with Mornington Peninsula. Currently traffic relies on two roads, Frankston Freeway and Moorooduc Highway, which also serve as local roads. Traffic encounters eight intersections and roundabouts along these routes. The new facility will connect the EastLink-Frankston freeway interchange with the Mornington Peninsula Freeway at Mt. Martha. |
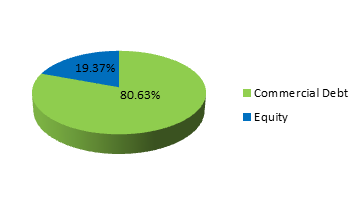
| Cost | The project value is US$780.72 million. |
| Public Sponsor | The public sector authority responsible is Linking Melbourne Authority. The state of Victoria created the Authority by special legislation in 2010, giving it responsibility to manage complex road projects. The State of Victoria, through the Ministry for Roads and Ports, is signatory to all contracts. |
| Private Partner(s) | The private partner is Southern Way consortium, a special purpose vehicle created by Royal Bank of Scotland, Abigroup, and Bilfinger Berger Services for the purpose of bidding, signing and carrying out the P3 contract. Royal Bank of Scotland structured the debt and equity package to meet the project's costs, Abigroup handled design and construction, and Bilfinger Berger Services is the long-term concessionaire responsible for operating and maintaining the facility during the life of the contract. Linking Melbourne Authority and Southern Way have jointly engaged AECOM as the independent reviewers for the project. |
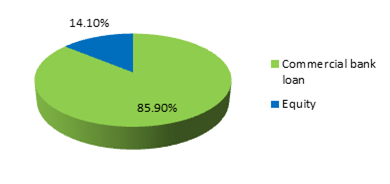
| Financial Sources | The debt and equity structuring was -led by Royal Bank
of Scotland. US$670.67 million in commercial debt was supplied by a group of lenders including:
US$110.05 million in equity was invested by Bilfinger Berger Project Investments and Access Capital Clients. Financial Breakdown (pie chart below):
|
| Status | Southern Way was chosen as the preferred bidder in January 2010, and reached financial close in February 2010. The project is currently in construction, and expected to be completed in early 2013 |
| Year Open to Traffic | Expected to open 2013. |
| P3 Tools & Approaches | P3 Method: The project is a 25-yr DBFOM contract. The P3 contract between Linking Melbourne Authority and the Southern Way consortium is the first availability payment P3 in Australia. The terms of the P3 contract include fixed quarterly payments to be made by the State of Victoria to Southern Way regardless of traffic volume, provided that the road conditions meet previously established availability or performance measures. If the road's availability or level of service maintenance falls below established measures, the government can apply penalties or abatements to the availability payments. Value for Money: LMA measured the project's VfM by developing a PSC against which to measure bids. LMA estimated the cost of the PSC to be AU$858 million (US$920 million). The value of the contract proposed by Southern Way was AU$849 million (US$910 million). The PSC cost was $10 million above the P3 contract. Risk Allocation: Following guidelines set by Infrastructure Australia, 12 out of 28 categories of risk were completely transferred to Southern Way and 5 are shared. The State of Victoria retained risk related to legislative, regulatory, or property-rights risks, such as delays to projects due to existing zoning or planning rules. The State also retained traffic and revenue risks. Both parties shared risks for force majeure events, but Southern Way bears risks associated with unexpected complications and weather delays, as well as most operating risks, other than those caused specifically by government actions. The government in its analysis assessed the value of shared and transferred risks to be AU$47 million (US$50 million). |
| Innovations | N/A |
| Project Links |
|
| Sydney Harbour Tunnel Sydney, New South Wales |
|
|---|---|
 |
|
| Mode | Tunnel/Highway |
| Type of P3 | 24-yr BOOT toll/availability payment concession |
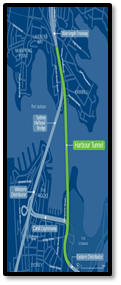
| Description | The Tunnel is 2.3 km (1.4 mi) long located in the Port of Sydney between Warringah Freeway on the north side and Cahill Expressway to the south. Its design consists of twin 2-lane tunnels in a single immersed tube. The tunnel was created to relieve congestion on the Sydney Harbour Bridge, which, before the tunnel, was the sole crossing point over the harbor. |
| Cost | Total construction costs were approximately AU$554 million. |
| Public Sponsor | New South Wales Roads and Traffic Authority |
| Private Partner(s) | The private partner is Sydney Harbour Tunnel Company, a joint venture between Australian operation services company Transfield, and Japanese construction company Kumagai Gumi. |
| Financial Sources | The project was privately financed with AU$750 million (approximately US$804 million) through indexed amortizing bonds. In order to attract bond investors, the project was structured with the equivalent of availability payments to guarantee a stream of revenue. The New South Wales Road and Traffic Authority collects tolls from users that are used in part to fund the payment made to Sydney Harbour Tunnel Company. The remainder of the payment to the company comes from other public funds. The project also received an AU$223 million (US$239 million) zero-interest loan from the government to be repaid in a one-time payment at the end the concession period. |
| Status | The project will revert to public ownership in 2022. |
| Year Opened to Traffic | 1992 |
| P3 Tools & Approaches | P3 Method: The tunnel was developed through an unsolicited P3 proposal, as a 24-year BOOT availability payment concession. The availability payment paid to SHTC is a combination of toll revenue, which is collected by RTA, and other public-sector funding. Risk Allocation: As the first P3 in the country, it was a challenge to finance the project because banks were not familiar with pricing traffic risk and the risk sharing framework used for a toll road. Thus, in order to attract private sector financing, the government assumed the traffic risk to offer a guarantee of revenue that would attract the private partners and bond investors. Other risks, like construction and permitting remained with the private partner. |
| Innovations | The project was the first P3 project in Australia. |
| Project Links | Project Website: https://www.transfield.com.au/investments |
| Cross City Tunnel Sydney, New South Wales |
|
|---|---|
 |
|
| Mode | Tunnel |
| Type of P3 | 33-yr BOOT direct toll concession |
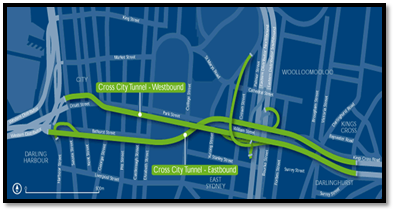
| Description | Cross City Tunnel is a 2.1 km (1.3 mi) project composed of two tunnels running east-west, each with a different route depending on the direction of traffic. The tunnel is tolled in both directions using an all electronic tolling system. The tunnel allows access to the harbor, city and airport through the Eastern Distributor, a highway connecting the city to the airport. |
| Cost | Construction cost was US$800 million. |
| Public Sponsor | New South Wales Roads and Traffic Authority |
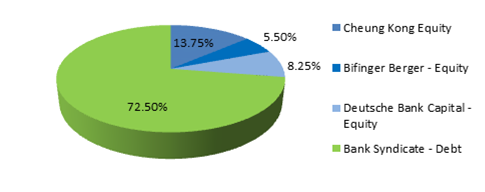
| Private Partner(s) | Cross City Motorways Proprietary Ltd (CCM), a consortium of Bilfinger Berger AG, Cheung Kong Infrastructure Holdings Limited, and Deutsche Bank AG. |
| Financial Sources | The project reached financial close in December 2002.
CCM contributed $220 million in equity, and a syndicate
of Australian and international banks led by Westpac and
Deutsche Bank invested $500 million. Financial Breakdown (pie chart below):
 |
| Status | In 2006, the year after the Tunnel opened to traffic,
the project encountered financial difficulties in part
because traffic was much lower than projected. In order
to boost traffic, CCM cut the toll rate in half and asked
the government to enforce a surface road closing provision
in the contract. The provision would close some of the
surface roads in order to divert traffic to the tunnel.
The government did not enforce the road closing measure,
prompting CCM to sue. In 2007, CCM went into bankruptcy, and the Tunnel was sold in an auction to ABN Ambro and Australia road operator Leighton Contractors Proprietary Ltd. The Tunnel was sold for AU$700 million (US$750 million). |
| Year Opened to Traffic | August 2005 |
| P3 Tools & Approaches | Risk Allocation: The government of NSW allocated most of the project risks to CCM, including financing, construction, operation, maintenance, traffic, and residual site risks. The government retained the risk of project planning. |
| Innovations | N/A |
| Project Links | Project website: https://www.linkt.com.au/sydney/using-toll-roads/about-sydney-toll-roads/cross-city-tunnel |
United Kingdom
The P3 program in the U.K. is commonly known as the Private Finance Initiative (PFI). In 1989, private finance was introduced to U.K. infrastructure investments through the "Ryrie Rules." The Rules said that (1) private finance could only be introduced to capital projects when it is cost effective to the government, and (2) privately financed projects for public-sector programs had to be considered in public expenditure budgeting (e.g.., these projects had to have financial "cover" in the public budget). In 1992 the Ryrie Rules were replaced by PFI, the first systematic P3 program in the U.K. created to develop partnerships between public and private stakeholders at the central government and local authority levels. The guiding principles of PFI were that the private sector must take on risk without guarantee by the taxpayer against loss, and that VfM must be demonstrated in the project to justify the project for the public sector.
As the program became more widely used, VfM analysis and risk allocation practices became more streamlined, and more public authorities (from a range of sectors and at different authority levels) became part of cultivating the P3 market in the U.K. As of March 2012, 717 PFI projects across a range of sectors have been implemented, 62 of them under the jurisdiction of the Department of Transport. [5] P3s are used in a range of markets including toll roads, highway maintenance, and social infrastructure including education, housing and prison projects.
Due to the diversity of markets that use P3s, the regulatory framework for P3s is very complex. Infrastructure U.K. is the central source for policy and technical assistance related to P3 projects. Infrastructure U.K. is a public agency with Her Majesty's (HM) Treasury that works with the private sector to invest in infrastructure, oversees and manages the national P3 program, and in some cases lends to projects that cannot raise sufficient commercial debt (in response to contracted credit markets in 2008 and 2009). The Treasury P3 policy team, which is now incorporated into Infrastructure U.K., developed the VfM analysis framework that is mandatory for all major capital projects. The U.K. has separate public P3 bureaus to support P3 activities in Scotland, Wales, and Northern Ireland. Additionally Scotland has its own laws that apply to P3 projects in Scotland.
An important goal of P3 technical guidance at the national level has been to increase the standardization of VfM analysis to cover projects in a variety of sectors and managed by a variety of government agencies. The VfM process became more formalized with the publication of Value for Money Assessment Guidance by HM Treasury in 2004. It required the assessment of VfM at three different stages in the project lifecycle to assess both quantitative and qualitative benefits. The Assessment Guide was updated in 2006 to reflect policy from a newly published PFI guide. HM Treasury created a mandatory quantitative evaluation tool for VfM assessment that aims to standardize the comparison of risk-adjusted costs across different project delivery methods.
The three stages of VfM analysis occur at the program, project and procurement stages. At the program stage, VfM analysis checks that P3s are only considered for use in capital programs (infrastructure, education, housing, etc.) where the project delivery method is likely to produce value. At the project level, VfM analysis takes place within the Outline Business Case, which is an initial analysis of the project's costs and benefits prior to procurement. Developing VfM analysis at this point helps clarify the rationale and goals for the project. The last stage at which VfM analysis occurs is at the procurement stage. Here a more a detailed analysis is completed as part of the Full Business Case, which is used to seek funding approval for the project. VfM analysis at the procurement stage reflects the risk positions likely to be taken by each party in the contract, and pricing related to those risks before a final agreement. Value for money, where the benefits of the P3 delivery option are greater than the public delivery option, must be proven before a P3 project may proceed under the PFI framework.
The goal of risk allocation in the U.K. is to achieve the optimal allocation between the public sponsor and concessionaire. HM Treasury has established guidance on standard risk positions to promote a common understanding of the main risks in P3 projects. This framework gives consistency to the approach of risk allocation and pricing and thus reduces time and cost of contract negotiation.
The following are two-page tabular profiles of three U.K. projects: the M80 in Glasgow, Scotland, the M25 Widening project in London, and the Hounslow Highways Maintenance and Management contract in the borough of Hounslow in London.
| M80 Glasgow, Scotland |
|
|---|---|
 |
|
| Mode | Highway |
| Type of P3 | 32.5-yr DBFOM availability payment concession |
| Description | The M80 project is an upgrade of a 10 km (6.2 mi) of existing A80 Trunk Road to motorway standard. The upgraded section runs from Haggs to Mollinsburn. The project also includes the construction of a new 8 km (5 mi) motorway linking A80 at Mollinsburn to M80 at Stepps. |
| Cost | Contract cost is £320 million (US$514 million) |
| Public Sponsor | Transport Scotland, the transport ministry of the Scottish government. |
| Private Partner(s) | The private partner is Highways Management Scotland, a consortium that originally consisted of Bilfinger Berger (83% shareholder), John Graham and Northstone Limited (the remaining shareholders). In 2010, HSBC acquired 41.6% of Bilfinger Berger's stake in the project. |
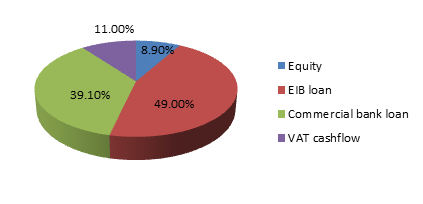
| Financial Sources | The project was financed in part with an European Investment
Bank (EIB) loan of approximately £139 million (US$219
million), as well as with commercial bank debt of approximately £133
million (US$215 million) from a syndicate including Barclays,
SMBC, National Australia Bank, and KfW. The equity portion
of £50 million (US$81.82 million) was provided by
the private partner. Financial Breakdown (pie chart below):
 |
| Status | The project is completed and open to traffic. |
| Year Opened to Traffic | August 2011 |
| P3 Tools & Approaches | P3 Method: The project involves a 32.5-year DBFOM concession. The P3 model was chosen after a VfM analysis was conducted. The P3 model allowed the government to lock in costs for the road over the long-term including maintenance spending. Risk Allocation: The majority of design, construction, financing and operational risks were transferred to the private sector. Demand risk is retained by the public sponsor, Transport Scotland, through availability payments. As part of the contract, the Scottish government retains ownership of the road and it has to have at least ten years of operational life after the end of the contract. |
| Innovations | N/A |
| Project Links | Transport Scotland project website: https://www.transport.gov.scot/projects/m80-stepps-to-haggs/ |
| M25 Widening London, England |
|
|---|---|
 |
|
| Mode | Highway |
| Type of P3 | 30-yr DBFO availability payments concession |
| Description | The project consists of widening approximately 102 km (63.4 mi) of the existing M25 from three-lane sections to four-lane sections. The project implements user fees for most sections of the motorway and includes the operation and maintenance of approximately 400km (248.6 mi) of the M25 and connecting roads and junctions. |
| Cost | The project cost is £1.3 billion (US$ 2.4 billion). |
| Public Sponsor | The public sponsor is the U.K. Highways Agency, an executive agency of U.K. Department for Transport |
| Private Partner(s) | The private partner is Connect Plus, a consortium of Balfour Beatty (40% shareholder), Skanska ID (40% shareholder), Atkins (10% shareholder), and Egis Projects (10 % shareholder). |
| Financial Sources | EIB direct loan: £185 million (US$285 million),
EIB guaranteed loan: £215 million (US$331 million),
Commercial loan (group of 16 banks): £708.68 million
(US$1.09 billion). The equity share was £200 million
(US$308 million). Financial Breakdown (pie chart below):
 |
| Status | The project reached financial close in May 2009. |
| Year Opened to Traffic | The project was opened during the phases of the widening and all phases were completed in June 2012. |
| P3 Tools & Approaches | P3 Method: The U.K. Highways Agency originally intended the M25 project to consist of four separate projects. Because of the overlapping timelines, synergies of services and common bidders for each of the projects, they decided to pursue the projects combined as a P3. Value for Money The Highways Agency conducted a VfM analysis that concluded that a private finance option would cost 7-15 percent less than a traditional public procurement approach. The Agency then chose to pursue the option of a single DBFOM contract. Risk Allocation: The project transfers a majority of design, construction, finance, and operational risks to the private sector. Availability risk is also transferred to the private sector through the P3 payment mechanism. Demand risk is retained by the Highways Agency, although the private partner controls the operation and maintenance of the toll collection. |
| Innovations | N/A |
| Project Links | U.K. Highways M25 Website: http://www.highways.gov.uk/our-road-network/our-network/key-roads/m25/ |
| Hounslow Highways Maintenance and
Management Hounslow, London, England |
|
|---|---|
 |
|
| Mode | Highway |
| Type of P3 | 25-yr O&M availability payments concession |
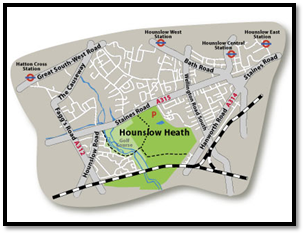
| Description | The Hounslow Highways Maintenance and Management P3 is a package to maintain and provide "enhanced level of service" for all of the assets owned by the London Borough of Hounslow Authority. The contract covers a range of services such as resurfacing streets and pavements, replacing and improving lighting, upgrading street furniture, keeping streets clean, and taking care of bridges. The first 5 years of the contract will be focused on investment in the roads that are in the worst condition, followed by 20 years of maintenance. The project spans across 432 km (268 mi) of roads, 762 km (473 mi) of sidewalks, street lights, cleaning, signage, street, structures and drains. |
| Cost | Capital (construction) costs are estimated to be £71.8 million. The cost of the bid is estimated to be £453 million. |
| Public Sponsor | The P3 procurement and implementation has been managed by a project board, consisting of an authorized representative from the Hounslow Authority and U.K. Department of Transportation. |
| Private Partner(s) | The private concessionaire chosen in March 2012 is Vinci-Ringway. |
| Financial Sources | The project requested £267 million (US$428.59 million) in PFI credits to fund the project from the Department of Transport. The project secured approval for those credits in November 2009. |
| Status | The bidding process for the project began in January 2010, and a contract was entered into with Vinci-Ringway on August 30, 2012. Vinci-Ringway is expected to begin the contract on January 1, 2013. |
| Year Opened to Traffic | N/A |
| P3 Tools & Approaches | P3 Method: The project is a 25 year highways operations and maintenance package for the London borough of Hounslow financed through availability payments. The intention is for the concessionaire to take full responsibility for the majority of Hounslow Authority's assets and related services. The major services included in the P3 are:
Value for Money: VfM was calculated under the HM Treasury P3 template calculation. If completed through a P3, the capital cost of the project was estimated to be £71.8 million (US$115.25 million), while the capital cost through traditional public delivery was expected to be only £65.3 million (US$104.82 million). The P3 option includes an additional approximately 10% of cost to reflect the profits of the concessionaire as well as the value of transferred construction and delay risk. While the capital costs of the P3 options are higher, it was assumed that long-term operations cost would be lower due to the labor efficiencies of the concessionaire. The total project cost under the P3 procurement method was calculated at £453 million (US$727.16 million), compared to the public delivery option of £500 million (US$802.6 million). The Authority also measured the qualitative VfM of the procurement, focused on the categories of viability, desirability, and achievability as stated in the HM Treasury P3 template. Through a series of assessment questions, the Authority found that the P3 delivery option was the preferred procurement option. |
| Innovations | The project is London's first P3 for highway maintenance (for existing assets as opposed to a greenfield project). It has been selected as one of three "pathfinder" projects by the U.K. Department of Transport in the market of highway maintenance. |
| Project Links | Project website: http://www.hounslowhighways.org/ |
Spain
Spain began implementing P3 concessions in the 1970s. In the 1970s and 80s numerous concessions were awarded to build out the country's infrastructure, mostly as BOT contracts. In the 1990s, there was renewed interest in P3s due to lack of public funding and a push to invest in infrastructure off the national balance sheet. This push came in part from Spain preparing to join the European Union and thus needing to reduce its national debt and avoid excess spending.
The Toll Highway Act of 1972 was the regulatory foundation for the development of P3s until 2003, when the Highway Act was replaced by an amendment to the Contracts of Public Administrations Law (also known as the Concession Law). This law broadened regulations on concessions and created a national framework through which public agencies could take policy guidance. Spain's P3 market is one of the most active in Europe and has always been focused on transportation projects, although the market has grown to sectors including waste management, building construction, and healthcare. The country's booming P3 market has cultivated private firms and banks that are global experts in highway concessions and P3 financing and structuring.
P3s are an important part of Spain's national Strategic Plan for Transport Infrastructure, created in 2004. The Plan outlines the government's intent to reduce budgetary spending on infrastructure and instead increase the use of P3s for new construction and existing roadway rehabilitation and maintenance. The revenue sources for these projects are shadow tolls, payments made by the public agency to the private concessionaire based (sometimes only in part) on the number of users of the facility. Another type of compensation used is soft tolls, payments that combine the use of direct tolls and public subsidies. Currently the entire national road system is contracted out for rehabilitation and maintenance, spread over 150 different contracts. The contracts consist of a two-year rehabilitation task followed by a 17-year term of maintenance. The contracts are paid for using financing from shadow tolls. Built into these contracts are incentives for good performance and quality of the facility. Large penalties are assessed if the roadway falls below acceptable levels and there is an option for the government to terminate the contract based on the poor road quality and lack of availability.
The P3 investment framework is less rigid in Spain than in Australia or the U.K. The 2003 Concession Law requires the government to publish the feasibility study for proposed projects, which includes technical elements, environmental analyses, economic and social impact, and a preliminary financing plan. There is no formal VfM analysis required, although the public authority is required to prove that the project is in the public's interest. According to the Concession Law, the goal of the public partner is to create economic and financial equilibrium throughout the life of project. This vision is meant to balance the profits of the concessionaire with the social and economic benefits offered by the project to the public. To help with this, maximum toll rates are set in contract negotiations. There is, however, a culture of contract renegotiation where both public and private partners will try to revise contract terms after the project is operational. This has led to situations in which bidders will be aggressive in the traffic and revenue projections in order to win the bid, and then renegotiate later when projections are not met.
The 2003 Concession Law defines a framework for risk sharing that states that the private partner should bear most of the market risks and the public authority should bear the risks that cannot be adequately transferred to other stakeholders with the goal of minimizing the public's debt burden. Minimizing their public debt burden is important to public agencies in Spain because they need to meet minimum fiscal standards as part of their EU membership.
According to EU accounting rules, Spanish public agencies can keep projects off their balance sheet depending on the allocation of risk in the P3. Projects are known as "operating leases" if considerable construction and operating risks lie with the private partner, even if the public agency will make fixed payments to the private concessionaire over the life of the project. Only those payments, which are usually significantly less than the upfront capital costs of building the projects, are included on the public agency's balance sheet. In the case of a new build project that transfers all those risks to the private sector and is financed with direct tolls retained by the private concessionaire, the public agency does not have to put the project on its balance sheet at all. If the public sector does not transfer an adequate amount of construction and operating risks, the project is considered a "finance lease," and the capital costs and financing payments made from the public agency to the private partner are considered the same as a loan. In this case, the public sponsor must put the entire cost of the project on its balance sheet. The criteria that determine which projects are considered "operating leases" rather than "finance leases" are that the private partner must bear the construction risk and either the availability risk or the demand risk of the facility.
While a framework is in place, risk transfer is usually inadequate because the precedent exists for concessionaires to renegotiate contracts once projects are operational. Having the knowledge that contracts are flexible provides little incentive to cement risk arrangements and contract terms early on in the project. Thus, if revenues fall below projections or project circumstances change, the concessionaire is aware that renegotiating the terms of the concession are on the table.
The documents synthesized in this report include information on one Spanish project: Madrid Calle 30. A two-page tabular profile follows.
| Madrid Calle 30 (M-30) Madrid |
|
|---|---|
 |
|
| Mode | Highway |
| Type of P3 | 35-yr DBFOM availability payment concession. |
| Description | M-30 is the innermost orbital highway in Madrid and the busiest road in Spain. Due to its congestion, it is responsible for a large amount of air pollution, as well as the pollution of the Manzanares River. In order to accommodate future growth and manage congestion, as well as repair deteriorating parts of the road, plans were made to reroute parts of traffic underground using a system of tunnels. These plans included replacing former above ground portions of M-30 with parks, pathways, and mixed-use development. This plan is called The Calle 30 Project and consists of two phases. The first is the construction of the southern part of the ring road, and the second is construction of the northern part. The Project includes 99 km of new roads, including a 12 km tunnel segment in south Madrid that is the world's longest urban tunnel. |
| Cost | Total project cost is €4.5 billion (US$5.4 billion), including both phases of development. The first phase is approximately €2.85 billion and second phase is approximately €1.15 billion. |
| Public Sponsor | The public sponsor is Madrid City Council, who owns 80% of the project company Madrid Calle 30. The Madrid Calle 30 project company is a joint venture between the municipality and the private partner, Empresa Mantenimiento y Explotacion M 30. .Known as societies d'économie mixte in France, mixed public-private companies are not unusual in Europe. |
| Private Partner(s) | The private partner is Empresa Mantenimiento y Explotacion M-30 comprised of Ferrovial, ACS Dragados and API Conservation. They own 20% of the project company. Ferrovial had operated the road prior to the project procurement. |
| Financial Sources | Commercial debt financing was separated into two tranches:
Financial Breakdown (pie chart below):
 |
| Status | The Project reached financial close in December 2005. The first phase ended construction in May 2007. |
| Year Opened to Traffic | The road has remained open to traffic during construction. |
| P3 Tools & Approaches | P3 Method: The project is a 35-year DBFOM concession financed with availability payments. The project was developed as a P3 with the intention of transferring it off of Madrid's balance sheet, but due to the majority ownership of the asset and insufficient transfer of risk, it was put on the public balance sheet. A key risk that is retained by the government was a termination clause that obligated the project sponsor to pay the concessionaire if the project was cancelled. The private partners provided the equity and subordinated financing and in turn received dividends for capital investment, management fees and loan interest. The private partners are responsible for construction and maintenance risk, as well as operations and maintenance services. The second tranche of debt is tied to availability payments paid by municipality, which can be impacted by performance indicators that the city has tied to the availability payments. This provides some incentive for high quality performance from the private partner, while insulating the private partner to changes in traffic volumes through the availability payment. |
| Innovations | N/A |
| Project Links | Project Website (in Spanish): https://www.mc30.es/ |
Portugal
P3s in Portugal began with the adoption of the National Highway Program in 1996 which identified 16 new construction projects to build out the country's highway network. The goal of the toll road program was to improve the country's infrastructure while minimizing the impact of the investment on the national budget. Seven of the projects were developed as shadow toll roads called Sem Custos para os Utentes roads (SCUT, English translation: No Cost to the User), while the rest were developed as traditional toll roads. This program was formalized in 1997 through legislation and additional regulation added in 2003.
The creation of the P3 program coincided with Portugal's entrance in the European Union's single currency zone. Like Spain, Portugal turned to P3s during this time to help it deliver infrastructure quickly while keeping the projects off balance sheet. This goal influenced public agencies' motivation for entering into P3s, as they selected projects that were important to the public agency and not necessarily well vetted P3 projects.
The 2003 law formalizing the P3 program created guidance for the procurement process, risk allocation, and renegotiation of contracts over the life of the project. For each project, a bid committee is assembled composed of representatives from the Ministry of Finance and the sector in which the P3 will operate. The bid committee evaluates the merits of a proposal including the risks and benefits. After bids are evaluated by the relevant Ministry, it decides, along with the Ministry of Finance, which bidder will be awarded the P3 contract. While some costs-benefit analysis is supposed to occur to evaluate risk, there is no formal VfM process, and the main impetus behind P3s has been to transfer financing risk from the national budget to the private sector.
Traditionally, the concessionaire bears the design, construction, and operation risk while the government retains the environmental risk, which presents problems in Portugal because projects are bid on prior to receiving environmental licenses. This had led to cost overruns and delays borne by the government. Depending on the revenue pricing structure of the project, the government will retain the traffic risk if the project is financed through shadow tolls.
Initial rationale for developing the SCUT projects as toll free facilities in the 1990s was that they were greenfield roads traversing largely rural and less developed areas and it was feared that the associated traffic risk would make the projects unattractive to potential P3 partners if they were to be financed using toll revenue. [6] However, the delays resulting from the lack of environmental permits led to massive cost overruns on the initial SCUT projects and in 2004, the government announced that it would convert shadow tolls roads to traditional toll roads. The existing SCUT projects were converted to tolled operation between 2009 and 2011.
Changes to P3 contracts are authorized under legislation the 2003, but need approval of both the Ministry of the infrastructure and the Ministry of Finance to be considered. A 2006 amendment to the P3 legislation required a negotiations committee to evaluate the contract renegotiation. There have been several renegotiations for P3 projects in part due to the conversion of shadow toll roads to toll roads. Renegotiations have also occurred because projects have not been profitable and private partners hope to shift more of the traffic risk to the government.
The reports referenced in this section include information on the Beiras Litoral e Alta Shadow Toll Road Project. A two-page tabular profile of this project is provided below.
| Beiras Litoral e Alta Shadow Toll
Road Aveiro to Vilar Formoso, Portugal |
|
|---|---|
 |
|
| Mode | Highway |
| Type of P3 | 30-yr DBFO shadow toll concession |
| Description | The project includes the widening and upgrading of a 167 km the two-lane IP5 highway between Aveiro in western Portugal and Vilar Formoso at the Spanish Border in eastern Portugal. |
| Cost | The total cost of the project is €1.2 billion, with construction costs totaling €693.4 million. |
| Public Sponsor | Estradas de Portugal S.A. |
| Private Partner(s) | The concessionaire on the project is Lusoscut Beiras Litoral e Alta, made up of 13 shareholders led by Mota & Companhia. Lusoscut became Ascendi, Inc. and managed the current facility as a real toll system. |
| Financial Sources | The sources of financing for the project are:
Financial Breakdown (pie chart below):
|
| Status | The concession was signed in April 2001. It was announced in 2004 that the shadow toll system would be changed to a real toll system, and new toll system reached financial close in January 2011. |
| Year Opened to Traffic | Road opened to traffic in 2006. |
| P3 Tools & Approaches | P3 Method: Shadow tolls reduce the uncertainty for the concessionaire attached to traffic forecasts under a user pay model. It can present some adverse conditions for the public sector as it transfers the risk and costs to the public sector instead of resting with the private operator and users of the roadway. In Portugal, the government agreed to freeze the Road Plan (as it was in 2000) for 30 years, restricting the government's ability to increase capacity beyond the stipulated plan. This provides the concessionaires for those original plans predictability about the medium to long-term traffic patterns in the region and a monopoly over the roads already negotiated into the plan. The shadow tolling for Beiras Litoral is based on three categories of traffic volumes:
|
| Innovations | N/A |
| Project Links | Ascendi Asset Management website: https://www.ascendi.pt/en/as-nossas-vias/ |
Canada
Like Australia, P3s in Canada have relied on leadership at the sub-national level. Canada's P3 market is relatively uniform; most transportation P3 agreements are structured as design-build-finance-operation and/or maintenance (DBFO/M) contracts. The public sponsor pays for the contract through availability payments, the standards for which vary from project to project. The provinces of Alberta, Quebec, Ontario, and British Columbia (BC) have led the development of P3s due to their large population centers. BC was the first province to enact enabling legislation for P3s in 2002 and also created a technical assistance agency called Partnerships British Columbia. Similar public agencies were created in Quebec and Ontario (PPP Quebec and Infrastructure Ontario, respectively) in 2005.
At the national level, infrastructure policy has supported the use of P3s. In 2002, the Canadian Strategic Infrastructure Fund was created to help fund large-scale infrastructure that promotes the economic growth and quality of life in Canada. The Act creating the Fund explicitly supports the use of P3s to deliver those projects. In 2009, in tandem with establishing the country's federal P3 agency (PPP Canada), the government created the P3 Canada Fund, an account dedicated solely to funding the public-sector portion of P3s that are deemed a national priority. PPP Canada is tasked with increasing the visibility of P3s as a delivery option and offering technical assistance to public agencies interested in pursuing P3s. PPP Canada also manages the P3 Canada Fund and assesses candidate projects that apply for funding.
BC's P3 legislation was established with the passage of the Company Act in 2002, allowing provincial agencies to enter into contracts with private partners for services. The Act created Partnerships British Columbia, a public agency that has the authority to structure, deliver, and manage P3 projects. Partnerships BC has a published methodology for how public agencies should identify, assess, and quantify risks and long-term costs associated with P3s. Like Australia, the framework in BC is structured around creating a business case in which to compare the public and P3 delivery options. The first iteration of the business case compares the qualitative characteristics of the procurement options to assess their ability to meet the stated goals of the project. Then a more rigorous quantitative analysis of the costs of capital, ownership, operation, maintenance and financing for the public and P3 options is conducted. A risk workshop is conducted to assess potential risks and assign costs and probability of occurrence. Assigning values to risks helps the public agency assess each delivery option with their likely transferred and retained risks.
Infrastructure Ontario (IO) helps public agencies procure traditional and P3 projects across a range of sectors. In Ontario it is required that P3 projects offer VfM, and IO hires consultants to help public agencies work through the VfM analysis process. As in other countries, VfM analysis in Canada consists of comparing a PSC with an alternative shadow bid of the proposed P3 delivery option. IO hosts a risk workshop that helps public agencies identify, allocate, and quantify the cost and probability of the risk occurring. This exercise supports the comparison of the public sector and P3 bids in the VfM analysis by helping the public agency understand and assign value to the risks that are transferred in the project. IO has developed different VfM analysis templates depending on the P3 delivery option, and makes every VfM analysis available to the public.
Among the five studies synthesized in this report, only FHWA's 2011 Value for Money: State of the Practice includes information on projects in Canada. They include the Sea-to-Sky Highway Improvement and Port Mann/Highway 1, which are both located in British Columbia. Profiles of these projects are provided below.
| Sea-to-Sky Highway Improvement Vancouver to Whistler, British Columbia |
|
|---|---|
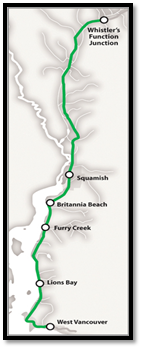 |
|
| Mode | Highway |
| Type of P3 | 25-year DBFOM availability payment concession. |
| Description | The Sea-to-Sky Highway) forms part of Highway 99 and
runs from West Vancouver to Whistler, BC. The project involved
the upgrade of 95km (59 mi) of the highway, including 48
bridges and interchanges, and 219 mechanically stabilized
earth retaining walls. The project objective was to straighten
out the road to ensure more consistent driving speed and
eliminate blind bends. The project built new passing lanes between Horseshoe Bay and Whistler, created new reflective markings along the entire route for better visibility, adding median barriers where possible, and stronger bridges to withstand adverse weather and debris washed down by storm water. The road is monitored by electronic weather equipment so that maintenance can be done quickly in winter weather. |
| Cost | Estimated project cost is CA$798 million (US$819 million) |
| Public Sponsor | British Columbia Ministry of Transport |
| Private Partner(s) | The concessionaire is the S2S Transportation Group. The Group is a consortium of Macquarie North America Limited (financial advisor), Peter Kiewit Sons Company (design-builder), Hatch Mott MacDonald (engineers and design lead), JJM Construction, ND Lea, McElhanney Engineering Services Ltd, Miller Paving and Capilano Highway Services. |
| Financial Sources | The S2S Group provided C$400 million (US$415.6 million) in equity capital. Government of British Columbia invested C$200 million (US$207.6 million) in another section of the project. |
| Status | The project reached substantial completion in summer of 2009. |
| Year Opened to Traffic | 2009 |
| P3 Tools & Approaches | P3 Method: The project was developed as a 25-yr DBFOM contract paid to concessionaire through performance based availability payments. The S2S Group was expected to construct the highway improvements and maintain the system, while the Ministry of Transport continued to own the road, rights-of-way, bridges and assets connected to the S2S Highway. Value for Money: The Ministry of Transport expected VfM to be achieved through the bundling of services in the P3 method, resulting in more flexibility and accountability for high quality construction and level of service. Through the quantitative VfM analysis, the P3 delivery option was valued at CA$789.8 million (US$819.81 million) compared to the PSC valued at CA$744 million (US$772.27 million). Although the PSC was the cheaper option, it did not include the value of additional highway improvements the concessionaire could provide through qualitative benefits that could not be measured. These benefits were realized through additional highway improvements and safety elements such as increased passing lanes, more median barriers along the highway, reflective pavement markings, and a traffic management regime with 50% fewer delays and closures. Risk Allocation: As part of the VfM analysis, risks were allocated between the public and private partners. The Ministry of Transport retained risks largely in their control, such as risks associated with property acquisition needed for highway construction, changes in laws and regulations that can be seen as discriminatory to the S2S Group or its industry, and environmental concerns such as contaminated soils. The S2S Group took on much of the design, construction, operation and maintenance risks. Both parties shared risks concerning changes in non-discriminatory laws, unexpected site conditions, and risks in moving utilities needed for highway and related structures. |
| Innovations | The Ministry of Transport went ahead with the P3 delivery option despite the lower cost of the public sector comparator. This project illustrates that although VfM is helpful guidance to make sure that the public sponsor is gaining value and efficiencies from P3 delivery, the quantitative VfM analysis is not exhaustive of all of the measurable and qualitative benefits that a concessionaire can bring to a project. |
| Project Links | Project website: http://www.partnershipsbc.ca/projects/operational-complete/sea-sky-highway/ |
| Port Mann/ Highway 1 Vancouver to Langley, British Columbia |
|
|---|---|
 |
|
| Mode | Bridge, Highway |
| Type of P3 | DB publicly procured toll road |
| Description | The project spans 37 km (22.9 mi) from the McGill Street Interchange in Vancouver to 216th street in Langley. The project includes the construction of a new 10-lane Port Mann Bridge over the Fraser River, widening of Highway 1, upgrading interchanges, and improving access and safety on Highway 1. |
| Cost | The total construction and design cost of the project is CA$2.46 billion (US$2.95 billion). |
| Public Sponsor | The public authority in charge of managing the project is the Transportation Investment (TI) Corporation. The Corporation was originally created by the Province of British Columbia to oversee and manage the original P3 structure for a concession period of 40 years. The TI Corporation now manages the implementation of the DB contract for the project. |
| Private Partner(s) | The design-builder is Kiewit/Flatiron Group. It consists of Peter Kiewit Sons Co, Flatiron, H5M, and T.Y. Lin International. The design-builder was part of the original DBFOM concession and remained on after a final agreement could not be reached and the project was changed to a DB structure. TC Flow has been selected as the toll operator, responsible for day-to-day service including toll collection, operations, customer service and billing. TC Flow is a consortium of Egis Projects and Sanef. |
| Financial Sources | Source of revenue is tolls. |
| Status | The construction phase began in August 2009 and is expected to reach substantial completion in December 2013 and final completion in December 2014. Eight lanes of the new bridge are expected to open to traffic in December 2012. |
| Year Opened to Traffic | Anticipated in 2013. |
| P3 Tools & Approaches | P3 Method: The project was originally planned to be delivered using a DBFOM structure, but due to economic conditions and weak financial markets at the time of procurement the delivery structure was changed to design-build. Through the original DBFOM structure, the concessionaire would finance the project without public financing and in return receive all of the toll revenue from the project. A revenue sharing clause was included to protect the public sponsor against the concessionaire receiving super profits. Value for Money When the original DBFOM agreement broke down in 2009, the province of British Columbia decided to continue on with the project in a design-build structure because of the necessity of the project. The province utilized the preferred design-builder that was chosen during the DBFOM process, allowing construction on the project to begin one month after the original P3 agreement ended. |
| Innovations | The project was able to continue being built with the preferred concessionaire after the structure changed from DBFOM to design-build. |
| Project Links | Project Website: http://www.ticorp.ca/what-we-do/infrastructure-port-mann-bridge-highway-1-improvement-project/port-mann-bridge/ |
This document has traced the different paths taken by five countries with active P3 markets. One common goal driving interest in P3 procurements is the desire to accelerate the implementation of needed transportation investments. Spain and Portugal are also interested in utilizing P3 projects for expensive projects as this allows them to advance these improvements while limiting exposure to public debt, which is a key concern in Euro-zone countries. In the U.K., Canada and Australia, a key driver for opting to use P3 delivery is achieving greater value compared to traditional public procurements. These countries complete complex VfM analyses to determine if such synergies can be achieved through risk transfer, better management, design and construction innovation, and the benefits of asset management practices over the lifecycle of their P3 assets.
Spain and to a certain extent Portugal have developed P3 projects on a flexible ad-hoc basis, completing feasibility studies that may not necessarily involve VfM analysis to demonstrate that projects are in the public's best interest. They also use contract documents to regulate toll rates and assign risks but are also willing to revisit contract terms once a project is operating if changes arise. Canada, Australia and the U.K. have taken a more programmatic approach, adopting P3 policies at the national or provincial/state level that establishes procedural requirements, ensures consistency and transparency and also mandates the use of rigorous analytical tools such as VfM.
The experience in these five nations demonstrates that there is no single method to approach P3 development. They have had both successful and unsuccessful outcomes. However, as P3s have become more common across these markets, public agencies have learned from past experience and have developed an approach that suits their needs. This often includes developing standardized analytical processes and document templates and undertaking a systematic process to identify projects that would be suitable for development on a P3 basis.
Based on the different practices followed in the four scan countries and Canada, there are a number of broad lessons that U.S. transportation professionals should consider when contemplating the use of P3 project delivery.
In most of the markets chosen by the P3 scan team, P3s are pursued not just as an alternative financing option but as a more efficient way of building and servicing (through operation and maintenance) existing and new infrastructure. This is particularly true in Australia, the U.K., and Canada, where projects are procured on a P3 basis only when VfM demonstrates that the private sector option is more advantageous. Part of the value in a P3 is in the long-term operations and maintenance savings over the lifecycle of the project. Concessionaires may be able to more efficiently manage the infrastructure asset over its lifetime, thinking strategically about design, construction and long-term operations to maximize the longevity of the asset.
Procurement practices evolve over time as projects are completed and best practices are learned. They involve a combination of technical analyses such as VfM, risk allocation, and feasibility assessment, as well as business procedures dictating contractual terms and conditions and standardized templates and processes for awarding P3 procurements and maintaining transparency.
In some of the scan countries, VfM analysis is critical for choosing whether to pursue a P3 as a project delivery method. In Canada, Australia, and the U.K., VfM must be proven before a public agency can procure an infrastructure project as a P3. As the P3 markets in these countries have evolved, the VfM analysis process has become more complex, often involving several iterations of qualitative and quantitative analysis, incorporating all components of the proposed P3 delivery method and cost of transferring or retaining risks for each party. VfM analysis is not used in Spain and Portugal in part because their primary goal is to expedite infrastructure build out at the lowest fiscal cost to the government. Thus they are less concerned with measuring whether the P3 option has the best economic value, because value for them lies in the project being built with private funds (at least in the beginning stages) and on a faster timeline than the government could commit.
While VfM analysis is very detailed and process-driven in the scan countries, it does not always dictate the P3 delivery option based on a simple lower delivery cost. In the case of the Sea-to-Sky Highway agreement in Canada, that P3 delivery option was chosen despite its higher cost because of more improvements that made it a better overall delivery option. While a thorough VfM analysis process helps public agencies navigate the major benefits and risks of their projects, frameworks should also be flexible to the conditions surrounding each project.
One important caveat that transportation officials should understand is the important distinction between VfM analysis and the financial feasibility of a given project. While VfM analysis can enable project sponsors to ascertain whether the private sector can implement and operate a potential P3 project over a prescribed period of time at a lower cost than the public sector, VfM analysis does not determine whether project revenues will be adequate for a private partner to meet its debt service requirements and make a reasonable profit.
Experience in the scan countries and Canada demonstrates that the appropriate identification, assessment, and allocation of risks among the sponsor and private partners are fundamental to a successful outcome. Part of the evolution of the P3 market in some of the scan countries has been the shift from maximizing risk transfer to the private sector to the optimal allocation of risks among all parties. Countries have been able to adopt best practices as their experience with P3s grows, and create and develop risk allocation frameworks accordingly. Some of these vary from loose risk frameworks, as in Spain and Portugal, to comprehensive risk workshops in Canada and Australia.
One major issue that has raised problems in all the scan countries is the allocation of revenue risk. Revenue risk is greatest for tolled projects where private partners leverage expected toll proceeds. This can be tempered if project sponsors are willing to guarantee certain revenue thresholds or use an availability payment or a shadow toll approach. Some public sponsors agree to assume nearly all revenue risk by entering into availability payment arrangements where they make payments to the private partner based on its performance in maintaining and operating a given facilities. Public agencies have to make decisions on whether to increase their share of revenue risk to make P3s more attractive to the private sector, or whether to mitigate the risk transferred to the private sector by creating provisions that will support the concessionaire if projections fall short in the future. Public agencies can only transfer as much risk as the private sector is willing to accept.
In Australia, the P3 program is controversial in part because projects have suffered from lower than projected traffic and toll revenues; the Cross City and Lane Cove tunnels were lost by the original concessionaires and had to be sold in auction due to the low revenue. This trend may precipitate the need for the government to assume some risk by offering availability payments rather than shadow toll or direct toll structures in order for projects to be competitive. Some countries including Australia have agreed to contract provisions that help the private partner in the event of lower traffic volumes by enforcing traffic restrictions on surface roads, but this approach is often unpopular.
In Spain and Portugal, a way in which risks for the private partner are mitigated by the public agency is to allow for contract renegotiations if financial or economic conditions change during the operational phase of the project. In Spain this has led to extension of concession terms, toll increases, government loans, and purchases of the facility to be resold to other private operators. This has the advantage of making the process more flexible for both public and private partners, allowing changes to be negotiated into the contract in the medium and long term of the concession period. There is some argument that while this practice promotes flexibility, it may lead some private partners to routinely use renegotiation as a tool to re-shift unforeseen costs back to the public sector, thereby diminishing the advantage of P3s to the government.
An additional lesson learned from P3 experience in the scan countries and Canada is the importance of developing the internal capacity within agencies sponsoring P3 projects. Implementing P3 projects is complex and requires expertise in legal and financial issues that extend beyond the purview of most transportation agencies. Capacity building is needed to help public agencies develop a better understanding of the P3 market and navigate the P3 analyses and procurement procedures. Each of the five countries analyzed in this document has national and/or provincial/state public P3 agencies that help decision makers understand the market, facilitate visibility and dialogue among stakeholders, and assist projects sponsors in navigating technical processes.
In Australia and Canada, the creation of policy and P3 institutions at the state and provincial levels led the way for federal policy and support for the development of P3s. Federal policy in those countries has standardized P3 approaches across the states or provinces, while allowing that sub-national level to maintain requirements unique to them.
Similarly, national level institutions exist in the U.K. to aid Scotland, Wales and Northern Ireland in pursuing projects of importance to their countries. Federal institutions and policy in the U.K. have evolved to incorporate lessons learned and standardize analysis to incorporate the growth of P3s across a variety of sectors.
As the P3 market grows in the U.S., states interested in pursuing P3 projects will need to develop the necessary expertise. States such as Virginia and Texas have established dedicated P3 offices and standardized procedures to facilitate P3 activity.
Recognizing the importance of capacity building and need for new P3 sponsors to develop expertise with VfM and financial feasibility analysis, the FHWA Center for Innovative Finance Support is developing a comprehensive P3 Toolkit to aid transportation professionals in procuring P3 projects. This initiative includes tools and guidance in four major areas: legislation and policy, planning and evaluation, procurement, and monitoring and oversight. Tools are currently available to educate public agencies in P3 evaluation, including how to conduct VfM analysis, create a PSC and shadow bid model, and perform risk and financial assessment. The goal is to help the public sector in the U.S. understand how to structure successful P3 projects that will provide economic value over their lifecycle.
Part of the impetus to establish the P3 Toolkit came from the findings of the 2008 international scan and the ensuing studies that are summarized in this report. Additional information about the P3 Toolkit is available at https://www.fhwa.dot.gov/ipd/p3/toolkit/.
Availability Payment: a means of compensating private concessionaire for operating and maintaining a road. The payments are made by the public sponsor based on project milestones are facility performance standards (e.g. level of service).
Build-Operate-Own-Transfer (BOOT): project delivery method in which the private sector partner builds, owns, and operates the project during the concession period. At the end of the concession period, the project transfers from private to public ownership.
Consumer Price Index (CPI): used to assess price changes associated with the cost of living (proxy of inflation). A CPI bond is one in which the payment of income is linked to changes in the CPI, ensuring the bondholder receives the rate of return in real terms.
Design-Build (DB): project delivery method that combines two usually separate services into a single contract. The public sponsor completes some preliminary engineering (10-15 percent) and project definition to create a foundation upon which bidders can build. The design-builder assumes responsibility for design work and construction for a fixed fee. By bundling design and construction services, the design-builder can implement innovative features into the project that can reduce cost and schedule.
Design-Build-Finance (DBF): project delivery method that combines design-build services with full or partial financing during the construction period. Through DBF the public sponsor can defer financing during the construction period.
Design-Build-Finance-Operate-Maintain (DBFOM): project delivery method in which private partner assumes responsibility for design, construction, financing, operation and maintenance of the project. While DBFOM arrangements vary greatly across projects, one commonality is that financing is achieved by leveraging the projected revenue stream of the project. Common revenue streams include toll revenue from users, shadow tolls, soft tolls, or availability payments.
Net Present Value (NPV): difference between the present value of the cash inflows and the present value of the cash outflows. NPV is used to calculate the profitability of a project.
Public Sector Comparator (PSC): risk-adjusted cost estimate for delivering a project as a traditional public project. The PSC is used in VfM analysis to determine whether the public or private delivery provides the best economic value to the project sponsor.
Shadow Bid Model (SBM): estimated cost to the public sector if the project were delivered through a P3 option. The SBM is compared to PSC in VfM analysis to see which delivery method provides the most economic value to the public sponsor.
Shadow Toll: a means of compensating the private concessionaire for operating and maintaining a facility. The shadow toll is based on the number of the users of the road, and the payment is made directly from public sponsors to the private concessionaire.
Value for Money (VfM): process used to compare the financial impacts of a P3 project against those for the traditional public delivery alternative. The goal of VfM is to determine the delivery method that provides the best economic value to the public sponsor. A key component of VfM analysis is the creation of a PSC and SBM that measure the cost of services, value of innovation, and price of risk transfer for the public and private delivery methods, respectively.
[1] Accessed from: https://www.fhwa.dot.gov/ipd/p3/defined/
[2] "Risk Allocation and Management," p. 67.
[3] Cost estimates were taken from original reports and in some cases added to with information from Infrastructure Journal transaction database. . Figures are meant to be illustrative of scale and amount of financing needed for the project. The type of cost (e.g. construction costs, project value, contract value) is stated where information was available.
[4] Infrastructure Australia, National PPP Guidelines Overview: Canberra, 2008, p. 1 https://www.infrastructure.gov.au/infrastructure/ngpd/files/Overview-Dec-2008-FA.pdf
[5] U.K. PFI Project Summary as of March 2012, Infrastructure U.K., accessed from: http://webarchive.nationalarchives.gov.uk/20130102211911/http:/www.hm-treasury.gov.uk/d/summary_document_pfi_data_march_2012.pdf
[6] Perez, Benjamin, Achieving Public-Private Partnership in the Transport Sector, iUniverse Press, New York, 2004, p. 39 and 226.