Instructor
Patrick DeCorla-Souza
P3 Program Manager
Center for Innovative Finance Support
P3-VALUE 2.0 Webinars
- P3: Public Private Partnership
- P3-VALUE 2.0: Analytical tool to help practitioners understand processes used to quantitatively evaluate P3 options
 This is the first of five webinars on P3-VALUE
- P3 Evaluation Overview (today)
- Value for Money Analysis
- Project Delivery Benefit-Cost Analysis
- Risk Valuation
- Financial Viability Assessment
Webinar Outline
Lesson 1 Types of Project Delivery Evaluation
Lesson 2 Timing of Project Delivery Evaluation
Lesson 3 Value for Money Analysis
Lesson 4 Project Delivery Benefit-Cost Analysis
Lesson 5 Risk Valuation
Lesson 6 Financial Viability Evaluation
Lesson 7 FHWA's P3 Toolkit
Recap Summary of Webinar
Webinar Objectives
After this webinar you should be able to:
- Describe various types of P3 evaluation
- Identify their key limitations
- Explain the types of tools available in FHWA's P3 Toolkit
Lesson 1: Types of Project Delivery Evaluation
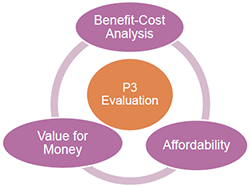
Delivery Method Evaluation

- Project Evaluation:
- Is the project worthwhile for society?
- Project Delivery Evaluation:
- Is the project financially viable under conventional or P3 delivery?
- Would P3 procurement add value relative to conventional procurement?
- Which P3 options would add most value?
Types of Project Delivery Evaluation
View full-size flow chart
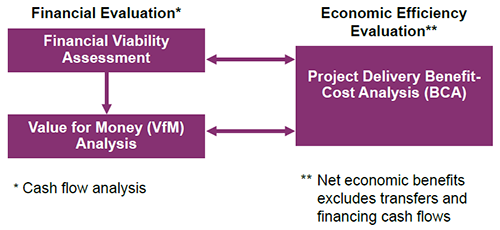
 Financial vs. Economic Evaluation
- Financial Evaluation
- Considers financial elements only, i.e., "cash flows"
- Perspective is that of the procuring agency
- Economic Efficiency Evaluation
- Considers full range of costs and benefits to society
- Perspective is that of society as a whole
 Financial Evaluation Questions
- Is the project affordable to the public agency?
- Will P3 procurement enhance the financial position of the public sponsor?
Economic Efficiency Questions
 Does the project yield benefits to society that exceed the costs to society?
- What is the best project design alternative?
- When should a project be undertaken?
- Will P3 delivery increase net benefits to society compared with conventional procurement?
Test Your Knowledge
True or False
- Financial evaluation considers the full range of costs and benefits to society.
Questions?
Submit a question using the chat box

Lesson 2: Timing of Project Delivery Evaluation
Timing of Project Delivery Evaluation
| 1. Planning |
- High level preliminary screening
|
| 2. Project Development |
- Quantitative and qualitative assessment
- Market sounding
|
| 3. Procurement |
- Revisit VfM analysis as cost estimates are refined and bids are received
|
 Screening
- Project characteristics
- Legal framework
- Institutional capacity
- Market interest
FHWA's P3-SCREEN Screening Tool
May be used in conjunction with the development of an Initial Financial Plan for major projects
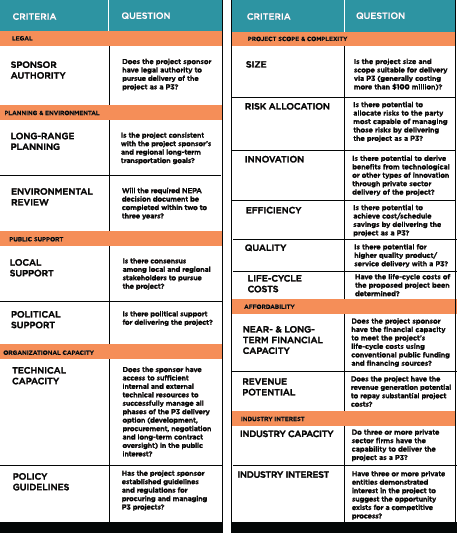
 Detailed Evaluation
- Technical Studies
- Traffic and revenue
- Cost estimates
- Risk assessment
- VfM and BCA
- Affordability
- Market outreach
- Market analysis
- Market outreach
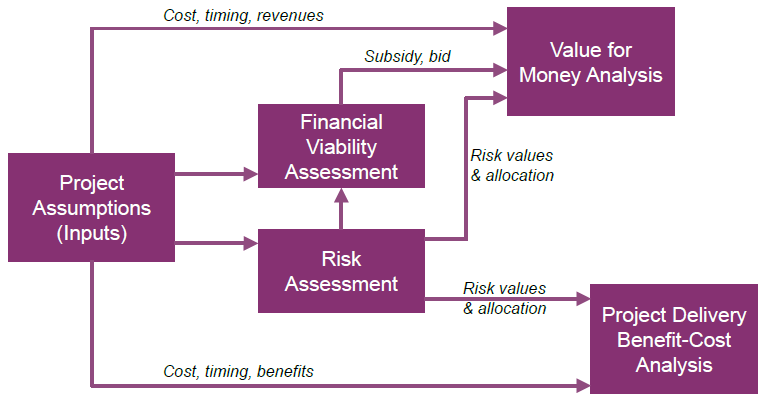
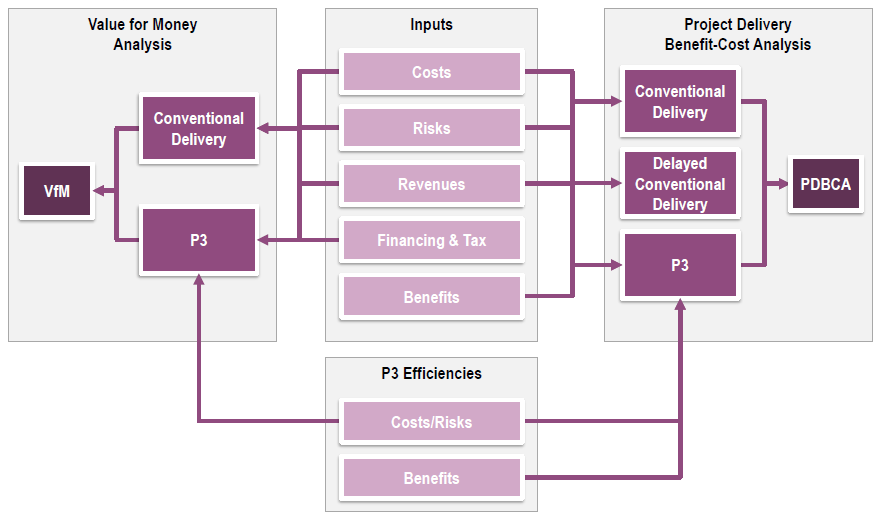
P3-VALUE 2.0 Tool Structure
View full size flow chart
Test Your Knowledge
True or False
- Value for Money analysis may only be conducted in a project's procurement phase.
Questions?
Submit a question using the chat box
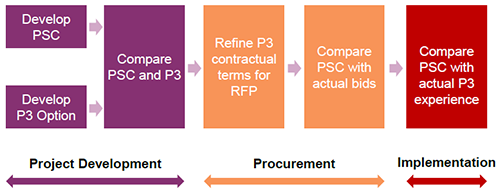
Lesson 3: Value for Money Analysis
 Definitions
Value for Money (VfM) - The optimum combination of life cycle costs and quality of a good or service to meet the user's requirements
VfM Analysis - Quantitative analysis, expressed as dollar or % difference
Public Sector Comparator (or PSC) - Conventional procurement's baseline cost against which P3 option will be compared
P3 Shadow Bid (or P3) - Net cost of P3 option to Agency, including estimated payments to private partner as well as other costs incurred by public sponsor
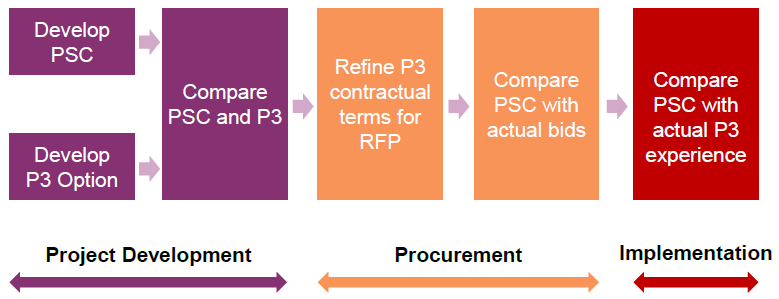
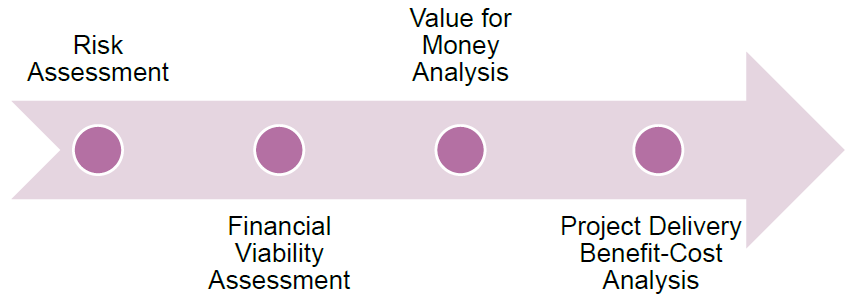
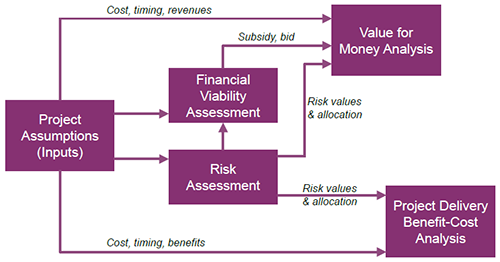
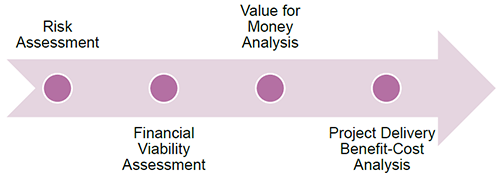
Timing of VfM Analysis
View full size timing flow chart
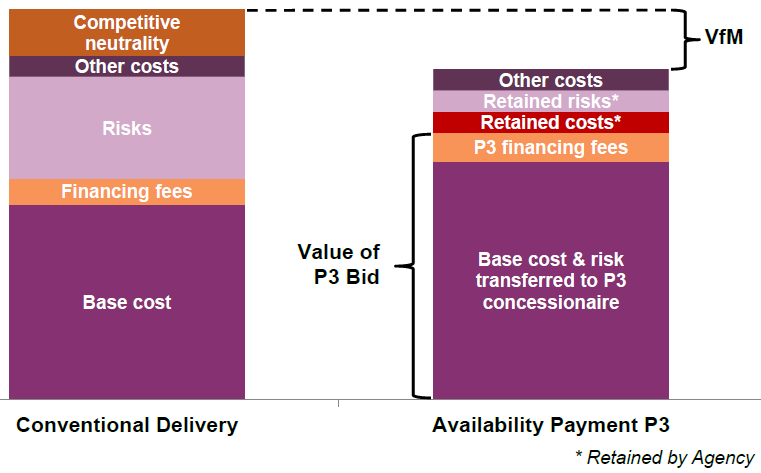
VfM: PSC vs. Availability Payment P3
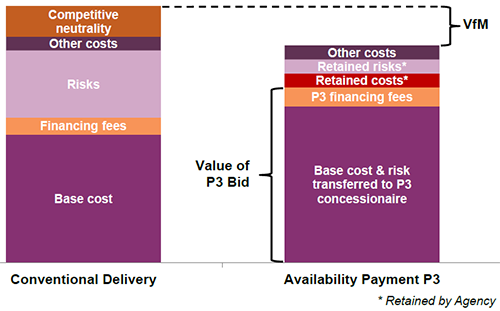
View full size PSC vs Availability Payment chart
VfM Analysis Challenges
- Estimating cost differences between P3 and conventional delivery
- Identifying and pricing risk
- Sensitivity of results to discount rates

 VfM Analysis Limitations
- Non-financial costs and benefits?
- PSC possible in the same time frame as P3?
- Project scope changes proposed by a P3 bid?
Test Your Knowledge
True or False
- VfM analysis assumes that, under conventional project delivery, the project can be delivered and operated in the same time frame as the P3 option.
Questions?
Submit a question using the chat box
Lesson 4: Project Delivery Benefit-Cost Analysis
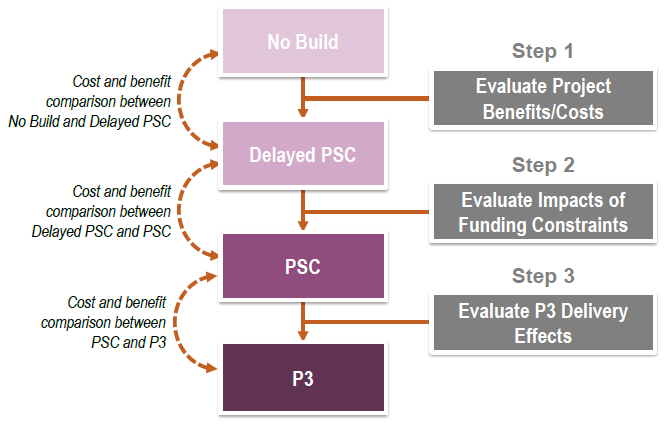
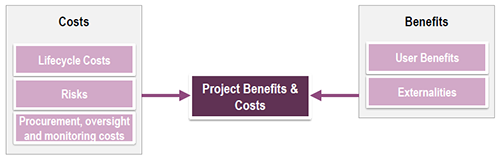
Benefit-Cost Evaluation Process
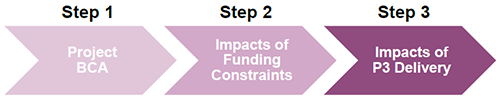
- Step 1: Project BCA
- Step 2: Impacts of Funding Constraints
- Step 3: Impacts of P3 Delivery
- Timing impacts
- Cost impacts
- Quality impacts
- Scope optimization
Project Delivery BCA Framework
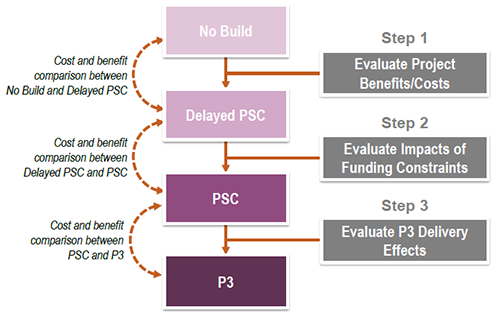
View larger version of Framework chart
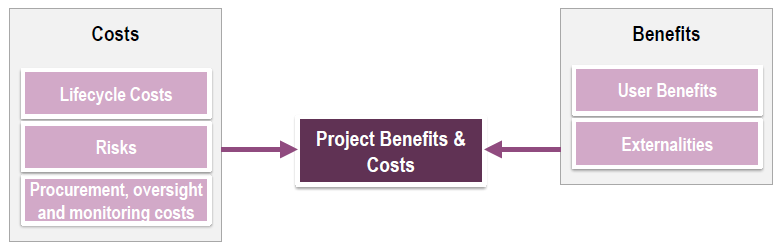
Step 1: Project Benefits/Costs
Delayed Conventional Delivery compared to No Build
View larger Project Benefits & Costs chart
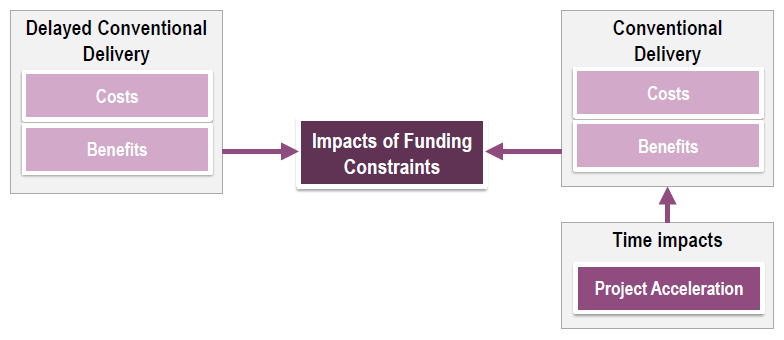
Step 2: Impacts of Funding Constraints
Delayed Conventional Delivery (Delayed PSC) compared to Conventional Delivery (PSC)
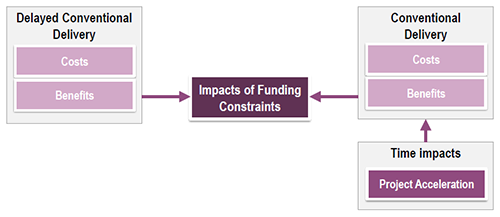
View larger version of Impacts of Funding Constraints chart
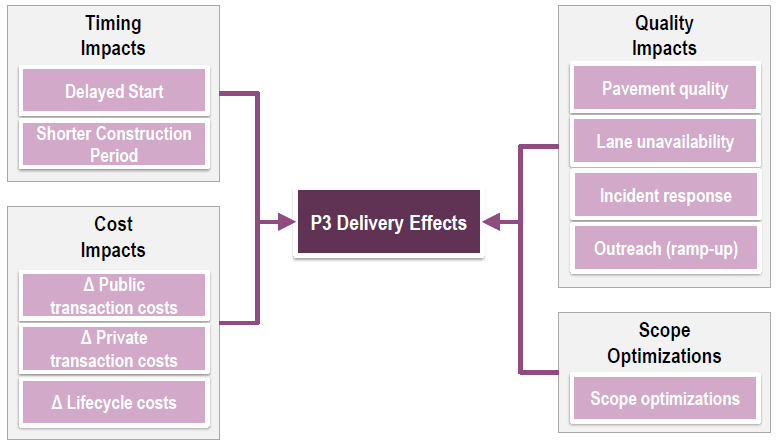
Step 3: P3 Delivery Effects
Conventional Delivery (PSC) compared to P3
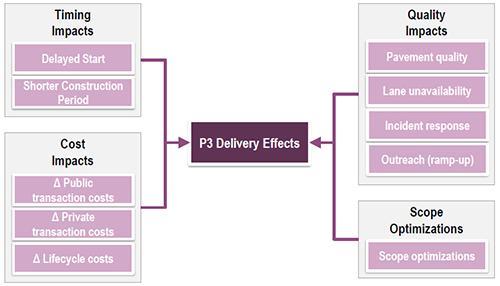
View larger version of P3 Delivery Effects
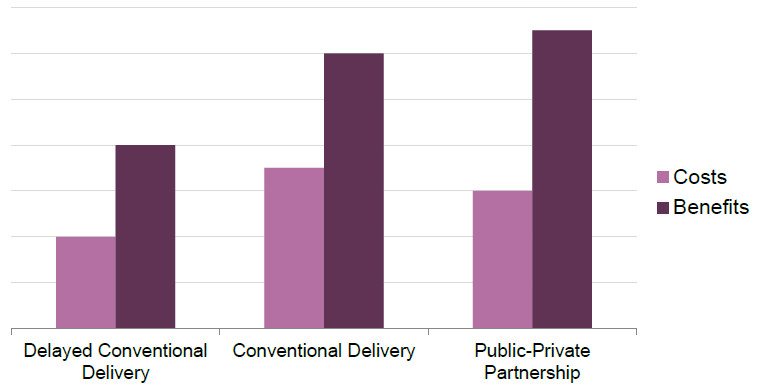
Project Delivery BCA Output
In P3-VALUE, all three options are compared to No Build
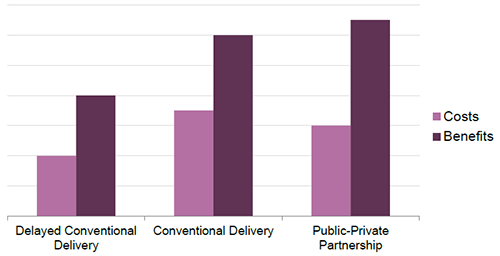
View larger version of the BCA Output chart
Perspective Considerations
| Perspective |
Financial Analysis (VfM Analysis) |
Economic Analysis (PDBCA) |
| Agency |
Costs to Agency's balance sheet |
Agency costs plus societal benefits |
| State |
Costs to State |
State costs plus societal benefits |
| National |
Societal costs |
Societal costs and benefits (true BCA) |
Test Your Knowledge
True or False
- Benefits from project acceleration should always be attributed to P3 delivery.
Questions?
Submit a question using the chat box
Lesson 5: Risk Valuation
P3-VALUE 2.0 Risk Approach
- Costs: Costs are adjusted for risk and uncertainty
- Revenues:
- PSC: If tolled, toll revenues are adjusted for uncertainty based on P3 toll risk premium included in P3 financing
- P3: No uncertainty adjustment is made to toll revenues, but costs and revenues are discounted based on P3's weighted average cost of capital (WACC)
- Benefits: P50 (i.e., most likely) traffic forecasts are used without any uncertainty adjustment. A sensitivity factor is included to facilitate sensitivity testing.
P3-VALUE 2.0 Risk Cost Categories
- Base Variability
Example: Uncertainty in volume of asphalt
- Pure Risks
Example: Accident at construction site, causing cost overrun and/or delays
- Lifecycle Performance Risks
Example: Conflicts between DB and O&M contractors, supervening events exceeding liability caps, inflation
Risk Adjustments in P3-VALUE 2.0
For VfM analysis, no lifecycle performance risk adjustments are made to P3 costs, since lifecycle performance risk is already included in the P3 financing premium
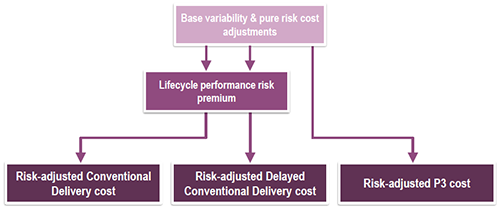
View larger version of the risk-adjustment chart
Test Your Knowledge
True or False
- For VfM analysis, an estimate for lifecycle performance risk should be included in the Conventional Delivery and Delayed Conventional Delivery cost estimates.
Questions?
Submit a question using the chat box
Lesson 6: Financial Viability Assessment
Financial Calculations
Sources of Funds
- Equity & debt
- Subsidies
- Toll revenues
|
Uses of Funds
- Capital expenses
- Operating expenses
- Debt service
- Tax & dividends
|
 |
|
P3-VALUE 2.0 Financial Model
|
|
- Capacity of project revenues to repay debt
- Capacity to attract equity
- Required public subsidy payments
|
Key Metrics for Public Agency
 Concession fee - for "revenue positive" projects
- Public subsidy - for "revenue negative" projects
- Toll rates
- Concession term
Key Metrics for Financiers
- Debt service coverage ratio (DSCR)
- Gearing or leverage (debt/equity ratio)
- Equity IRR = Equity Internal Rate of Return
- WACC = Weighted Average Cost of Capital
- Project IRR = Project Internal Rate of Return

Debt Service Coverage Ratio (DSCR)
- Debt service coverage ratio (DSCR) =
Cash Flow Available for Debt Service (CFADS)
Annual debt service
Higher minimum debt service coverage ratio requirement reduces debt capacity
Leverage of Gearing
- Leverage or Gearing (i.e., debt-to-equity ratio) =
Debt percentage
Equity percentage
Higher gearing can increase debt capacity (if minimum required DSCR can be met)
Test Your Knowledge
True or False
- A higher DSCR will allow a project to obtain a higher amount of debt.
Questions?
Submit a question using the chat box
Lesson 7: FHWA's P3 Toolkit
FHWA P3 Toolkit
| Fact Sheets |
Primers |
Guidebooks |
Analytical Tools |
- FHWA P3 Toolkit
- Risk Valuation & Allocation
- Value for Money Analysis
- Financial Structuring
- Analytical Studies
- Conducting Procurements
- Monitoring & Oversight
|
- Establishing a P3 Program
- Risk Assessment
- Value for Money Assessment
- Financial Structuring & Assessment
|
- Risk Assessment
- Value for Money Assessment
- Benefit-Cost Analysis for P3 Delivery
- P3 Project Financing
|
P3-SCREEN
- P3 viability evaluation prior to project development
P3-VALUE
- Risk Assessment
- Value for Money
- Benefit-Cost Analysis
- Financial Viability Assessment
|
 Webinar recordings on P3 evaluation are also available on the web.
What is P3-VALUE 2.0?
- An analytical tool
- Educates users
- A component of FHWA's P3 Toolkit
FHWA's P3-VALUE 2.0
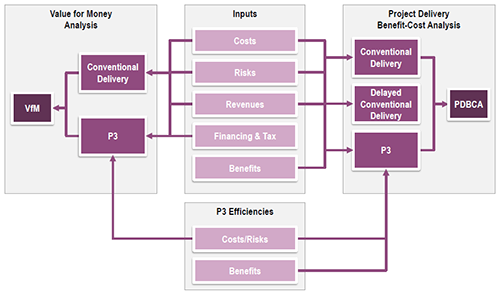
View larger version of P3-VALUE 2.0 tool chart
Training Modules
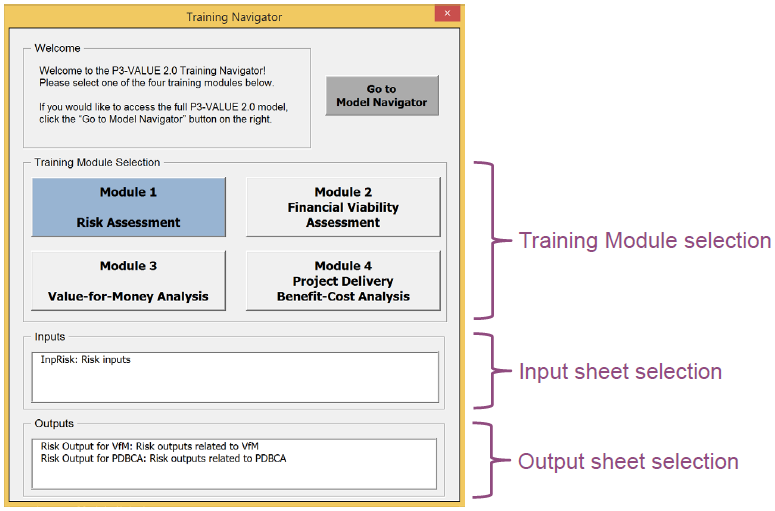
Training Navigator User Interface
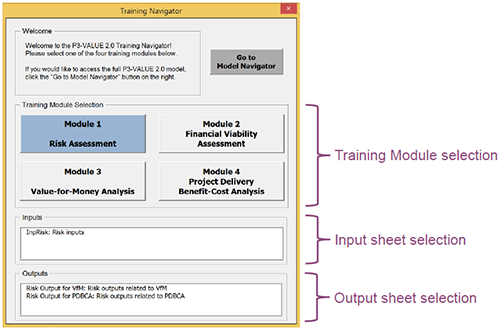
View larger image of the user interface
Tool and References
Webinar Summary
Lesson 1 Types of Project Delivery Evaluation
Lesson 2 Timing of Project Delivery Evaluation
Lesson 3 Value for Money Analysis
Lesson 4 Project Delivery Benefit-Cost Analysis
Lesson 5 Risk Valuation
Lesson 6 Financial Viability Evaluation
Lesson 7 FHWA's P3 Toolkit
Upcoming P3-VALUE Training
- February 8 - Value for Money Analysis
- February 22 - Project Delivery Benefit Cost Analysis
- March 7 - Risk Valuation
- March 21 - Financial Viability Assessment
To register for the P3-VALUE webinars, please visit:
https://www.eventbrite.com/e/p3-value-webinar-series-registration-19955277773
Resources
FHWA's Center for Innovative Finance Support Website:
https://www.fhwa.dot.gov/ipd/
P3 Website:
https://www.fhwa.dot.gov/ipd/p3/
Contact Information
P3 Program Manager
Center for Innovative Finance Support
Federal Highway Administration
(202) 366-4076
Patrick.DeCorla-Souza@dot.gov
Questions?
Submit a question using the chat box