


Patrick DeCorla-Souza
P3 Program Manager
Office of Innovative Program Delivery

Wim Verdouw
Financial Modeler IMG/Rebel
Part 1 Recap of P3 Evaluation and Financial Viability Assessment
Part 2 Introduction to P3-VALUE 2.1 Enhancements
Part 3 Illustrative Example Application for Financial Viability Assessment
P3-VALUE 2.1 Webinar
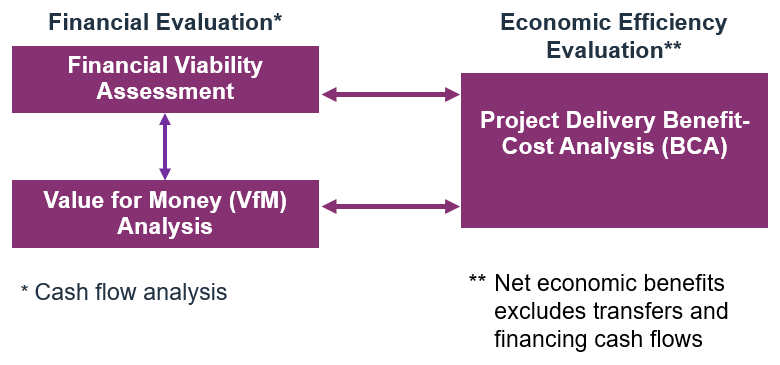
| Financial Evaluation* | Economic Efficiency Evaluation** | |
| Financial Viability Assessment |
Project Delivery Benefit- Cost Analysis (BCA) | |
| Value for Money (VfM) Analysis | ||
| * Cash flow analysis | ** Net economic benefits excludes transfers and financing cash flows |
1. Planning:
2. Project Development:
3. Procurement:
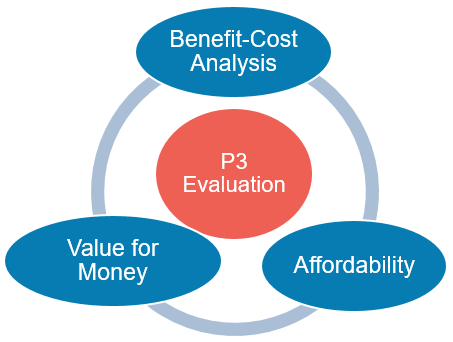
Text description of P3 Evaluation chart
P3 Evaluation
Flow chart showing:
Benefit-Cost Analysis flows to...
Affordability flows to...
Value for Money flows to...
Benefit-Cost Analysis flows to...
| Sources of Funds | Uses of Funds |
|---|---|
|
|
P3-VALUE 2.1 |
|
|
|
FHWA's Financial Structuring and Assessment for Public- Private Partnerships: A Primer at:
https://www.fhwa.dot.gov/ipd/pdfs/p3/p3_primer_financial_ass essment_1213.pdf
FHWA's Guidebook on Financing of Highway Public- Private Partnership Projects at:
https://www.fhwa.dot.gov/ipd/pdfs/p3/p3- toolkit_p3_project_financing_guidebook_122816.pdf
P3-VALUE 2.1 Webinar
P3-VALUE 2.1 Webinar
A study was done previously by a state DOT to estimate financial viability of conventional and P3 delivery for a highway project. The various inputs required for the analysis are included in the P3-VALUE
2.1 spreadsheet model.
| Project Delivery Inputs | PSC | P3 | |
| Facility tolled? | TRUE | ||
| P3 delivery model | ////// | Toll concession | |
| Project Timing Inputs | PSC | P3 | |
| Pre-construction start year | 2018 | 2018 | |
| Pre-construction duration (in years) | 2 years | 2 years | |
| Construction duration (in years) | 4 years | 3 years | |
| Operations duration (in years) | 40 years | 41 years | |
| Delayed PSC pre-construction start year | 2023 | ||
| Capital Cost Inputs (Risk Adjusted)* | PSC | P3* | |
| Public procurement cost (in million $) | $5.0M | $10.0M | 0% |
| Private procurement cost (in million $) | $5.0M | $10.0M | 100% |
| Pre-construction cost (in million $) | $25.0M | $22.5M | 100% |
| Construction cost (in million $) | $400.0M | $367.5M | 100% |
| Operational Cost Inputs (Risk Adjusted)* | PSC | P3* | |
| Annual routine O&M cost (in million $/year) | $4.0M | $3.6M | 100% |
| Major maintenance cost (in million $) | $10.0M | $9.0M | 100% |
| Major maintenance frequency (in years) | 8 years | 8 years | |
| No Build annual O&M cost (in million $/year) | $10.0M | ||
| Financing Inputs | PSC | P3 |
| Subsidy/milestone payment (in million $) | $100.0M | $100.0M |
| Cost of equity (in percent) | ////// | 12.00% |
| Gearing (in percent) | ////// | 75.00% |
| Debt maturity (from start construction, in years) | 35 years | 30 years |
| Debt interest rate (in percent) | 4.00% | 6.00% |
| Equity bridge loan interest rate (in percent) | ////// | 6.00% |
| Minimum required DSCR (multiple of debt service) | 1.30x | 1.30x |
| Interest rate on reserves (in percent) | 2.00% | 2.00% |
| Debt issuance/arrangement fee (in percent) | 1.00% | 1.00% |
| Financing Inputs | PSC | P3 |
| Subsidy/milestone payment (in million $) | $100.0M | $100.0M |
| Cost of equity (in percent) | ////// | 10.00% |
| Gearing (in percent) | ////// | 85.00% |
| Debt maturity (from start construction, in years) | 35 years | 30 years |
| Debt interest rate (in percent) | 4.00% | 6.00% |
| Equity bridge loan interest rate (in percent) | ////// | 6.00% |
| Minimum required DSCR (multiple of debt service) | 1.30x | 1.20x |
| Interest rate on reserves (in percent) | 2.00% | 2.00% |
| Debt issuance/arrangement fee (in percent) | 1.00% | 1.00% |
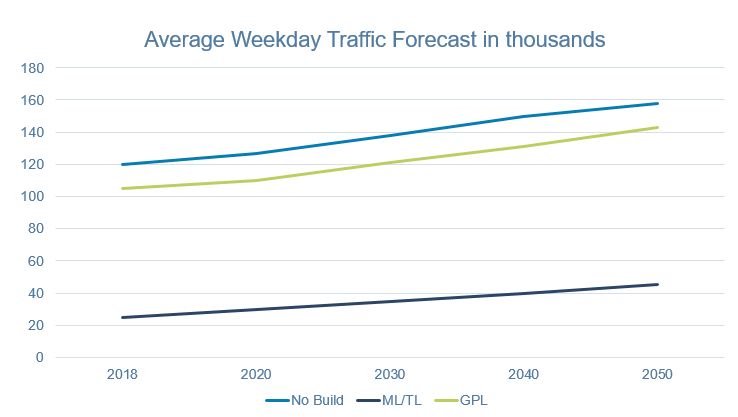
Text of Average Weekday Traffic Forecast in thousands chart
| Average Weekday Traffic Forecast in thousands | No Build | ML/TL | GPL |
|---|---|---|---|
| 2018 | ~ 120 | ~22 | ~105 |
| 2020 | ~130 | ~30 | ~106 |
| 2030 | ~139 | ~34 | ~120 |
| 2040 | ~150 | ~40 | ~130 |
| 2050 | ~159 | ~42 | ~141 |
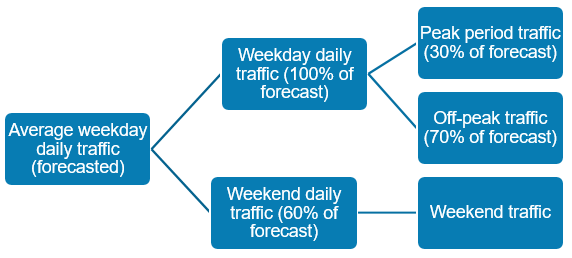
Toll rates vary by time period and vehicle type
| Peak period traffic | Off-peak traffic | Weekend traffic |
|---|---|---|
| Passenger car | Passenger car | Passenger car |
| Truck | Truck | Truck |
| Bidirectional P50 Traffic Inputs | Year | No Build | ML/TL | GPL |
| Weekday daily traffic in model start year (in thousands) | 2018 | 120k | 25k | 105k |
| Weekday daily traffic in input year 2 (in thousands) | 2020 | 127k | 30k | 110k |
| Weekday daily traffic in input year 3 (in thousands) | 2030 | 138k | 35k | 121k |
| Weekday daily traffic in input year 4 (in thousands) | 2040 | 150k | 40k | 131k |
| Weekday daily traffic in input year 5 (in thousands) | 2050 | 158k | 45k | 142k |
| Annual traffic growth after last input year (in percent) | > 2050 | 0.50% | 1.00% | 0.50% |
| Toll Inputs | No Build | ML/TL | GPL | |
| Passenger car toll rate - Weekday peak (in dollars) | $0.00 | $4.00 | $0.00 | |
| Passenger car toll rate - Weekday off-peak (in dollars) | $0.00 | $2.00 | $0.00 | |
| Passenger car toll rate - Weekend (in dollars) | $0.00 | $2.00 | $0.00 | |
| Truck/bus axle toll rate - Weekday peak (in dollars) | $0.00 | $6.00 | $0.00 | |
| Truck/bus axle toll rate - Weekday off-peak (in dollars) | $0.00 | $4.00 | $0.00 | |
| Truck/bus axle toll rate - Weekend (in dollars) | $0.00 | $4.00 | $0.00 | |
| Traffic Characteristics, Share & Speed Inputs | No Build | ML/TL | GPL | |
| No. of lanes per direction | 3 lanes | 2 lanes | 3 lanes | |
| Unidirectional peak traffic percentage (% of total traffic) | 30% | 30% | 30% | |
| Weekend traffic (% of weekday traffic) | 60% | 60% | 60% | |
| Passenger car percentage - Peak (% of total traffic) | 95% | 100% | 95% | |
| Passenger car percentage - Off-peak (% of total traffic) | 90% | 100% | 90% | |
| Passenger car percentage - Weekend (% of total traffic) | 95% | 100% | 95% | |
| Highway free flow speed - Passenger car (in mph) | 65 mph | 70 mph | 70 mph | |
| Highway free flow speed - Truck/bus (in mph) | 60 mph | 65 mph | 65 mph | |
| Ramp-Up & Other Inputs | |
| Ramp-up starting traffic (% of post-ramp up traffic) | 50% |
| Ramp-up period duration (in years) | 5 years |
| Toll revenue leakage (in percent) | 1.00% |
| Segment length (in miles) | 20 miles |
| No. of unidirectional peak hours in a day (during AM, PM or combined) | 3 hours |
| No. of unidirectional off-peak hours in a day | 15 hours |
| Taxation Inputs | State | Federal |
| Tax rate (in percent) | 10.00% | 25.00% |
| Tax considered for competitive neutrality adjustment? | TRUE | TRUE |
| Indexation Inputs | |
| Indexation and NPV base year | 2018 |
| Indexation rate for construction, operations, tolls & subsidy (in percent) | 2.00% |
| Indexation rate for availability payments (in percent) | 0.50% |
| Nominal discount rate (in percent, used for VfM) | 4.00% |
| Real discount rate (in percent, used for BCA) | 2.00% |
| Conventional Delivery - Debt service coverage ratio | Ratio | Unit |
| Average calculated DSCR | 1.30 | ratio |
| Minimum calculated DSCR | 1.30 | ratio |
| Minimum calculated vs. minimum required DSCR alert | - | alert |
| Conventional Delivery - Sources of funding and financing | Amount | |
| Debt amount | $363M | |
| Subsidy/milestone payment | $103M | |
| Additional required subsidy | $38M | |
| Total sources of funding and financing | $504M | |
| P3 - Debt service coverage ratio | Ratio | Unit |
| Average calculated DSCR | 1.63 | ratio |
| Minimum calculated DSCR | 1.63 | ratio |
| Minimum calculated DSCR vs. required DSCR alert | - | alert |
| P3 - Sources of funding and financing | Amount | |
| Debt amount | $260M | |
| Subsidy/milestone payment to Developer | $102M | |
| Additional required subsidy to Developer | $1M | |
| Equity contribution | $87M | |
| Total sources of funding and financing | $449M | |
| P3 - Financial outputs | Value | Unit |
| Pre-tax equity IRR | 12.00% | % p.a. |
| Post-tax equity IRR | 10.35% | % p.a. |
| Pre-tax P3 WACC | 8.88% | % p.a. |
| Post-tax P3 WACC | 7.99% | % p.a. |
| Additional required subsidy from Agency (if applicable) | $1M | |
| Concession fee to Agency (if applicable) | ||
| Annual availability payment (if applicable) | ||
| Interest capitalized during operations? (Yes, No) | Yes | text |
| No. of years interest is capitalized during operations | 5 | years |
| Maximum outstanding debt | $270M | |
| Maximum debt-to-equity ratio* | 75.71% | % |
| P3 - Debt service coverage ratio | Ratio | Unit |
| Average calculated DSCR | 1.22 | ratio |
| Minimum calculated DSCR | 1.22 | ratio |
| Minimum calculated DSCR vs. required DSCR alert | - | alert |
| P3 - Sources of funding and financing | Amount | |
| Debt amount | $304M | |
| Subsidy/milestone payment to Developer | $102M | |
| Additional required subsidy to Developer | - | |
| Equity contribution | $54M | |
| Total sources of funding and financing | $459M | |
| P3 - Financial outputs | Value | Unit |
| Pre-tax equity IRR | 10.00% | % p.a. |
| Post-tax equity IRR | 7.50% | % p.a. |
| Pre-tax P3 WACC | 7.43% | % p.a. |
| Post-tax P3 WACC | 6.66% | % p.a. |
| Additional required subsidy from Agency (if applicable) | ||
| Concession fee to Agency (if applicable) | ||
| Annual availability payment (if applicable) | $34M | |
| Interest capitalized during operations? (Yes, No) | No | text |
| No. of years interest is capitalized during operations | - | years |
| Maximum outstanding debt | $304M | |
| Maximum debt-to-equity ratio* | 85.00% | % |
P3 Program Manager
USDOT Build America Bureau
& FHWA Center for Innovative Finance Support (202) 366-4076
Patrick.DeCorla-Souza@dot.gov