


Patrick DeCorla-Souza
P3 Program Manager
Office of Innovative Program Delivery
Wim Verdouw
Financial Modeler
IMG/Rebel

Part 1 Recap of Value for Money (VfM) Assessment
Part 2 P3-VALUE 2.1 Enhancements
Part 3 Illustrative Application VfM Assessment
1. Planning - High level screening for financial viability and VfM
2. Project Development - More detailed quantitative assessment of financial viability and VfM
3. Procurement - Refine financial and VfM analyses as cost and revenue estimates are refined and bids are received
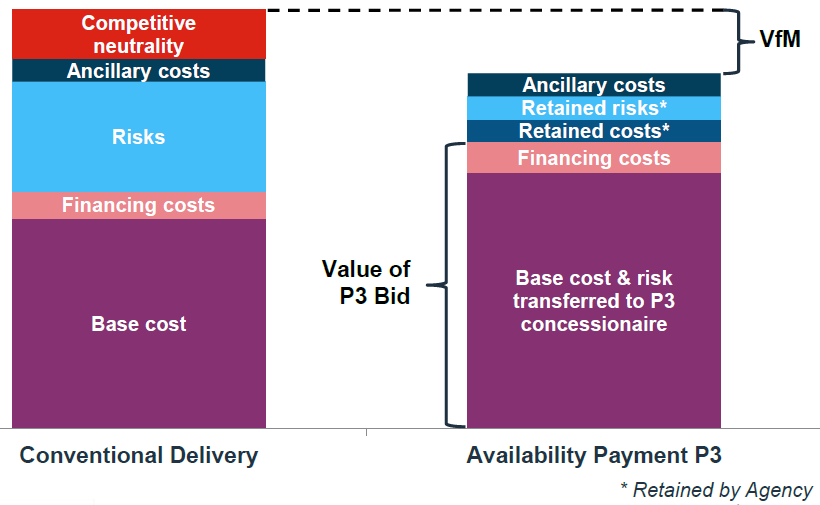
Conventional delivery is made up of:
Availability Payment P3 is made up of:
**Value of P3 Bid is determined using these two costs
*Retained by Agency
VfM is the difference between Conventional Delivery and Availability Payment P3 totals.
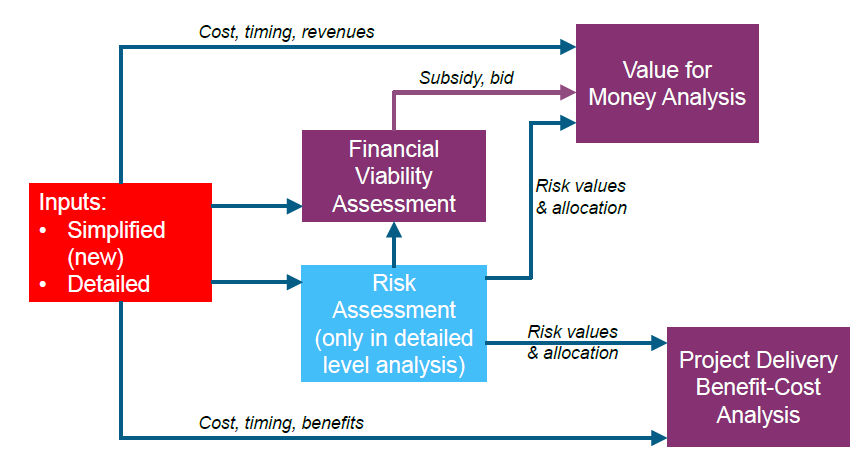
Text description of flow chart
Inputs:
Please stand by while we open the P3-VALUE 2.1 tool to show the enhanced features
| Project Delivery Inputs | PSC | P3 | |
|---|---|---|---|
| Facility tolled? | TRUE | ||
| P3 delivery model | ///////////////////////// | Toll concession | |
| Project Timing Inputs | PSC | P3 | |
| Pre-construction start year | 2018 | 2018 | |
| Pre-construction duration (in years) | 2 years | 2 years | |
| Construction duration (in years) | 4 years | 3 years | |
| Operations duration (in years) | 40 years | 41 years | |
| Delayed PSC pre-construction start year | 2023 | ||
| Capital Cost Inputs (Risk Adjusted)* | PSC | P3* | |
| Public procurement cost (in million $) | $5.0M | $10.0M | 0% |
| Private procurement cost (in million $) | $5.0M | $10.0M | 100% |
| Pre-construction cost (in million $) | $25.0M | $22.5M | 100% |
| Construction cost (in million $) | $400.0M | $367.5M | 100% |
| Financing Inputs | PSC | P3 |
|---|---|---|
| Subsidy/milestone payment (in million $) | $100.0M | $100.0M |
| Cost of equity (in percent) | ////////////////////// | 12.00% |
| Gearing (in percent) | ////////////////////// | 75.00% |
| Debt maturity (from start construction, in years) | 35 years | 30 years |
| Debt interest rate (in percent) | 4.00% | 6.00% |
| Equity bridge loan interest rate (in percent) | ////////////////////// | 6.00% |
| Minimum required DSCR (multiple of debt service) | 1.30x | 1.30x |
| Interest rate on reserves (in percent) | 2.00% | 2.00% |
| Debt issuance/arrangement fee (in percent) | 1.00% | 1.00% |
| Financing Inputs | PSC | P3 |
|---|---|---|
| Subsidy/milestone payment (in million $) | $100.0M | $100.0M |
| Cost of equity (in percent) | ////////////////////// | 10.00% |
| Gearing (in percent) | ////////////////////// | 85.00% |
| Debt maturity (from start construction, in years) | 35 years | 30 years |
| Debt interest rate (in percent) | 4.00% | 6.00% |
| Equity bridge loan interest rate (in percent) | ////////////////////// | 6.00% |
| Minimum required DSCR (multiple of debt service) | 1.30x | 1.20x |
| Interest rate on reserves (in percent) | 2.00% | 2.00% |
| Debt issuance/arrangement fee (in percent) | 1.00% | 1.00% |
| Lifecycle Performance Risk & Revenue Uncertainty Adjustment Inputs | |
|---|---|
| Lifecycle performance risk calculation method (see options below) | Option 1 |
| Lifecycle performance risk aggregate premium (in million $, option 2 only) | $400.0M |
| Revenue uncertainty adjustment calculation method (see options below) | Option 1 |
| Delta between availability payment & toll concession WACC (in percent, option 1 only) | 1.60% |
| Revenue uncertainty adjustment (% of toll revenue collection, option 2 only) | 28.00% |
| Guidance for Valuation Options | |
| Option 1: WACC-based risk premium is calculated to determine the value of lifecycle performance risks/revenue uncertainty adjustment | |
| Option 2: User to provide a risk premium for the value of lifecycle performance risks/revenue uncertainty adjustment | |
| Option 3: Lifecycle performance risks/revenue uncertainty adjustment are ignored in the analysis | |
| Taxation Inputs | State | Federal |
|---|---|---|
| Tax rate (in percent) | 10.00% | 25.00% |
| Tax considered for competitive neutrality adjustment? | TRUE | TRUE |
| Competitive Neutrality Adjustment Inputs | ||
| Value of construction self-insurance (% of transferred construction costs) | 0.00% | |
| Value of O&M and major maintenance self-insurance (% of transferred costs) | 0.00% | |
| Value of credit subsidy or tax benefits under PSC delivery (in million $) | $0.0M | |
| Value of credit subsidy or tax benefits under P3 delivery (in million $) | $0.0M | |
| REVENUES & COSTS (NPV @ 4.00%, 2018) | PSC | P3 | ||
|---|---|---|---|---|
| Toll revenues | ||||
| Toll revenues to Agency | $784M | - | ||
| Toll revenues to P3 Developer | //////////// | $806M | ||
| Toll revenues subtotal | $784M | $806M | ||
| Cost component 1a: Total/transferred base costs (including risks transferred to subcontractors) | ||||
| Total (PSC)/Transferred (P3) pre-construction (including private procurement costs) | ($28M) | ($30M) | ||
| Total (PSC)/Transferred (P3) construction costs | ($374M) | ($347M) | ||
| Total (PSC)/Transferred (P3) O&M costs (including private procurement costs) | ($129M) | ($120M) | ||
| Base cost subtotal 1a | ($531M) | ($497M) | ||
| Cost component 1b: Retained base costs (P3 only) | ||||
| Retained pre-construction costs | //////////// | - | ||
| Retained construction costs | //////////// | - | ||
| Retained O&M costs (including P3 oversight costs) | //////////// | - | ||
| Retained base cost subtotal 1b | - | - | ||
| Base costs subtotal (1a + 1b) | ($531M) | ($497M) | ||
| Cost component 2: Financing costs | ||||
| Financing cost | ($3M) | ($397M) | ||
| Financing cost subtotal | ($3M) | ($397M) | ||
| P3 Shadow Bid (Revenues to P3 minus cost components 1a & 2) | N.A. | ($88M) | Shadow Bid |
|
| REVENUES & COSTS (NPV @ 4.00%, 2018) | PSC | P3 | ||
|---|---|---|---|---|
| Cost component 3: Long-term risks retained by Agency | ||||
| Calculated market value of lifecycle performance risk | ($105M) | //////////// | ||
| Calculated market value of revenue uncertainty adjustment | ($162M) | - | ||
| Long-term risks retained by Agency subtotal | ($267M) | - | ||
| Cost component 4: Ancillary costs & cost savings | ||||
| Procurement & oversight cost in the design-build phase | ($5M) | ($9M) | ||
| No Build cost savings | $250M | $259M | ||
| Ancillary costs & cost savings subtotal | $245M | $250M | ||
| Cost component 5: Competitive neutrality adjustment | ||||
| State taxes | //////////// | $36M | ||
| Federal taxes | //////////// | $81M | ||
| Value of public agency self-insurance | //////////// | - | ||
| Net credit subsidy adjustment (NPV of PSC credit subsidy - NPV of P3 credit subsidy) | //////////// | - | ||
| Competitive neutrality adjustment subtotal | - | $116M | ||
| Total net value after revenue | $228M | $278M | VfM Comparison |
|
| Note: Calculated market value of lifecycle performance risk | ($105M) | //////////// | ||
| Note: Calculated market value of revenue uncertainty adjustment | ($162M) | //////////// | ||
| Social welfare benefits due to P3 delivery (excluding No Build cost savings) | $166M | |||
| Social welfare benefits due to project acceleration | $431M | |||
| REVENUES & COSTS (NPV @ 4.00%, 2018) | PSC | P3 | ||
|---|---|---|---|---|
| Toll revenues | ||||
| Toll revenues to Agency | $784M | $806M | Revenue risk borne by Agency |
|
| Toll revenues to P3 Developer | //////////// | - | ||
| Toll revenues subtotal | $784M | $806M | ||
| Cost component 1a: Total/transferred base costs (including risks transferred to subcontractors) | ||||
| Total (PSC)/Transferred (P3) pre-construction (including private procurement costs) | ($28M) | ($30M) | ||
| Total (PSC)/Transferred (P3) construction costs | ($374M) | ($347M) | ||
| Total (PSC)/Transferred (P3) O&M costs (including private procurement costs) | ($129M) | ($120M) | ||
| Base cost subtotal 1a | ($531M) | ($497M) | ||
| Cost component 1b: Retained base costs (P3 only) | ||||
| Retained pre-construction costs | //////////// | - | ||
| Retained construction costs | //////////// | - | ||
| Retained O&M costs (including P3 oversight costs) | //////////// | - | ||
| Retained base cost subtotal 1b | - | - | ||
| Base costs subtotal (1a + 1b) | ($531M) | ($497M) | ||
| Cost component 2: Financing costs | ||||
| Financing cost | ($3M) | ($180M) | ||
| Financing cost subtotal | ($3M) | ($180M) | ||
| P3 Shadow Bid (Revenues to P3 minus cost components 1a & 2) | N.A. | ($677M) | Shadow Bid |
|
| REVENUES & COSTS (NPV @ 4.00%, 2018) | PSC | P3 | ||
|---|---|---|---|---|
| Cost component 3: Long-term risks retained by Agency | ||||
| Calculated market value of lifecycle performance risk | ($142M) | //////////// | ||
| Calculated market value of revenue uncertainty adjustment | ($184M) | ($190M) | Retained revenue risk |
|
| Long-term risks retained by Agency subtotal | ($326M) | ($190M) | ||
| Cost component 4: Ancillary costs & cost savings | ||||
| Procurement & oversight cost in the design-build phase | ($5M) | ($9M) | ||
| No Build cost savings | $250M | $259M | ||
| Ancillary costs & cost savings subtotal | $245M | $250M | ||
| Cost component 5: Competitive neutrality adjustment | ||||
| State taxes | //////////// | $15M | ||
| Federal taxes | //////////// | $34M | ||
| Value of public agency self-insurance | //////////// | - | ||
| Net credit subsidy adjustment (NPV of PSC credit subsidy - NPV of P3 credit subsidy) | //////////// | - | ||
| Competitive neutrality adjustment subtotal | - | $49M | ||
| Total net value after revenue | $169M | $239M | VfM Comparison |
|
| Note: Calculated market value of lifecycle performance risk | ($142M) | //////////// | ||
| Note: Calculated market value of revenue uncertainty adjustment | ($184M) | //////////// | ||
| Social welfare benefits due to P3 delivery (excluding No Build cost savings) | $166M | |||
| Social welfare benefits due to project acceleration | $424M | |||
P3 Program Manager
USDOT Build America Bureau
& FHWA Center for Innovative Finance Support
(202) 366-4076
Patrick.DeCorla-Souza@dot.gov