Presentation


Presenters
Benjamin Perez
Principal Consultant
WSP |
Parsons Brinckerhoff

Mark Sullivan
Director
Center for Innovative
Finance Support
Federal Highway Administration

Patrick DeCorla -Souza
P3 Program Manager,
Build America Bureau & Federal Highway Administration

Presentation Overview
- Introduction and Definitions (Chapters 1 & 2)
- Federal Role (Chapter 3)
- Evolution of the U.S. P3 Market (Chapter 4)
- P3 Stories (Appendix)
This presentation will introduce Chapters 1- 4.
Introduction and Definitions (Chapters 1 and 2)
Purpose
- Provide U.S. highway experience with highway public-private
partnership (P3) concessions since 1992, including:
- Evolution of the federal role
- Trends and market developments
- Case studies of all 28 U.S. P3 highway concession projects
that have achieved financial close
U.S. P3 Concessions by Status
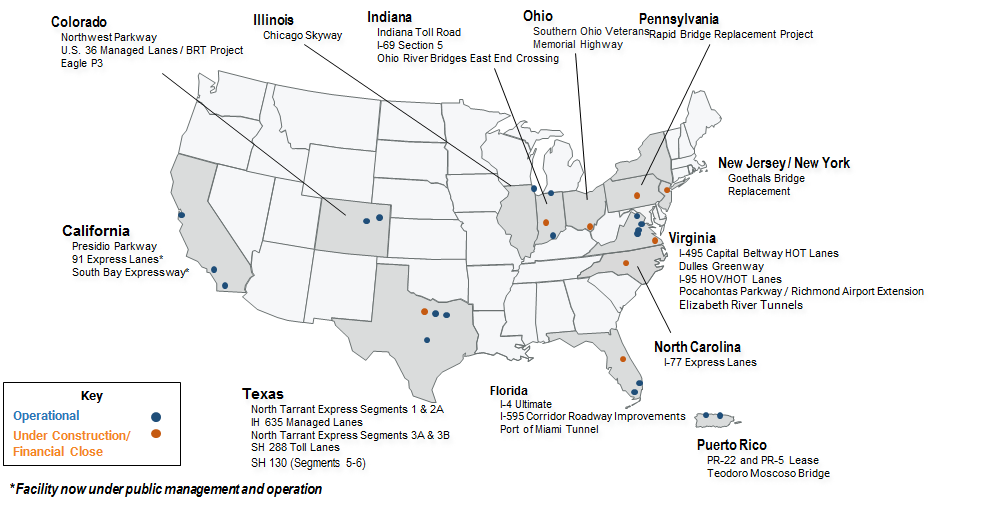
View
larger version of P3 Concessions by Status map
Spectrum of Project Delivery Options
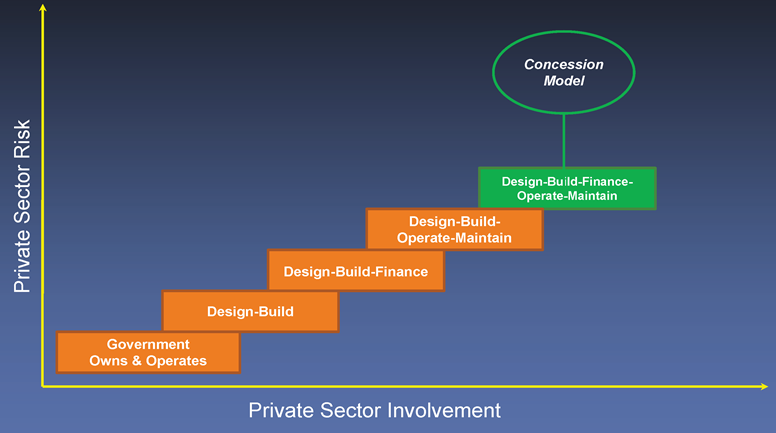
View
larger version of Project Delivery Options chart
DBFOM Concession Types
New Build Projects
- Real Toll Concessions
- Greenfield Toll Roads
- Fixed Crossings
- Priced Managed Lanes
- Availability Payment Concessions
Existing Toll Roads
- Long-term Lease Concessions
Typical Toll Concession P3 Structure
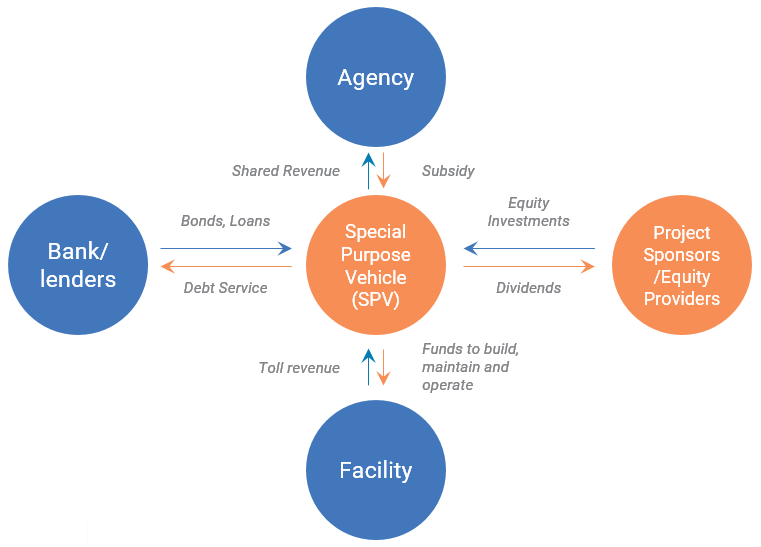
View larger version of Typical Toll Concessions P3 Structure flow chart
Real Toll Concessions
- Used to develop three types of projects:
- Greenfield toll roads
- Fixed crossings
- Priced managed lanes
Typical Availability P3 Structure
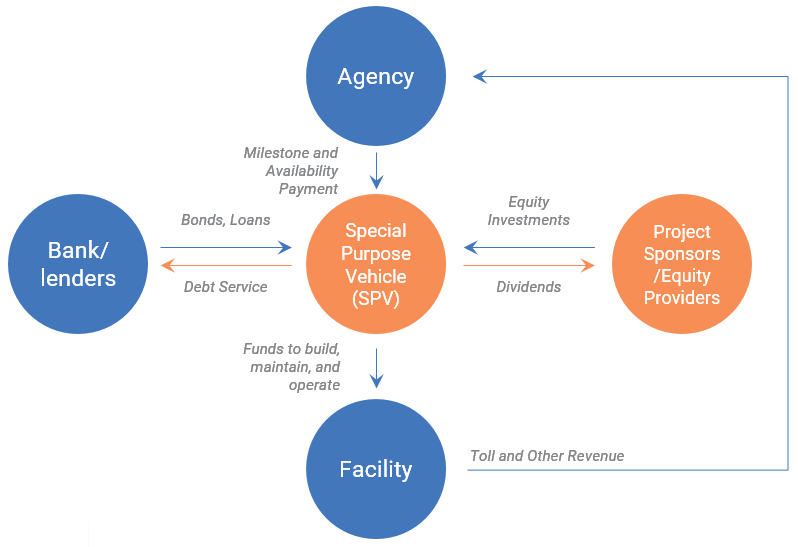
View larger version of Typical Availability P3 Structure flow chart
Typical Long-term Lease Concession P3 Structure

View larger version of Typical Long-term Lease Concession P3 Structure
flow chart
Federal Role (Chapter 3)
TE-045
- 1994: TE-045 - initiative to test and evaluate ideas from states
on new financial strategies
- Matching
- Toll Credits
- Advance Construction
GARVEE Bonds
- 1995: Grant Anticipation Revenue Vehicle (GARVEE bond)
- Allows states to leverage future Federal Aid Highway Program
receipts in the municipal credit market
TIFIA
- 1998: Transportation Infrastructure Finance and Innovation Act
(TIFIA)
- Provides loans, guarantees and lines of credit for qualified
revenue-generating projects
- Covers up to one third of eligible costs
- Attractive low interest rates tied to U.S. Treasury bonds
Private Activity Bonds
- 2005: Private Activity Bonds (PABs)
- Allows private developers of highways and freight transfer
facilities to borrow funds in the tax-exempt municipal credit
market
- Total volume of PABs limited to $15 billion
SEP-15
- Special Experimental Program 15 (SEP-15)
- An experimental process for FHWA to identify and test new
P3 approaches
- Provides states with the opportunity to gain exceptions
from or changes to federal policies or procedures
Other USDOT Support
- Build America Bureau and FHWA Center for Innovative Finance
Support
- Analytical Tools
- Educational Materials
- Research
- Peer Exchanges
- Capacity Building
- Technical Assistance
- Environmental Streamlining
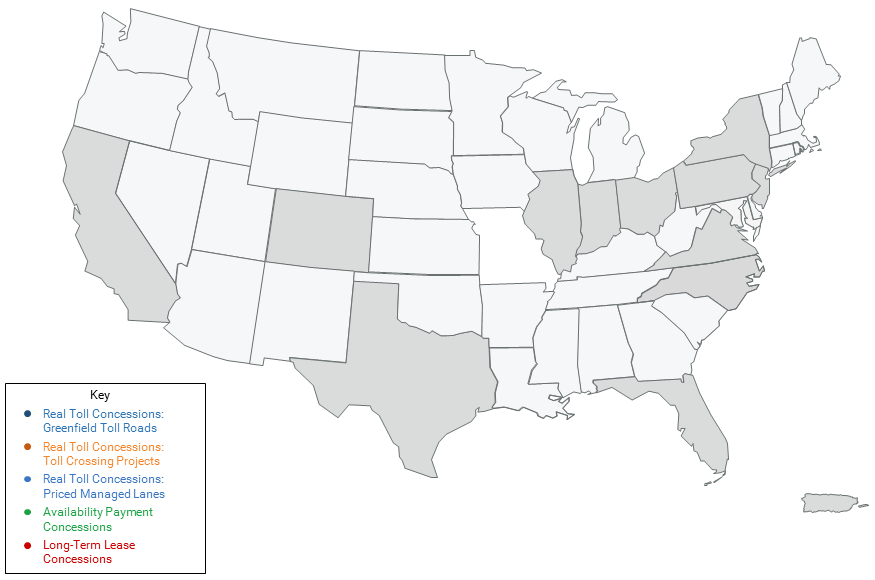
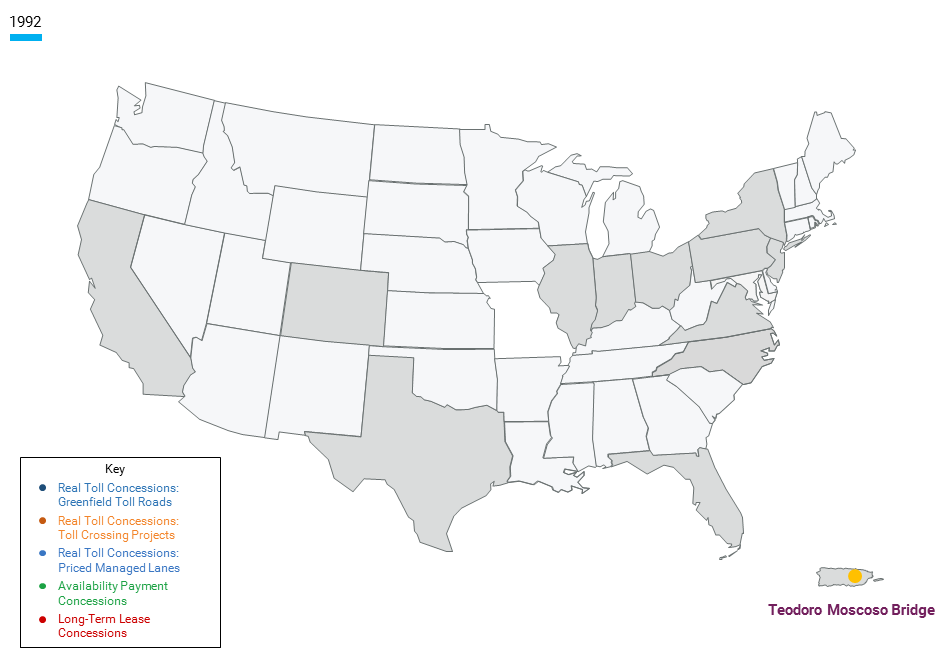
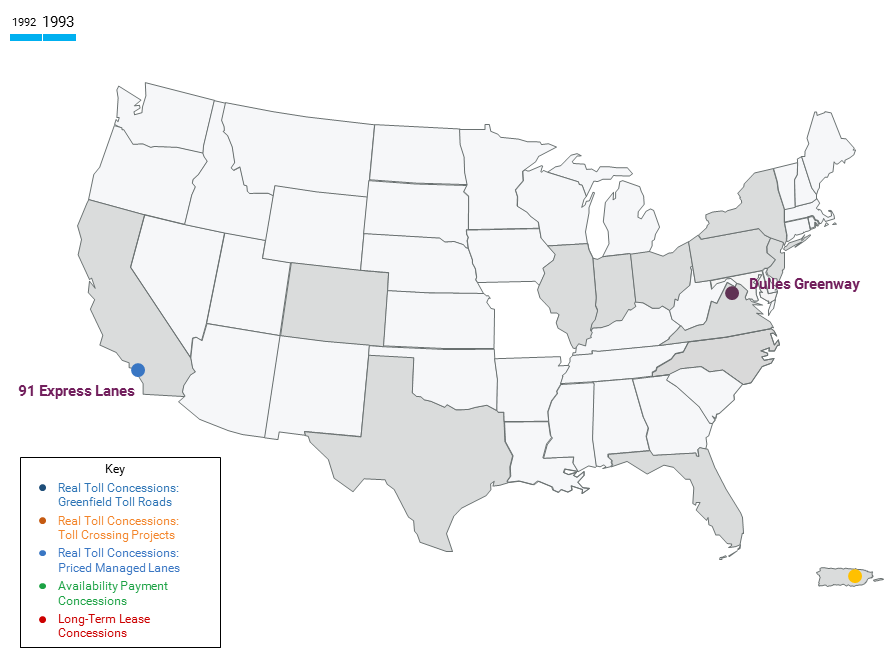
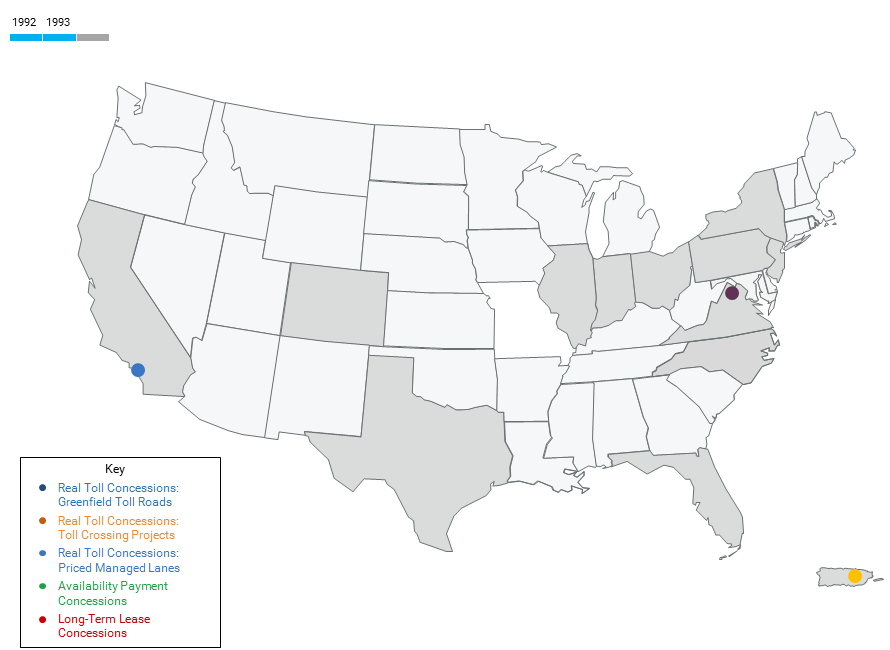
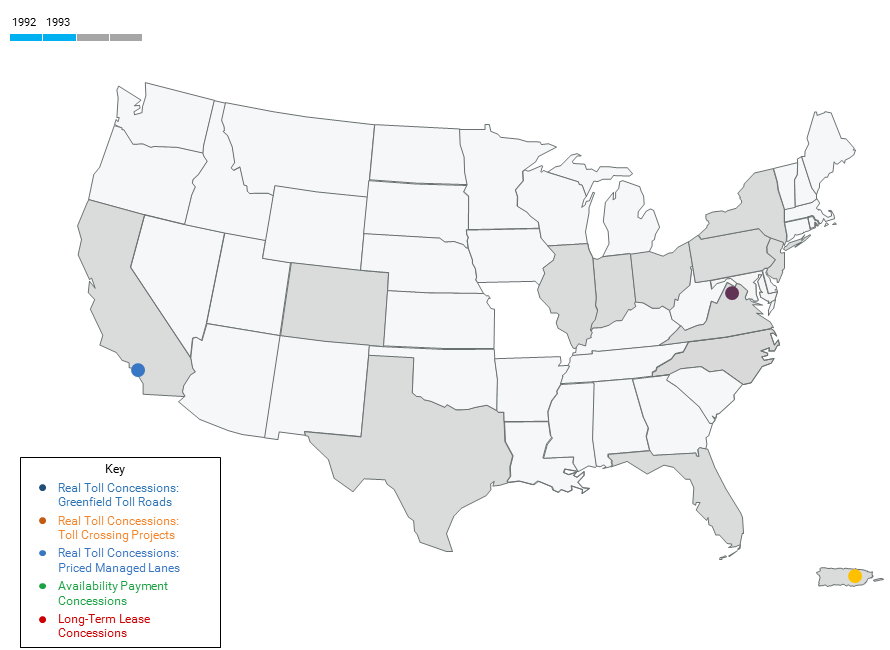
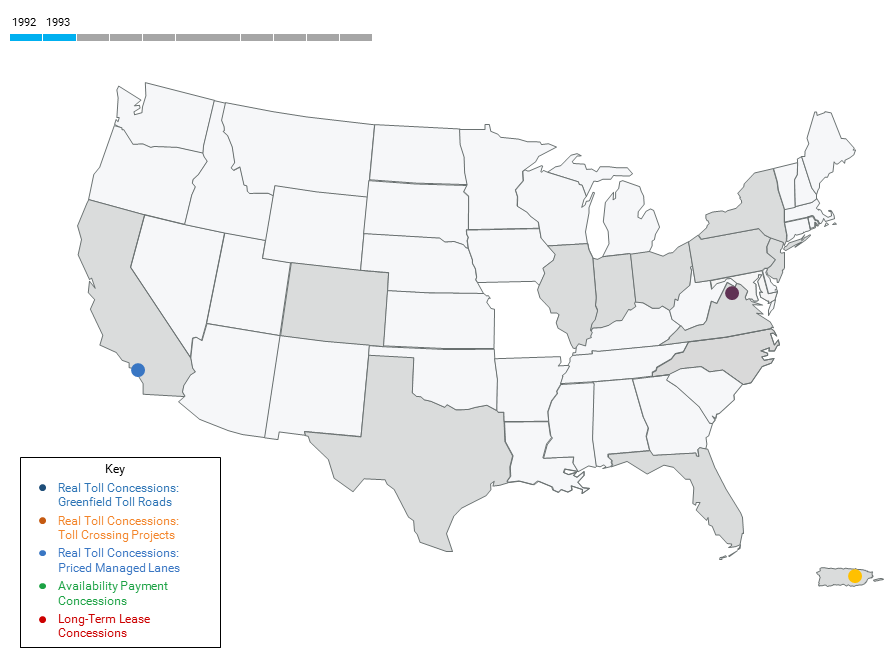
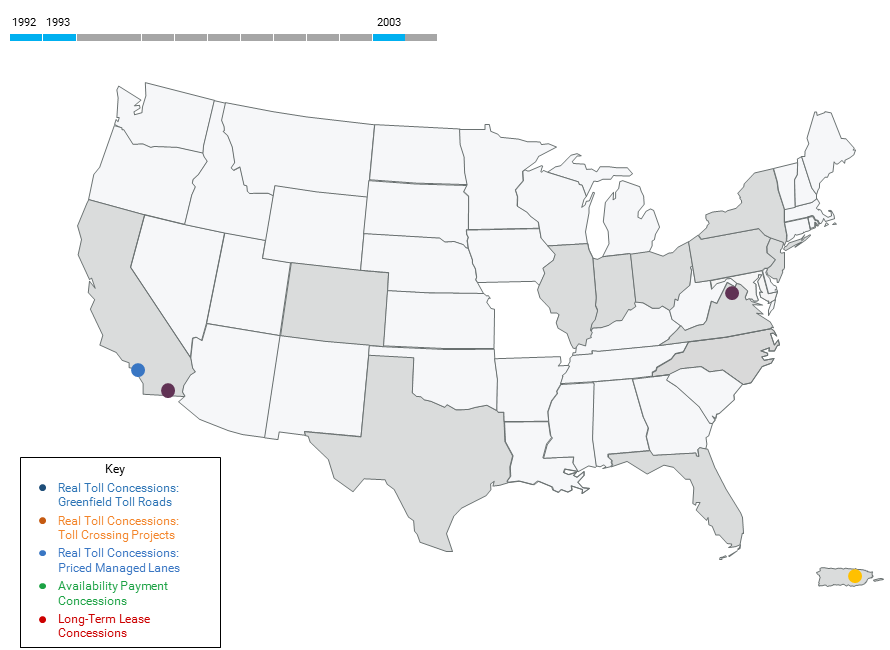
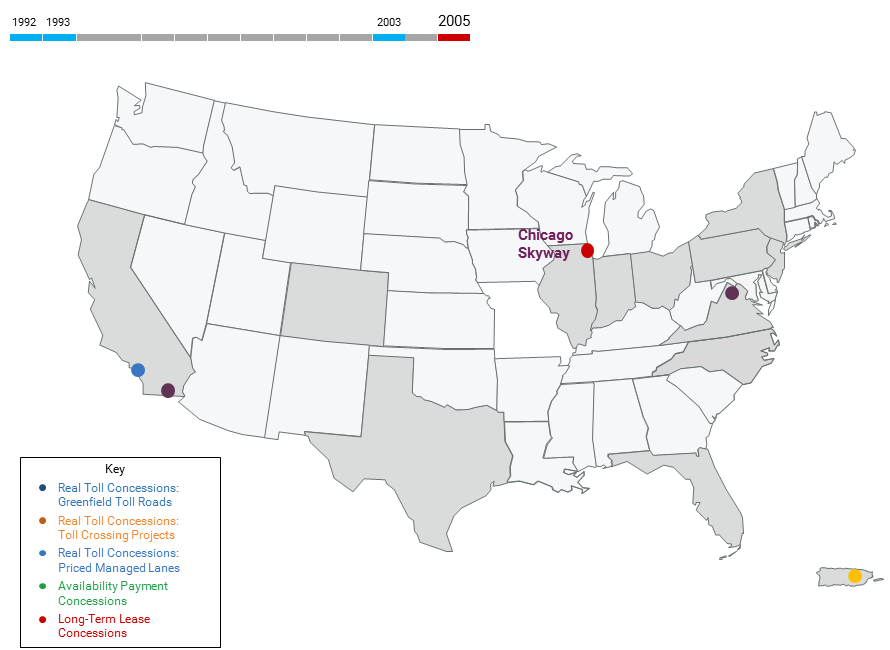
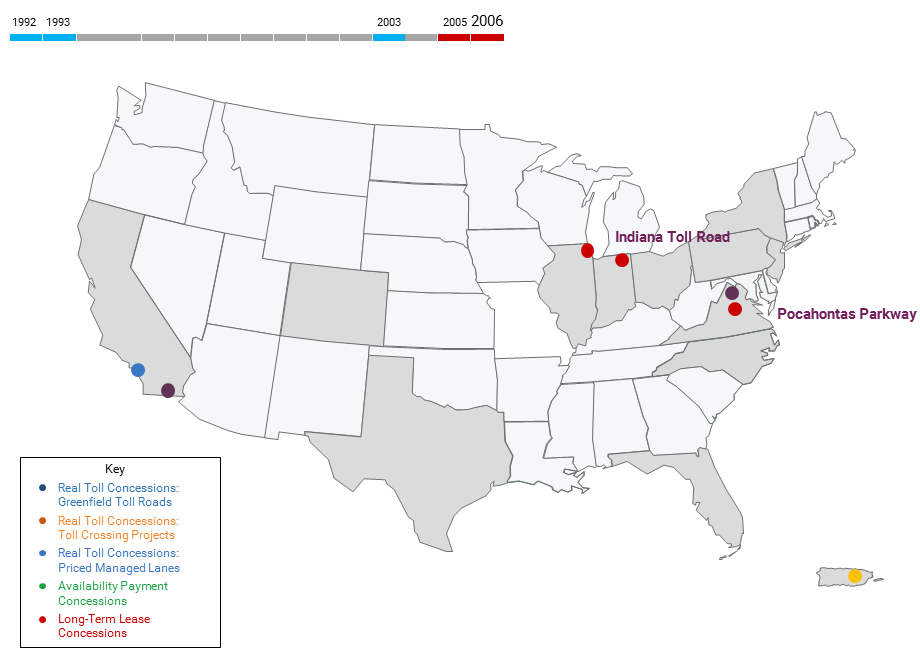
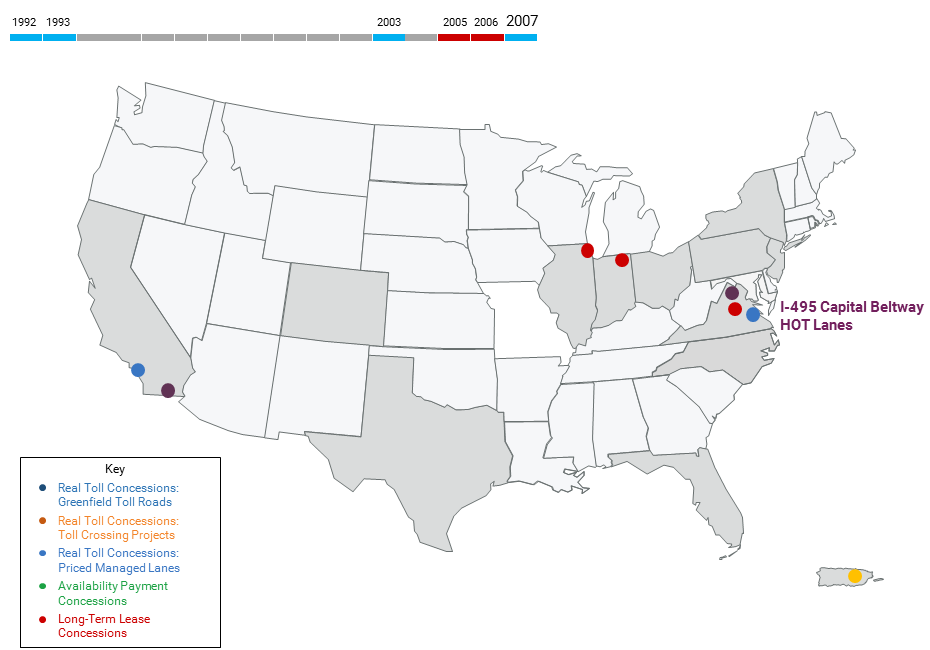
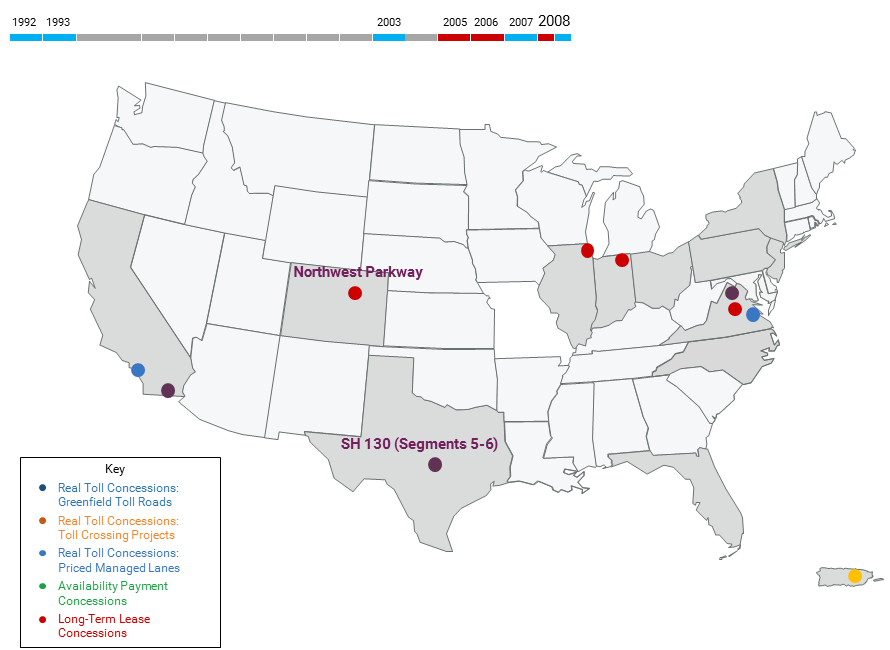
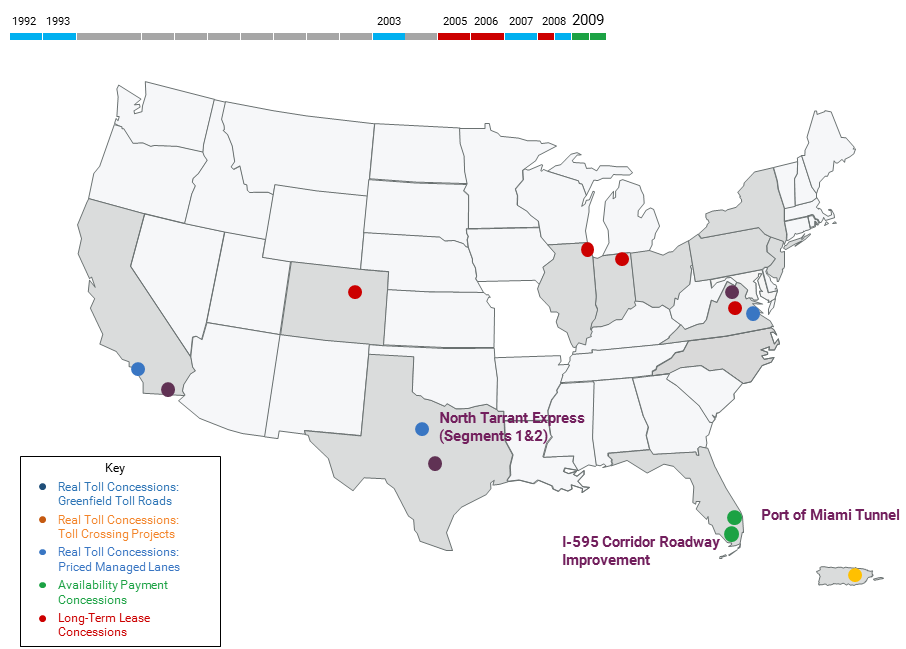
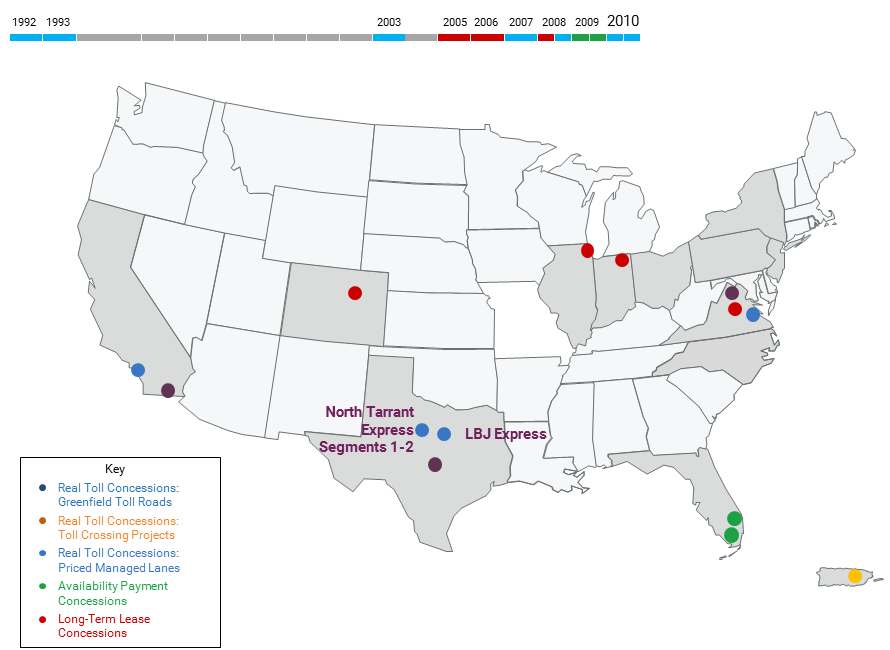
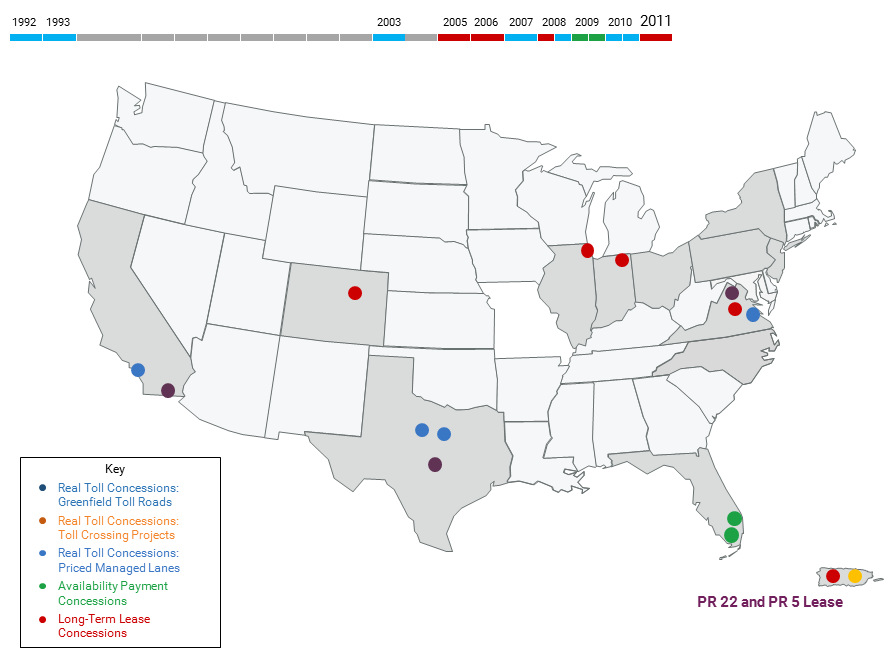
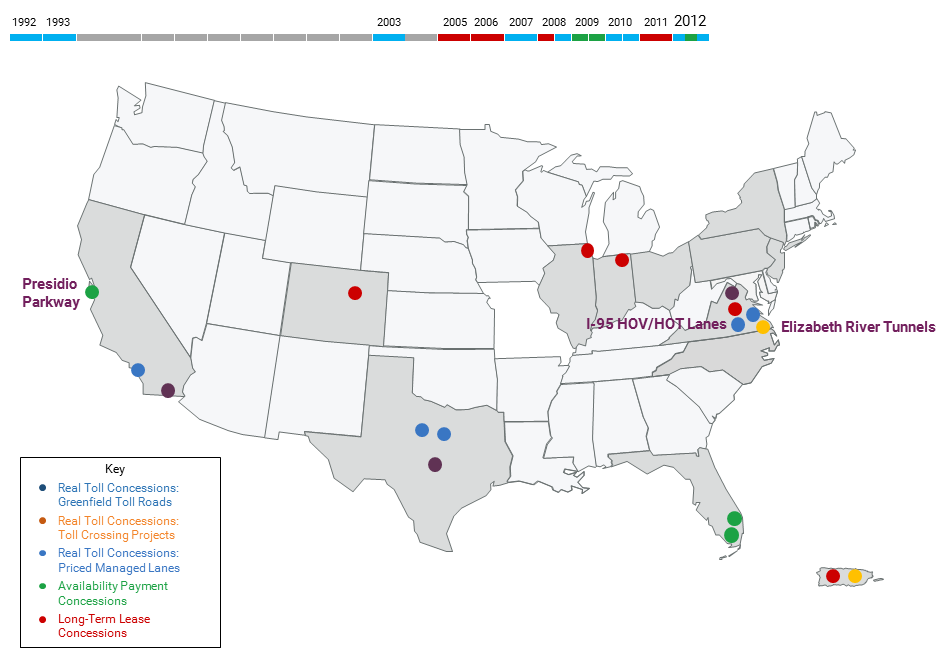
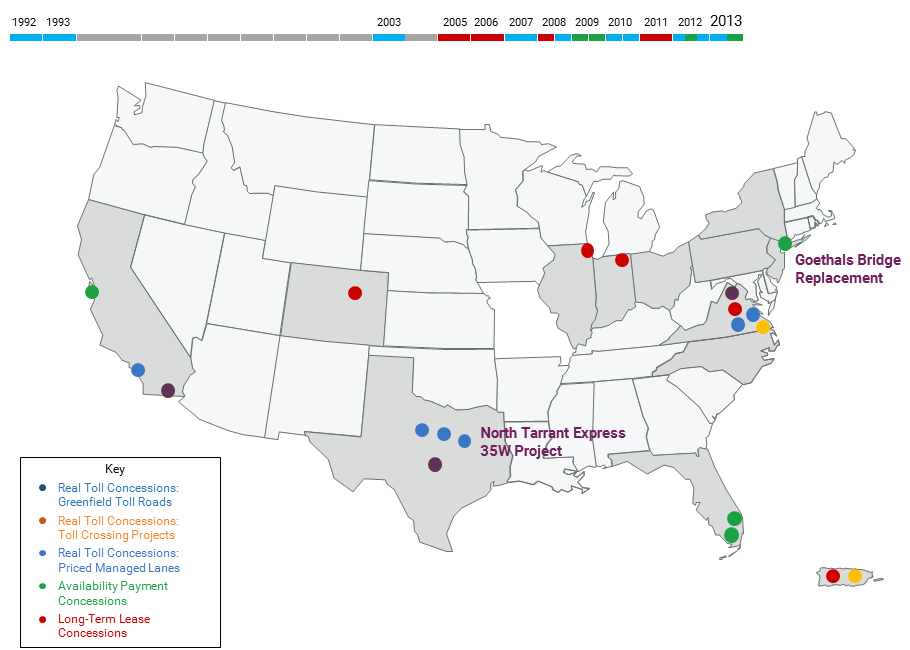
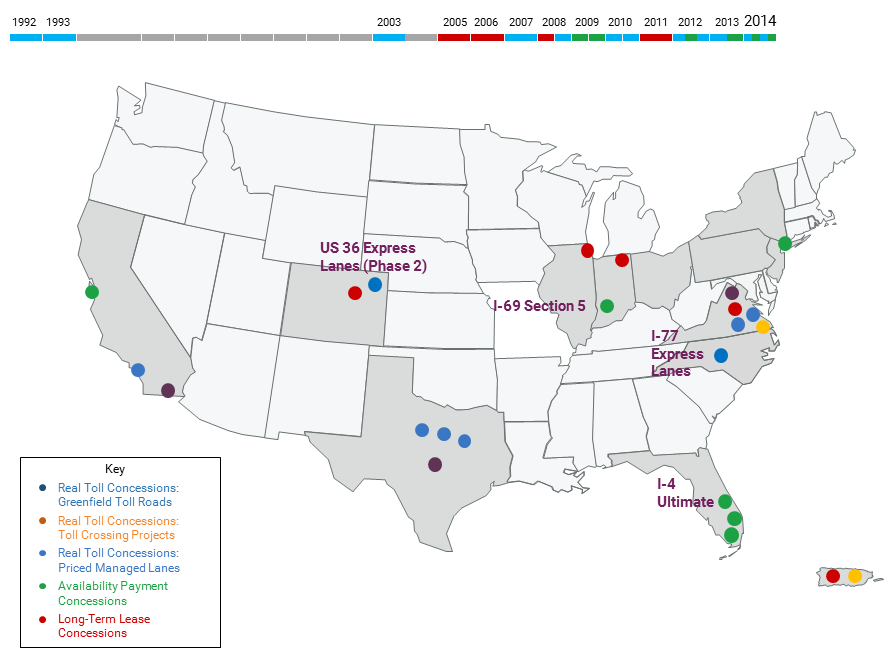
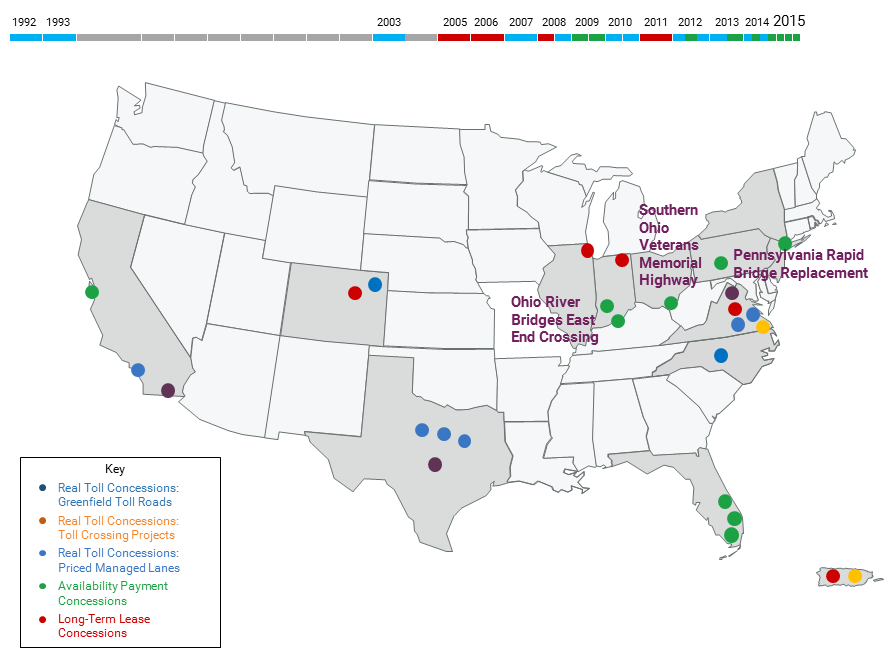
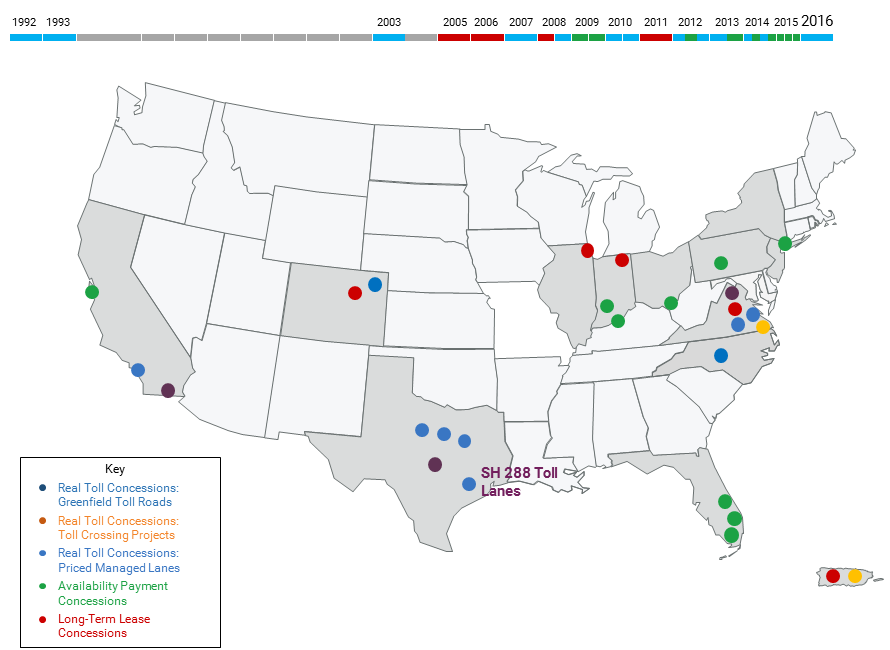
Evolution of the P3 Market (Chapter 4)
View
larger version of map
View
larger version of map
View
larger version of map
View
larger version of map
View
larger version of map

View
larger version of map

View
larger version of map

View
larger version of map

View
larger version of map

View
larger version of map

View
larger version of map
View
larger version of map
View
larger version of map
View
larger version of map
View
larger version of map
View
larger version of map
View
larger version of map
View
larger version of map
View
larger version of map
View
larger version of map
View
larger version of map
View
larger version of map
View
larger version of map
View
larger version of map
View
larger version of map
View
larger version of map
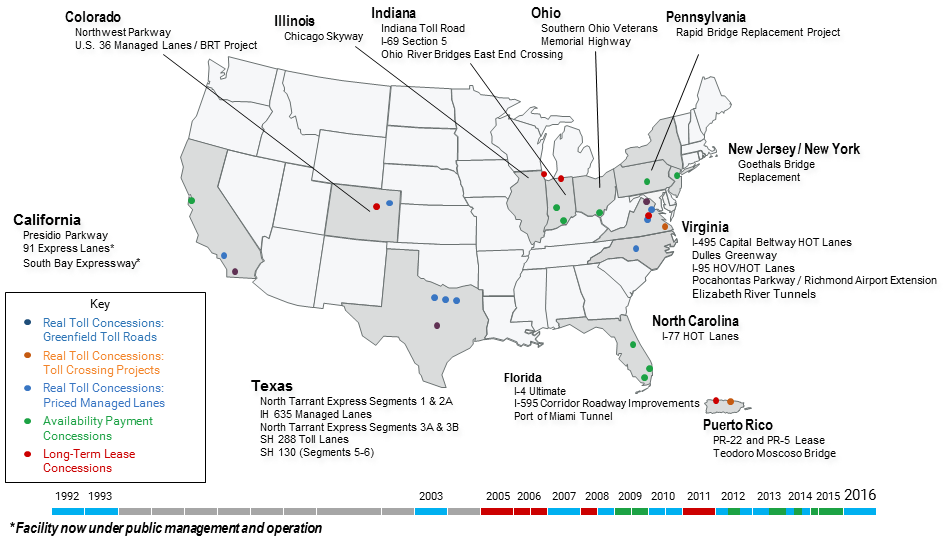
P3 Concessions in the U.S. by Type
View
larger version of map
Questions?
Submit a question using the chat box
U.S. P3 Highway Concessions
- 14 Real Toll Concessions
- 3 Greenfield Toll Roads
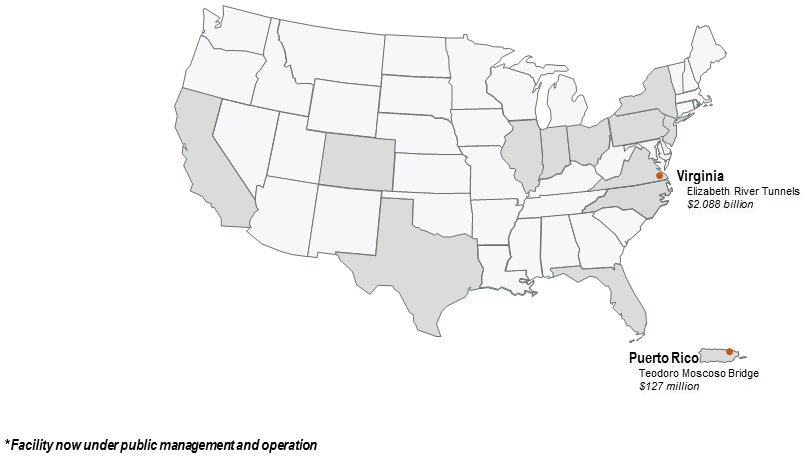
- 2 Fixed Crossings
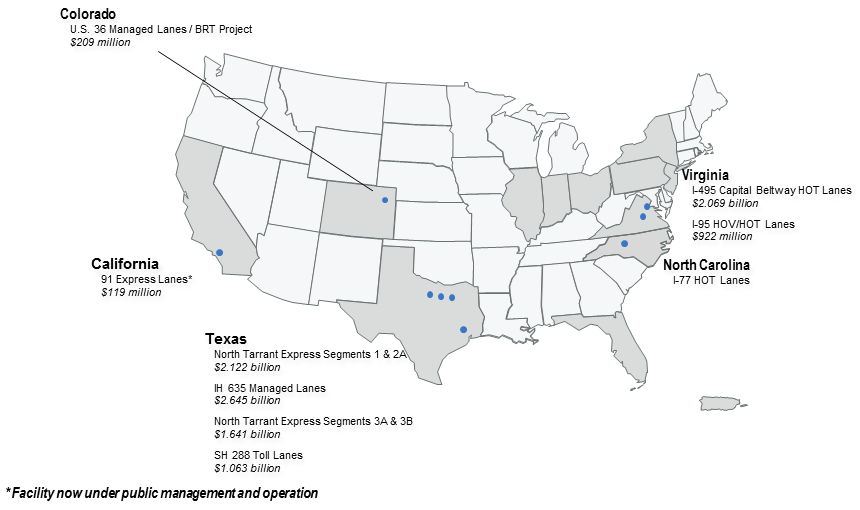
- 9 Priced Managed Lanes
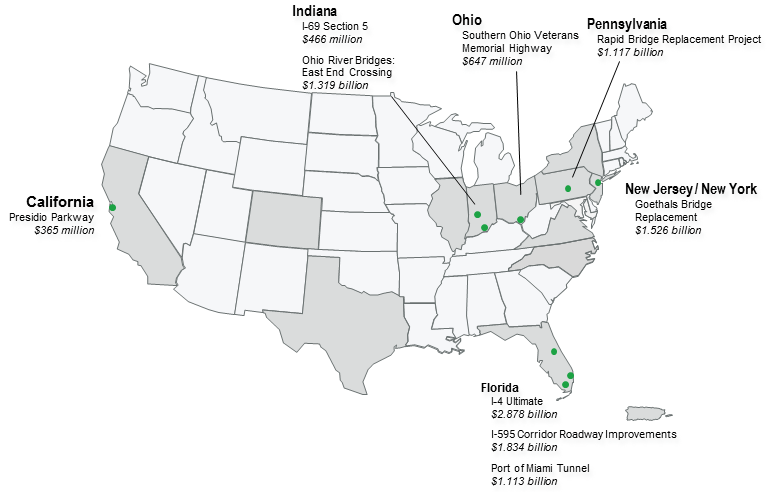
- 9 Availability Payment Concessions
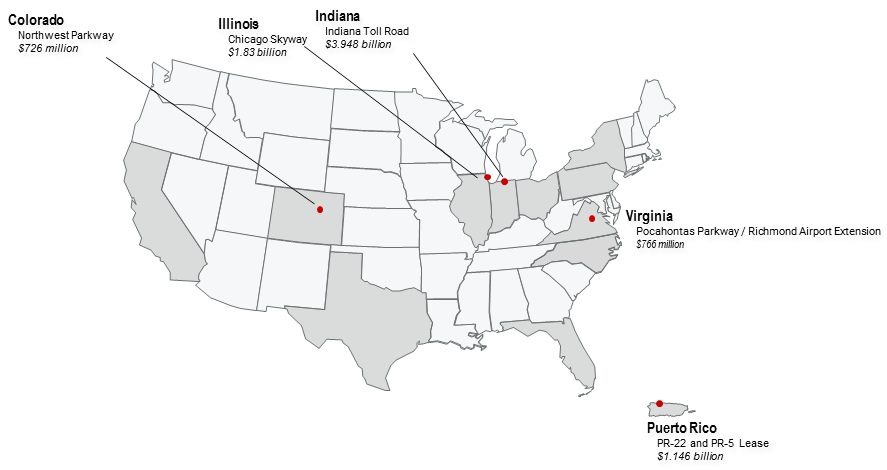
- 5 Long-term Lease Concessions
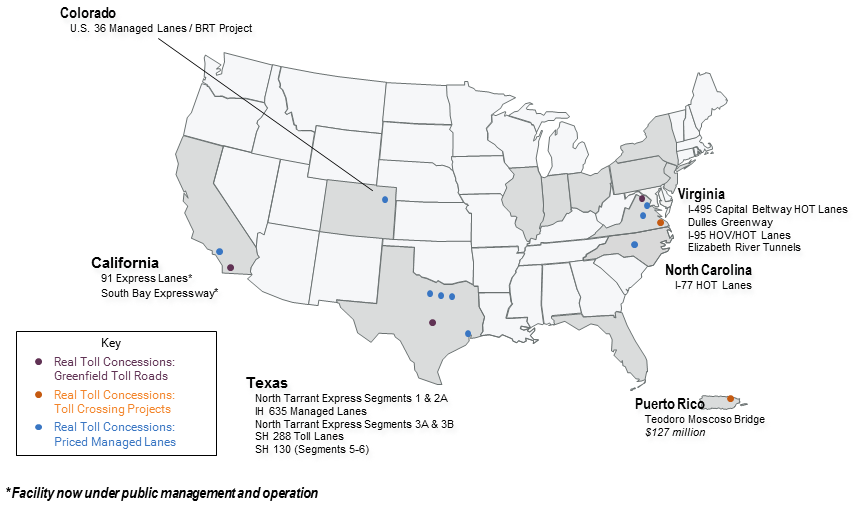
Real Toll Concessions in the U.S.
View
larger version of map
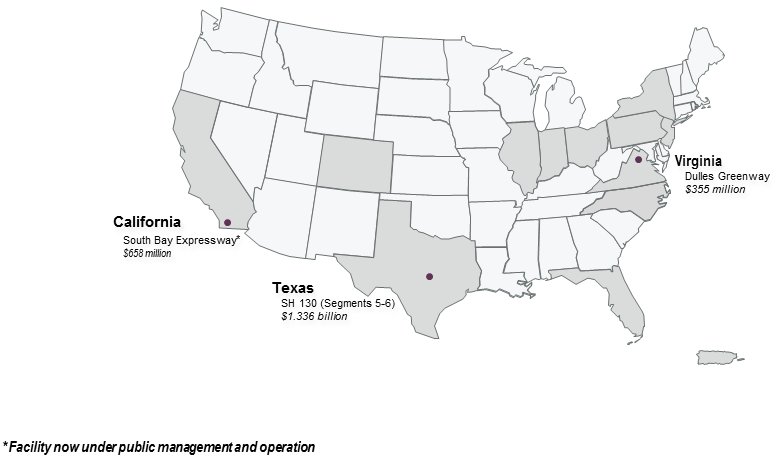
Greenfield Toll Road Concessions
View
larger version of map
Fixed Crossing Real Toll Concessions
View
larger version of map
Managed Lane Toll Concessions
View
larger version of map
Availability Payment Concessions
View
larger version of map
Long-term Lease Concessions
View
larger version of map
Questions?
Submit a question using the chat box
Financing P3 Concessions (Chapter 4 contd.)
Financing P3 Concessions
- Debt
- Commercial bank debt
- TIFIA credit program introduced in 1998
- PABs introduced in 2005
- Equity
- Public sector grants
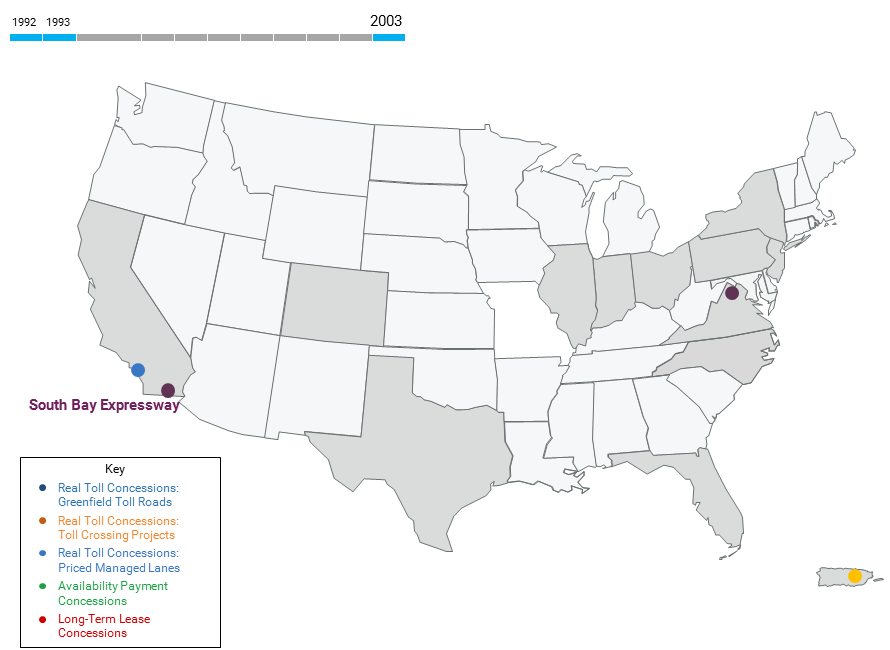
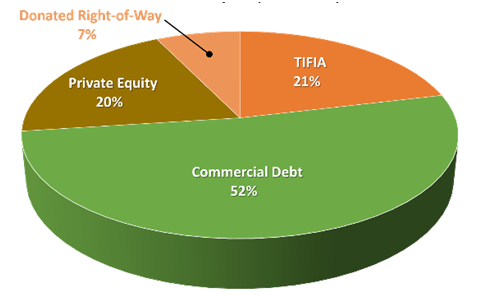
Financing Real Toll Concessions
South Bay Expressway, 2003
$658 million
- Commercial Debt - 52%
- TIFIA - 21%
- Donated Right-of-Way - 7%
- Private Equity - 20%
First TIFIA loan to a P3 project
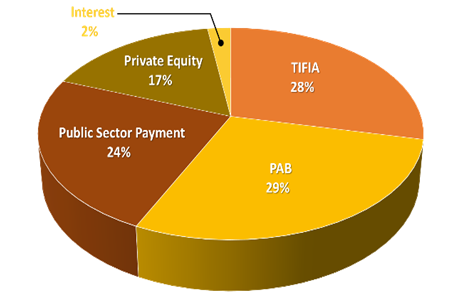
Financing Real Toll Concessions
I-495 Capital Beltway HOT Lanes, 2007
$2.069 billion
- Public Sector Payment - 24%
- PAB - 29%
- TIFIA - 28%
- Interest - 2%
- Private Equity - 17%
- Public Sector Payment - 24%
First P3 project to use PABs
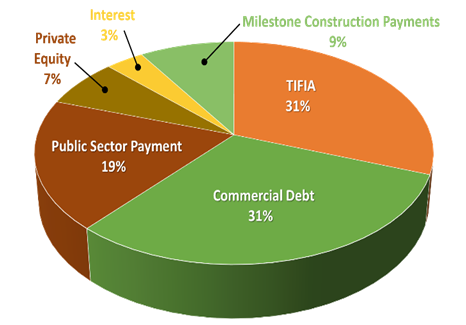
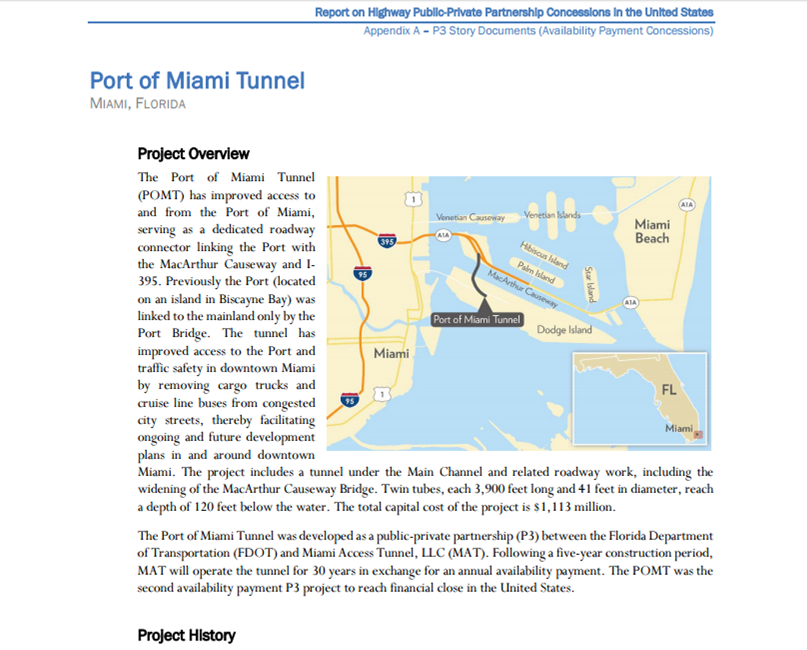
Financing Availability Payment Concessions
Port of Miami Tunnel, 2009
$1.113 billion
- Public Sector Payment - 19%
- Commercial Debt - 31%
- TIFIA - 31%
- Milestone Construction Payments - 9%
- Interest - 3%
- Private Equity - 7%
Project was "Federalized" in order to use TIFIA financing
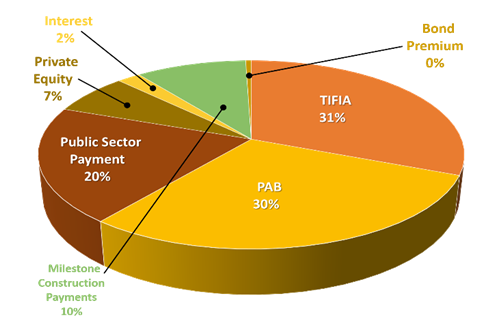
Financing Availability Payment Concessions
Goethals Bridge Replacement, 2013
$1.526 billion
- Public Sector Payment - 20%
- PAB - 30%
- TIFIA - 31%
- Bond Premium - 0%
- Milestone Construction Payments - 10%
- Interest - 2%
- Private Equity - 7%
First availability payment financing to use TIFIA and PABs
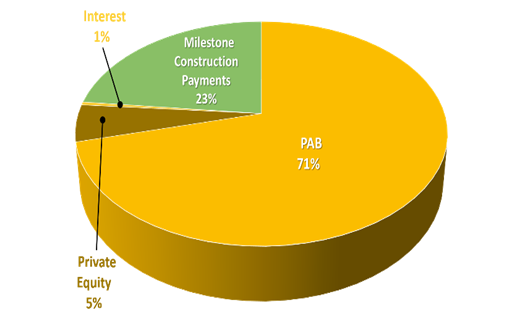
Financing Availability Payment Concessions
PA Rapid Bridge Replacement Program, 2015
$1.117 billion
- PAB - 71%
- Milestone Construction Payments - 23%
- Interest - 1%
- Private Equity - 5%
$721 million PAB - the largest PAB issue to date in the U.S.
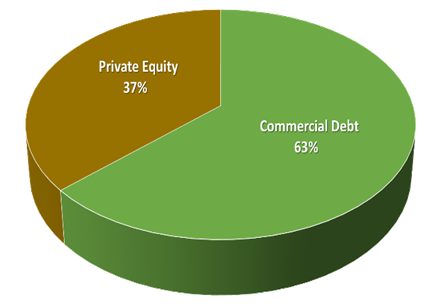
Financing Long-Term Lease Concessions
Northwest Parkway, 2008
$726 million
Private Equity - 37%
Commercial Debt - 63%
Typical long-term lease financing package
Questions?
Submit a question using the chat box
Closing
Highway P3 Project Pipeline
- Transform 66 - Outside the Beltway, VA - $2.5 to 4.0 billion
real toll
- I-55 Managed Lanes, IL - $424 million real toll
- I-70 East Viaduct, CO - $1 billion availability payment
- Hampton Roads Bridge Tunnel Crossing, VA - $6 billion possible
P3
Related P3 Project Information
FHWA P3 Toolkit: https://www.fhwa.dot.gov/ipd/p3/toolkit/
| Fact Sheets |
- Ten concise single-sheet discussions of key P3 concepts
for a non-technical audience
|
| Primers |
- P3 Concessions for Highway Projects
- Risk Assessment
- Value for Money
- Financial Structuring and Assessment
- Establishing a P3 Program
|
| Guides |
- How FHWA Reviews P3s
- Model Toll Concession Contracts
- Model Availability Payment Contracts
- P3 Project Financing
- Risk Assessment
- Value for Money
- Benefit-Cost Analysis
|
| Discussion Papers |
- Revenue Risk Sharing
- Performance Requirements for Design and Construction
in P3s
|
| Analytical Tools |
|
| Informational Reports |
- Successful Practices for P3s
- Highway P3 Projects in the U.S
|
FHWA P3 Training
Introductory
- Introduction to P3s
- Overview
- Project Development
- Procurement
- Risk Assessment
- Value for Money
- Project Financing
- Successful P3 Practices and Model Contracts
- Successful Practices Over Project Life Cycle
- Model Toll Concession Contracts
- Model Availability Payment Contracts
Advanced Analysis
- P3 Project Financing
- P3 Structuring
- Finance Viability
- Financial Models
- Risk Assessments
- Risk Identification
- Risk Analysis and Valuation
- Risk Allocation
- Value for Money
- Public Sector Comparator (PSC)
- P3 Option
- Evaluation
- P3 Benefit-Cost Evaluation
- Estimating P3 Efficiency Impacts
- Estimating Public Benefits
Contact Information
Benjamin Perez
Principal Consultant
WSP |
Parsons Brinckerhoff
(212) 613-8804
perez@pbworld.com
Mark Sullivan
Director
FHWA Center for Innovative
Finance Support
(202) 366-5785
Mark.Sullivan@dot.gov
Website: https://www.fhwa.dot.gov/ipd/p3/
Patrick DeCorla-Souza
P3 Program Manager
USDOT Build America Bureau
& FHWA Center for Innovative
Finance Support
(202) 366-4076
Patrick.DeCorla-Souza@dot.gov
Website: https://www.fhwa.dot.gov/ipd/p3/


