


Patrick DeCorla-Souza, Tolling and Pricing Program Manager, FHWA
Lee Munnich, Humphrey Institute, University of Minnesota
Kenneth Buckeye, Minnesota Department of Transportation
John Doan, SRF Consulting
Center for Innovative Finance Support
Federal Highway Administration
Eleventh Part of a Webinar Series on Overcoming the Challenges of Congestion Pricing.
Audio:
Presentations by:
Audience Q&A: addressed after each presentation, please type your questions into the chat area on the right side of the screen
Closed captioning was available at: http://www.fedrcc.us//Enter.aspx?EventID=1905783&CustomerID=321
Upcoming Webinars:
Visit https://ops.fhwa.dot.gov/congestionpricing/webinars/index.htm
Recordings and Materials from Previous Webinars: https://www.fhwa.dot.gov/ipd/tolling_and_pricing/resources/webinars/congestion_pricing_2011.aspx
Allen Greenberg
FHWA Office of Operations
February 23, 2012
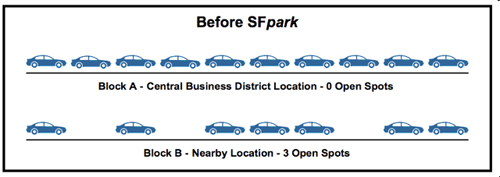
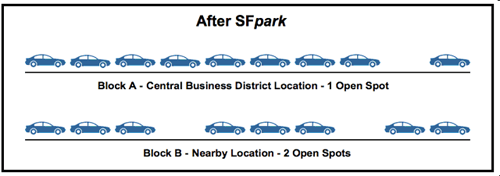
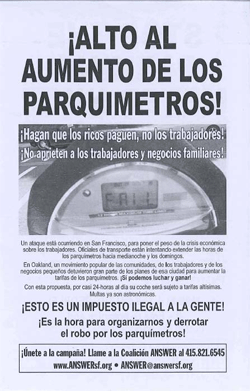
Parking costs are typically hidden from drivers, who therefore see few if any opportunities to save on such costs.
Subsidized and hidden parking costs lead to increased driving, more vehicle ownership, and substantially higher housing costs.
Eliminate parking requirements, enabled by pricing on-street parking (differently for visitors and residents) to ensure appropriate availability, thereby eradicating the "parking spillover" rationale for such requirements.
Enact state laws or local ordinances to require employers who choose to subsidize employee car parking to offer a similar "cash out" subsidy to employees using alternative transportation.
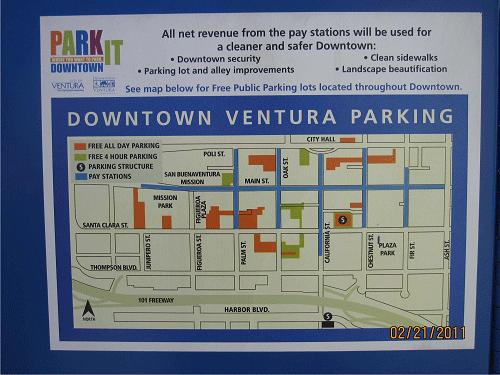
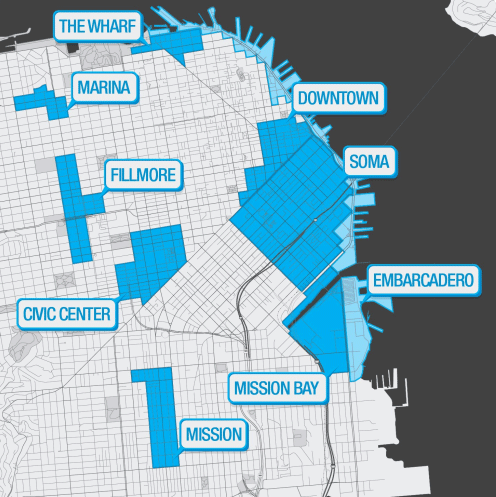
 Part 2: The High Cost of Free Parking
Donald Shoup
| Year | City | Share of traffic cruising (percent) | Average search time (minutes |
|---|---|---|---|
| 1927 | Detroit |
19% | |
| 1927 | Detroit | 34% | |
| 1934 | Washington | 8.0 | |
| 1962 | New Haven | 17% | |
| 1965 | London | 6.1 | |
| 1966 | London | 3.5 | |
| 1966 | London | 3.6 | |
| 1977 | Freiburg | 74% | 6.0 |
| 1984 | Jerusalem | 9.0 | |
| 1985 | Cambridge | 30% | 11.5 |
| 1993 | Cape Town | 12.2 | |
| 1993 | New York | 8% | 7.9 |
| 1993 | New York | 10.2 | |
| 1993 | New York | 13.9 | |
| 1997 | San Francisco | 6.5 | |
| 2001 | Sydney | 6.5 | |
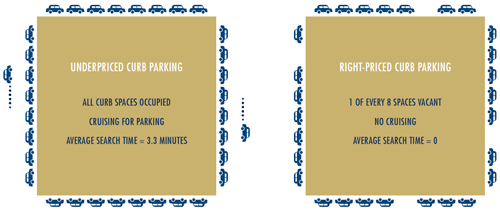
| 2005 | Los Angeles | 68% | 3.3 |
| 2007 | New York | 28% | |
| 2007 | New York | 45% | |
| 2008 | New York | 3.8 | |
| 2011 | Barcelona | 18% | |
| Average | 34 | 7.5 |
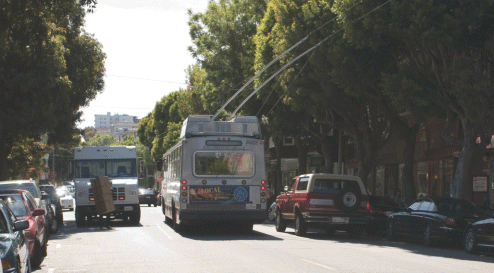
Researchers interviewed drivers who were stopped at traffic lights.
 Some areas host large, well-publicized events that greatly increase the demand for parking.
"As our case is new, so must we think anew, and act anew. "
- Abraham Lincoln -
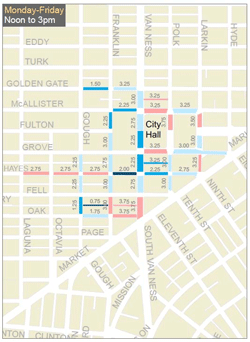
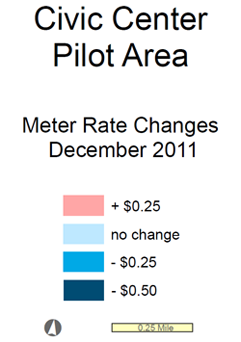
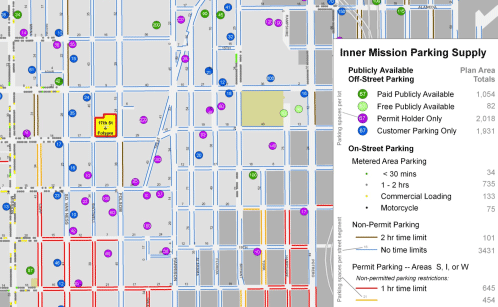
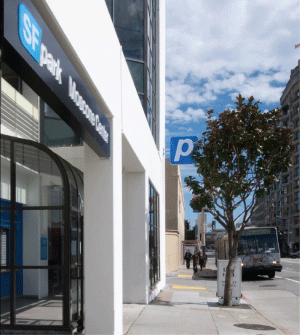
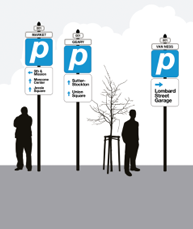
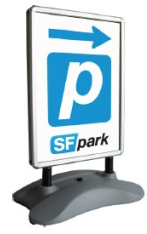
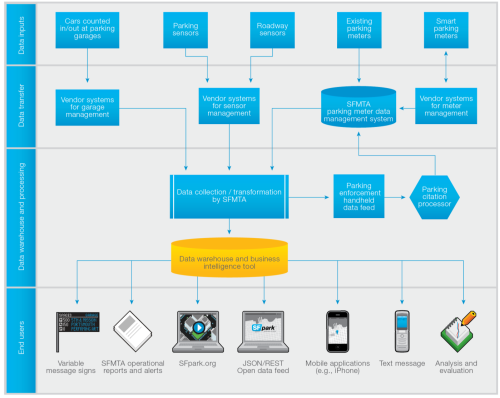
Jay Primus
![]()
![]()

| 1st rate change | 2nd rate change | 3rd rate change | 4th rate change | |
|---|---|---|---|---|
| Up $0.25/hr | 26% | 25% | 27% | 26% |
| No change | 42% | 37% | 38% | 39% |
| Down $0.25/hr | 28% | 30% | 29% | 30% |
| Down $0.50/hr | 4% | 7% | 6% | 5% |

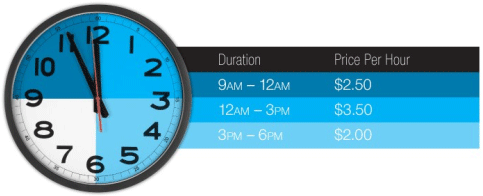
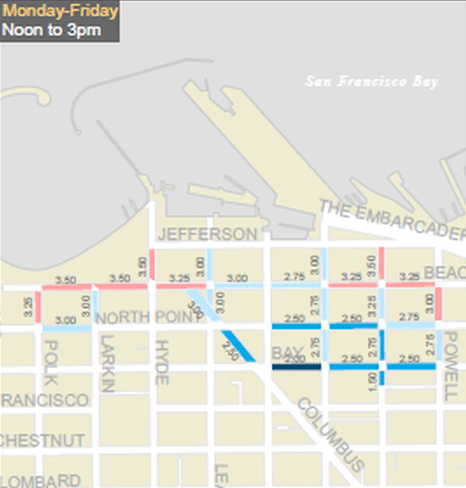
Through Spring 2012
Spring through late 2012
Jay Primus
jay.primus@sfmta.com
SFMTA
by
Damon Harvey, Actg. Citywide Program Manager
Soumya Dey, P.E., Deputy Associate Director
Webinar on Best Practices in Parking Pricing
February 23, 2012
Performance parking is a curbside management strategy DDOT began in March 2008 in the Ballpark District of Ward 6.
Performance parking works by adjusting the rates and/or the time restrictions on metered blocks while protecting the parking supply on surrounding residential and mixed used corridors through increased residential parking enforcement.
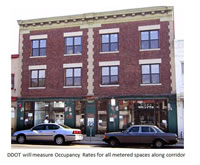
In 2011, DDOT and COG enhanced the data collection methodology and approach by generating per block occupancy and turnover rates based on actual manual counts instead of mathematical formulas measuring curbside footage. The purpose of this data collection effort was to determine the impact of performance parking in the vicinity of the Washington Nationals Ballpark in southeast and Near Southeast DC.
| DISTRICT OF COLUMBIA | MARYLAND | VIRGINIA | OTHER STATES | ||||||
|---|---|---|---|---|---|---|---|---|---|
TOTAL CURBSIDE OCCUPANCY BY ZONE |
TURNOVER RATE BY STATE PER ZONE |
TOTAL CURBSIDE OCCUPANCY BY ZONE |
TURNOVER RATE BY STATE PER ZONE |
TOTAL CURBSIDE OCCUPANCY BY ZONE |
TURNOVER RATE BY STATE PER ZONE |
TOTAL CURBSIDE OCCUPANCY BY ZONE |
TURNOVER RATE BY STATE PER ZONE |
||
| AWAY GAMES | ZONE A | 1,553 | 31% | 590 | 12% | 387 | 8% | 2,482 | 50% |
| ZONE B | 811 | 32% | 316 | 13% | 309 | 12% | 1,066 | 43% | |
| ZONE C | 2,321 | 45% | 412 | 8% | 559 | 11% | 1,897 | 37% | |
| TOTAL | 4,685 | 37% | 1,318 | 10% | 1,255 | 10% | 5,445 | 43% | |
| HOME GAMES | ZONE A | 1,917 | 34% | 714 | 12% | 479 | 8% | 2,610 | 46% |
| ZONE B | 1,078 | 24% | 778 | 17% | 796 | 17% | 1,931 | 42% | |
| ZONE C | 3,135 | 44% | 568 | 8% | 657 | 9% | 2,728 | 38% | |
| TOTAL OR AVG. | 6,130 | 35% | 2,060 | 12% | 1,932 | 11% | 7,269 | 42% | |
| ZONE | HUNDRED BLOCK | STREET NAME | PARKING SPACES PER BLOCK SEGMENT | AVERAGE OCCUPANCY | MAXIMUM OCCUPANCY | TURNOVER RATE | ||
|---|---|---|---|---|---|---|---|---|
NUMBER OF VEHICLES |
OCCUPANCY PERCENTAGE |
NUMBER OF VEHICLES |
OCCUPANCY PERCENTAGE |
|||||
| A | 900 | 3 | 10 | 333% | 16 | 533% | 1:27 | |
| A | 100 | M Street, SW | 3 | 6 | 200% | 12 | 400% | 1:20 |
| A | 1600 | 6 | 16 | 267% | 19 | 317% | 1:58 | |
| A | 1100 | 8 | 11 | 138% | 21 | 263% | 2:12 | |
| B | 900 | Half Street, SE | 5 | 7 | 140% | 11 | 220% | 0:46 |
| B | 1000 | 24 | 14 | 58% | 67 | 279% | 1:56 | |
| B | 1000 | 3 | 4 | 133% | 6 | 200% | 2:01 | |
| B | 1200 | 22 | 19 | 86% | 46 | 209% | 2:13 | |
| A | UNIT | 8 | 8 | 100% | 13 | 163% | 1:25 | |
| A | 1500 | Half Street, SW | 22 | 22 | 100% | 34 | 155% | 0:08 |
Data collectors used two or three private vehicles outfitted with LPR systems traveling the same routes continuously for eight hour intervals for three consecutive days, including a Saturday or Sunday This consists of a digital camera, a laptop computer, a video conversion unit (to convert images from the camera into a format acceptable for computer processing and a global positioning system (GPS) unit.
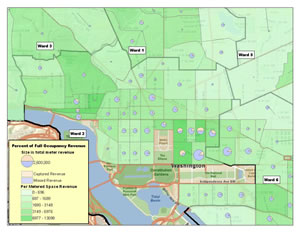
2011 Curbside Occupancy Rate
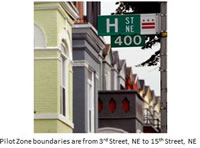
There are 44 blocks within the Columbia Heights pilot zone
There are 44 blocks within the Columbia Heights pilot zone
The average turnover in the Columbia Heights pilot zone is 2:47
| D.C. | Maryland | Virginia | Other or unknown | ||||
|---|---|---|---|---|---|---|---|
| 2005 | 42% | 785 | 16% | 406 | 8% | 1635 | 34% |
These MSM blocks above 85% are:
The remaining nine blocks with occupancy rates at or above 85% are:
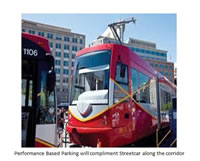
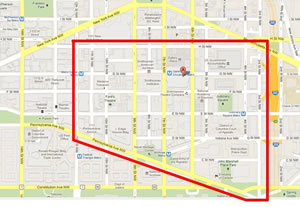
Beginning in March 2012 DDOT will begin performance based parking on all meters along the H Street, NE corridor from 3rd Street, NE to 15th Street, NE/Benning Road, NE. Performance based parking is a curbside management strategy DDOT has used since March 2008 with the introduction of the first pilot zone in the Ballpark District of Ward 6.
DDOT is working with Council member Tommy Wells' office to have a public kick off meeting during the first two weeks of February. At this event the department will provide an overview of performance based parking and modifications coming to the corridor.
After the kick off meeting DDOT will provide community stakeholders with approximately 30 days to review and comment on the plan before implementation.
 DDOT will begin variable rate meter operations along the H Street, NE corridor on all 36 multi space meters (MSMs) as well as Resident Only RPP on blocks within the RPP database as follows:
 DDOT's networked MSM's along H Street, NE have the capacity for time of day or hourly variable rate meter operations. The idea of time of day meter operations is not new to the District performance parking zones.
In March 2009, when the department began performance parking operations in Columbia Heights, DDOT implemented a similar strategy. The original meter programming in Columbia Heights provided for two hour time limits in the mornings and three hour time limits in the afternoons and evenings at the same rate.
In July of this year DDOT shifted from time of day meter operations to hourly variable rates on all performance parking meters in Columbia Heights and extended the meter hours of operations until 10pm. DDOT will use the same phased implementation approach along the H Street, NE corridor at the following rates: 7am to 6:30pm: $.75 per hour with a four hour limit 6:30pm to 10pm: $2.00 per hour with no time limit
 The occupancy rate target for metered curbside parking along the H Street, NE corridor will be between 80% and 90%; just as in the Ward 6 Ballpark District pilot. An occupancy rate set between these percentages will mean that approximately one or two spaces will be available out of every ten MSM spaces.
An occupancy rate target of 80% to 90% is standard in other jurisdictions implementing congestion pricing programs but it is by no means perfect. For example, the city of Seattle has a target occupancy rate of 60% in its zones and they have a very successful program. Seattle's target may be too low for the District, however after a year of analysis with regular updates using meter revenues the department will have a clear idea whether the target needs to be adjusted.
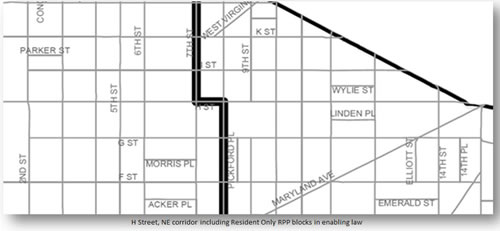
The H Street, NE performance based parking enabling law limits the Resident Only RPP and visitor passes to one block on each side of the corridor as follows: North: I Street, NE East: 15th Street, NE/Benning Road, NE South: G Street, NE West: 3rd Street, NE.
At the outset of pilot zone operations DDOT will provide each household on existing RPP blocks within one block of H Street, with Resident Only RPP enforcement as well as one visitor pass per household.
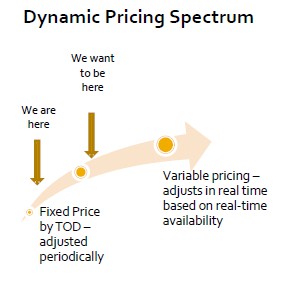
Dynamic Pricing Spectrum
| Pricing Strategy | Advantages | Disadvantages |
|---|---|---|
| Fixed Price by TOD | Pricing structure easy to understand for consumers Easy to communicate |
"Average" availability will be 1 space per block face Pricing strategy based on historical data |
| Purely "dynamic" | Price based on real-time availability - better impact on congestion? | Difficult to communicate for "open system" in an urban environment Sophisticated data collection, analysis and algorithm |
Similarities between fixed time vs. adaptive controllers
Is the additional expense and effort justified by the ability of real-time pricing to affect congestion?
Capture rate = Max. Revenue/Actual Revenue
Capture rate can be available in real-time with networked assets
Capture rate = f (demand, meter uptime, percentage paid legal)
Capture Rate = f (system uptime, paid legal, occupancy)
| System Uptime | Occupancy | Paid Legal |
|---|---|---|
| Available for networked assets | Use capture rate as surrogate Sampled detector data |
Calibrate using historical data |
Analogy - Speed, travel time, congestion on roadways based on sample probe data
How accurate do we need to be?
Accuracy requirement higher for real-time traveler information than dynamic pricing algorithm? Branding & Credibility
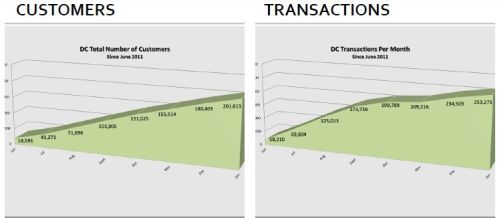
Customers
Transactions
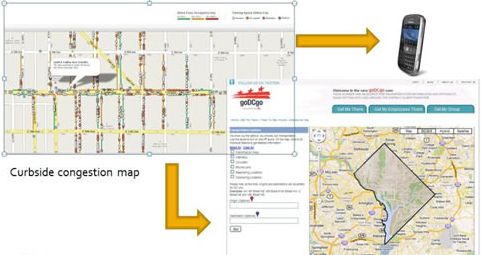
Pilot area exemplifies Multimodal curbside demand and competition.
Pilot will provide real time rates from through street sensors and real time traveler information
Pilot has: 160 block faces 1,600 metered spaces 30 Loading zones 10 Commuter Bus Drop Off and Pick Up Locations
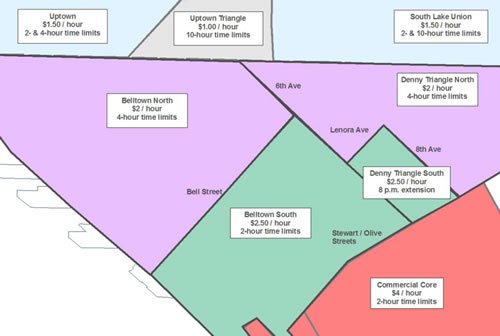
 Part 5: Seattle's Performance-Based Parking Program
SDOT - Seattle Department of Transportation
03/08/2012
This presentation will cover:
| Est. on-street spaces citywide | 500,000 |
| Paid spaces | 13,250 |
| RPZ spaces | 18,000 |
| Time-limit spaces | 11,500 |
| Meters (single space) | 100 |
| Restricted Parking Zones | 31 zones |
| Annual RPZ permits | 21,500 |
| Annual parking citations | 500,000 |
| Police - Parking Enforcement Officers | 109 (FTE) |
Data Collection
Use highest three hours of daytime occupancy from parking study
Does not include evening conditions - when occupancy is well over 100% in some areas
| Example Area | |
|---|---|
| 8 AM - 9 AM | 35% |
| 9 AM - 10 PM | 45% |
| 10 AM - 11 AM | 58% |
| 11 AM - 12 PM | 63% |
| 12 PM - 1 PM | 72% |
| 1 PM - 2 PM | 78% |
| 2 PM - 3 PM | 67% |
| 3 PM - 4 PM | 73% |
| 4 PM - 5 PM | 73% |
| 5 PM - 6 PM | 90% |
| 6 PM - 7 PM | 106% |
| 7 PM - 8 PM | 120% |
| If Area Peak Occupancy is below Target Occupancy: | If Area Peak Occupancy is within Target Occupancy (65% - 90%): | If Area Peak Occupancy is above Target Occupancy: |
| Look at rate decreases or parking max time changes | Keep rate and operating system as is | Look at rate increases or parking max time changes |
| Rate Increase (4 areas) | More availability at peak times |
| Rate Stayed Same (7 areas) | Results mixed, with minor fluctuations |
| Rate Decrease (11 areas) | Most areas saw no dramatic increase in occupancy |
| Area | Spaces | 2010 Peak Occupancy | 2011 Rate Change | 2011 Rate | 2011 Peak Occupancy | Occupancy Changes |
|---|---|---|---|---|---|---|
| Ballard | 320 | 68% | $0.50 Decrease | $1.50 | 49% | Decrease |
| Commercial Core | 1,650 | 97% | $1.50 Increase | $4.00 | 79% | Decrease |
| Pike-Pine | 700 | 85% | Same | $2.00 | 74% | Decrease |
| SLU - 10 hr | 1,100 | 73% | Same | $1.25 | 84% | Increase |
| University District | 700 | 64% | $0.50 Decrease | $1.50 | 63% | Same |
| Fremont | 90 | 80% | Same | $1.50 | 77% | Slight decrease |