Patrick DeCorla-Souza, Tolling and Pricing Program Manager, FHWA
Lee Munnich, Humphrey Institute, University of Minnesota
Kenneth Buckeye, Minnesota Department of Transportation
John Doan, SRF Consulting
Center for Innovative Finance Support
Federal Highway Administration
Seventeenth Part of a Webinar Series on Overcoming the Challenges
of Congestion Pricing.
Session 17: Bikesharing Research and Programs - Presentations
Audio:
Via computer - No action needed
Via telephone - Mute computer speakers, call 1-866-863-9293, passcode 12709537
Presentations by:
Audience Q&A - addressed after each presentation, please type your questions into the chat area on the right side of the screen
Closed captioning is available at:
http://www.fedrcc.us/Enter.aspx?EventID=2277487&CustomerID=321
Recordings and Materials from Previous Webinars:
https://www.fhwa.dot.gov/ipd/tolling_and_pricing/resources/webinars/congestion_pricing_2011.aspx
Part A: Public Bikesharing in the U.S., Canada, & Mexico - Industry Developments & User Understanding
Project Highlights
Susan A. Shaheen, Ph.D.
Transportation Sustainability Research Center
University of California, Berkeley
FHWA Bikesharing Webinar
April 2, 2014
Overview
- Bikesharing defined
- Worldwide and US bikesharing numbers
- Study background
- Carsharing in North America by the numbers
- Operator understanding
- Impacts
- Acknowledgements
What is Public Bikesharing?
- Bikesharing organizations maintain fleets of bicycles in a network of locations
- Stations typically unattended, concentrated in urban settings and provide a variety of pickup and dropoff locations
- Allows individuals to access shared bicycles on an as-needed basis
- Subscriptions offered in short-term (1-7 Day) and long-term (30-365 Day) increments
- Most programs cover the cost of bicycle maintenance, storage, and parking
Worldwide & US Bikesharing: March 2014
- 714 cities with IT-based operating systems
- 740,000 bikes
- 35,000 stations
- 10 new city programs since January 2014
- US: 41 cities & 4 universities with IT-based systems
- 19,600 bikes
- 2,000 stations
Source: Russell Meddin, 2014
Research Methodology
- Ongoing literature review
- 23 operator interviews in the US, Canada, & Mexico
- IT-based bikesharing program growth tracking (including planned programs)
- Surveys with members of 5 public bikesharing systems in Spring/Summer 2013
- 2013 operational data analysis from Nice Ride MN
History & Growth of Bikesharing
- 1965. Amsterdam launches first generation "White Bike" bikesharing program.
- 1991. Coin-deposit systems are launched in Farsø and Grenå, Denmark bringing in bikesharing's second generation.
- 1998. Rennes, France launches first IT-based system for public access marking the third generation of equipment.
- 2005. Lyon, France launches the first large-scale municipal third generation system called Vélo'v.
- 2007. Paris launches Vélib' ushering in the bikesharing boom.
- 2009. Public Bike System Company (PBSC) is formed in Montreal and North America's first major IT-based bikesharing program is launched.
Recent Developments in Bikesharing
- Occasional Members
- In 2012, PBSC introduced a new membership type known as the Occasional Member
- Membership Reciprocity
- B-cycle's B-connected campaign
- Community Involvement & Crowd-Sourced Funding
- Online "Suggest-a-Station" platforms enabling additional public input and crowd-funded system expansions
- Equity Issues & Public Policy
- Systems are increasingly looking at how to address social equity in bikesharing
- Helmet Dispensing Options
- Helmet kiosks launched in Boston
- Peer-to-Peer Bikesharing
- The sharing of private bicycles between individuals
- Flexible Docking and Geo-fencing Technologies
- Allows for users to pick-up and drop-off bicycles anywhere within a geographic area
- Self-Rebalancing and Dynamic Pricing
- Pricing mechanisms are used to encourage self-rebalancing of the bikesharing fleet (e.g., Vélib, CapBi, London's Barclay's Cycle Hire)
- Public Bike System Company (PBSC) Bankruptcy
- Following concerns of PBSC's ability to repay its debts, the company filed for bankruptcy protection in January 2014
Timeline of North American Bikesharing Program Launches (2007-2013)
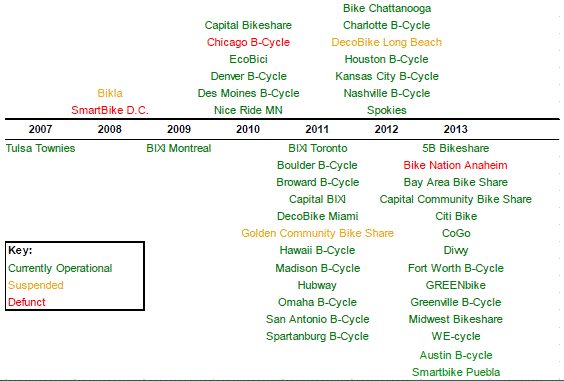
View full-sized graphic
Detailed description of timeline
2007
2008
- Bikla (Suspended)
- SmartBike D.C. (Defunct)
2009
2010
- Capital Bikeshare
- Chicago B-Cycle (Defunct)
- EcoBici
- Denver B-Cycle
- Des Moines B-Cycle
- Nice Ride MN
2011
- BIXI Toronto
- Boulder B-Cycle
- Broward B-Cycle
- Capital BIXI
- DecoBike Miami
- Golden Community Bike Share (Suspended)
- Hawaii B-Cycle
- Madison B-Cycle
- San Antonio B-Cycle
- Spartanburg B-Cycle
2012
- Bike Chattanooga
- Charlotte B-Cycle
- DecoBike Long Beach (Suspended)
- Houston B-Cycle
- Kansas City B-Cycle
- Nashville B-Cycle
- Spokies
2013
- 5B Bikeshare
- Bike Nation Anaheim (Defunct)
- Bay Area Bike Share
- Capital Community Bike Share
- Citi Bike
- CoGo
- Diwy
- Fort Worth B-Cycle
- GREENbike
- Greenville B-Cycle
- Midwest Bikeshare
- WE-Cycle
- Austin B-cycle
- Smartbike Puebla
Bikesharing in North America by the Numbers
| |
United States |
Canada |
Mexico |
North American Total |
| Number of programs |
22 |
4 |
2 |
28 |
| Total Number of users |
1,191,442 |
197,419* |
71,611 |
1,460,472 |
| Number of members |
44,695 |
53,707 |
71,611 |
170,013 |
| Number of casual users, 1-30 Day |
1,146,747 |
143,312 |
0 |
1,290,059 |
| Number of bicycles |
7,549 |
6,115 |
3,680 |
17,344 |
| Number of kiosks |
800 |
492 |
307 |
1,599 |
| Number of docks |
12,955 |
10,506 |
7,487 |
30,948 |
* Note BIXI Montreal had an additional 400 occasional users. Occasional users maintain a key and are billed a 24 hour membership when the key is used.
Shaheen et al., 2014
The Business of Bikesharing
Revenue from Membership & User Fees
| Program |
Percent Revenue from Members |
Percent Revenue from Casual Users |
Other Sources (sponsorship, donations, etc) |
Program 1
Publicly Owned, Contractor Operated |
15% |
44% |
41% |
Program 2
Publicly Owned, Contractor Operated |
33% |
67% |
0% |
Program 3
Non-profit |
16.10% |
48.40% |
35.5% |
Program 4
Non-profit |
3.60% |
54% |
42.4% |
Shaheen et al., 2014
Station Location, Location, Location (n=15)
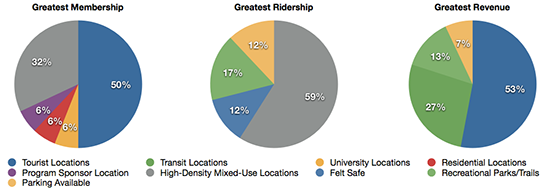
View full size image
Shaheen et al., 2014
Lessons Learned from Operators
To improve public bikesharing, I would...
| Marketing & Outreach |
Operations & Equipment |
System Planning & Scale |
| "Change public perception so that people view bikesharing as "sharing" and not a 'rental'." |
"Develop ways to minimize and ease pre/re-balancing (e.g., pricing signals to users)." |
"Have more docking points to lower the cost of bike redistribution." |
| "Get more people to use public bikesharing." |
"Build awnings to protect kiosks from the elements." |
"Expand the system with more stations and bicycles." |
| "Build stronger partnerships among users, sponsors, and local government." |
"Encourage technological enhancements to further automate public bikesharing." |
"Improve the balance of stations between downtown and residential neighborhoods." |
| "Build stronger relationships between bikesharing programs." |
"Reduce the cost of bikesharing systems." |
"Add wayfinding signs to show where stations are located and what direction to go in to return a bike." |
| |
|
"Enhance accessibility into under-served communities." |
Shaheen et al., 2014
Lessons Learned from Operators
One lesson our program has learned...
| Marketing & Outreach |
Operations & Equipment |
System Planning & Scale |
| "Work with local partners first. " |
"Do not under estimate the importance of the 'casual user' in terms of revenue." |
"Stations placed at the right location will be successful." |
"Funding from local sources enhances community partnerships." |
"Remember that public bikesharing is a commuting option, and people depend on this mode. If we make mistakes, we can really mess up someone's day." |
"Greater density of stations is needed at a program's launch." |
| "Work with municipal public works departments early on." |
"Training our technicians locally to move stations is more cost effective than flying in technicians to do this." |
"Place stations farther apart to enhance geographic coverage, particularly outside the urban core." |
| "Education and outreach among users is important, particularly with respect to user fees after the initial free usage timeframe." |
"Determining the number of users and rides the system can support is important." |
"If you provide a quality service, people will use it." |
| "Remembering that we're selling is a 'culture.'" |
|
|
| "Friendly competition - sharing success stories with other programs can make bikesharing better." |
|
|
Shaheen et al., 2014
Public Bikesharing User Survey Analysis
Member & On-Street Survey Findings
Member Survey: Overview
- Programs surveyed:
- Bixi Montreal - Montreal, Canada
- Bixi Toronto - Toronto, Canada
- Nice Ride MN - Minneapolis/St. Paul, MN
- GreenBike SLC - Salt Lake City, Utah
- EcoBici - Mexico City, Mexico
- Goal of survey:
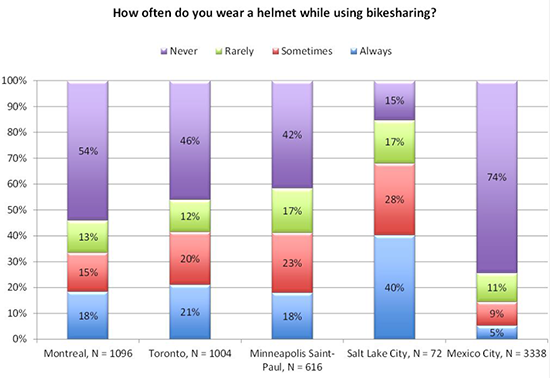
- Better understanding of travel behavior, shopping behavior, modal shift, helmet use and safety, and user demographics
Member Survey: Findings
- Compared to general population bikesharing users tend to be ...
- Wealthier
- More educated
- Younger
- Caucasian
- Male
Shaheen et al., 2014
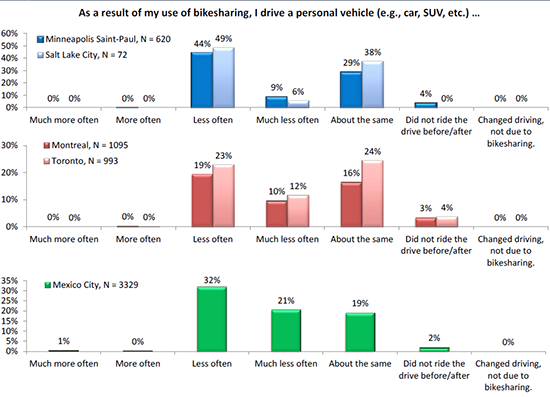
Member Survey: Key Findings
View full size image
Shaheen et al., 2014
Member Survey: Key Findings
 View full size image
Shaheen et al., 2014
On-Street Survey: Overview
- Programs surveyed:
- San Antonio B-cycle - San Antonio, TX
- Hubway - Boston, MA
- GreenBike SLC - Salt Lake City, Utah
- Goal of survey:
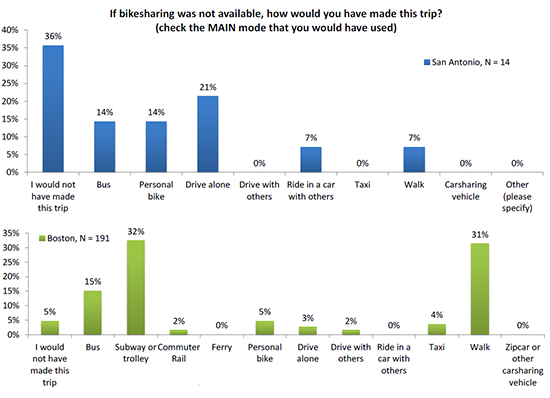
- To better understand the behavior of members and casual users based on data collected immediately after the trip.
On-Street Survey: Key Findings
View full size image.
Shaheen et al., 2014
Conclusion
- Bikesharing is still growing rapidly in North America
- Rebalancing remains a difficult and expensive issue for operators
- Causal users generate the majority of revenue
- Partnerships are key to program success
- Members drive less as a result of bikesharing
- Bikesharing functions as public transit for many commuters
Acknowledgements
- Mineta Transportation Institute (MTI), Caltrans, and US DOT
- Bikesharing operators in North America
- Elliot W. Martin, Ph.D. (co-author)
- Joseph Michael Pogodzinski, Ph.D. (co-author)
- Nelson D. Chan (co-author)
- Adam P. Cohen (co-author)
- Matthew Christensen, TSRC
- Russell Meddin, Philadelphia Bike Share

https://tsrc.berkeley.edu/
Part B: Capital Bikeshare
A Snapshop of
Capital Bikeshare Travel
Darren Buck
Capital Bikeshare Planning,
District Department of Transportation
Washington, DC

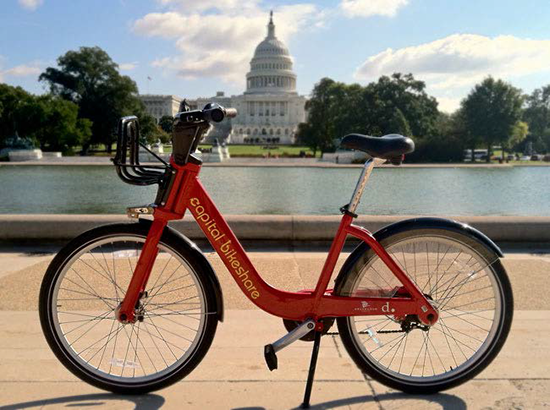
What is Capital Bikeshare?
- A regional bike transit system.
- 3000 bikes at 300+ solar-powered docking stations.
- Launched on September 20th, 2010.
- Designed for relatively short, one-way trips.
- Complements other transport modes.
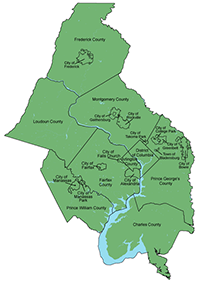
Who is Capital Bikeshare?
- Started with Arlington County, VA RFP/contract
- DC utilized a rider clause within the MPO to replicate contract
- City of Alexandria, VA joined September 2012
- Montgomery County, MD joined September 2013
- Municipal partnership owns and manages Capital Bikeshare
- All partners use the same contractor: Alta Bicycle Share
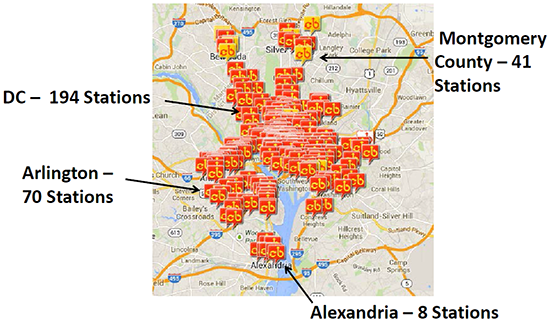
View full size image.
DC Walks and Bikes to Work
- DC bikes to work at over 7 times the national share
- DC bike modeshare rising at over twice national rate from '10 - '12 (32% vs 15%)
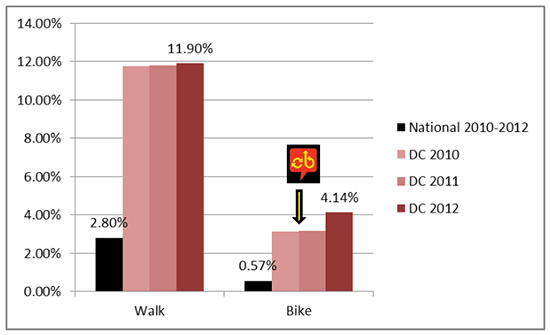
 Capital Bikeshare introduced
Census ACS Means of Transportation to Work, 2010 - 2012. 3-Year National data, individual years for Washington, DC.
Trips (DC only)
- Over 6.2 million total trips systemwide (5.8M DC)
- Aug 2013 - 273,045 trips in DC (8x opening month)
- Estimated 6.2% of all bike trips in DC are by CaBi
Stations (DC only)
- From 90 up to 194 stations (2.2x opening month
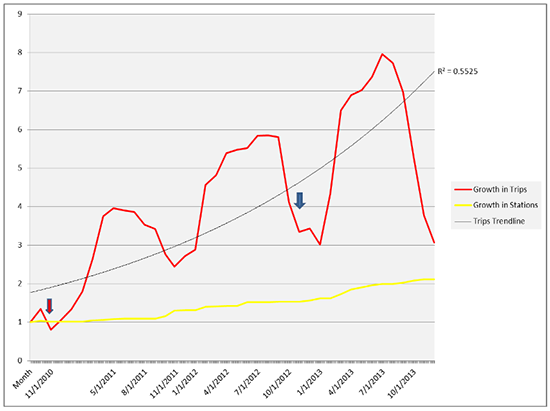
View full size image.
 1-way L Street Cycletrack installed
 2-way 15th Street Cycletrack installed
Source: CaBi Dashboard trip data, Sep 2010 - Jan 2014, internal DDOT records of station deployment
CaBi Share of DC Bicycling
- 2012: 5.2% of observed riders appeared to be riding CaBi bikes
- 2013: 11.5% (didn't count at higher volume bridge/trail points)
- Bikeshare played big role in 2012 ACS bicycling rise (perhaps 50%?)
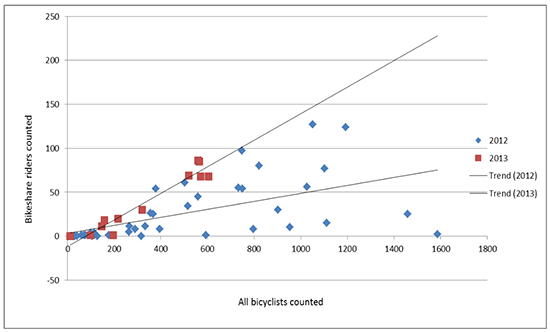
View full size image.
Source: DDOT June 2012 and June 2013 peak period screenline bicyclist counts
Most Rides by Annual Members
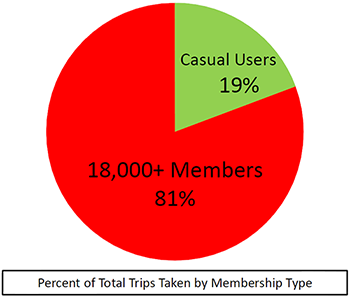
Source: CaBi Dashboard trip data, Sep 2010 - Jan 2014
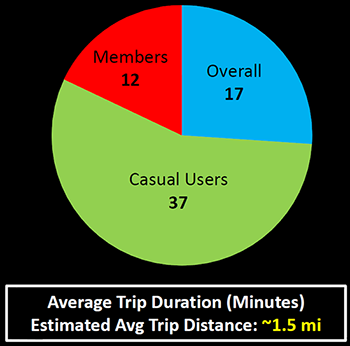
Source: CaBi Dashboard trip data, Sep 2010 - Jan 2014
DC Bikeshare Revenue Breakdown
- Majority of DC's revenue from membership fees of all types
- High proportion of usage fees come from casual users
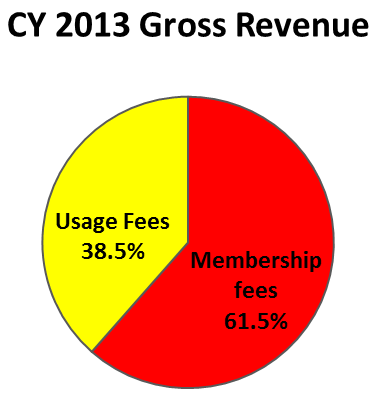
Source: Internal DDOT financial reports
Supplementing Car-Lite Travel
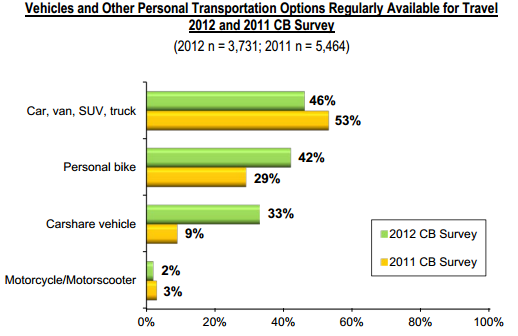
View full size image.
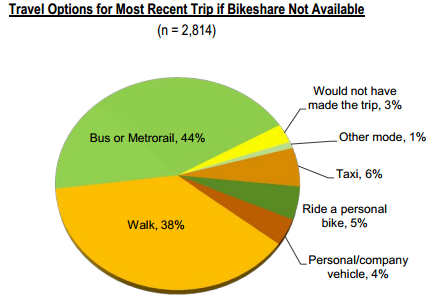
View full size image.
Source: 2013 Capital Bikeshare Member Survey Report
Bikeshare Helps Grow Retail
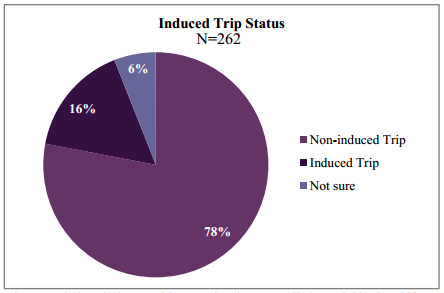
- Intercept survey of CaBi riders arriving at retail destinations
- Without a CaBi station, 16% report that they would not have taken the trip
- Induced CaBi trip-takers spent an estimated $75-127K at the 5 surveyed stations in 2Q 2013
View full size image.
Source: Virginia Tech report, "Economic Impacts and Operational Efficiency for Bikeshare Systems," Dec 2013.
Demand > Supply
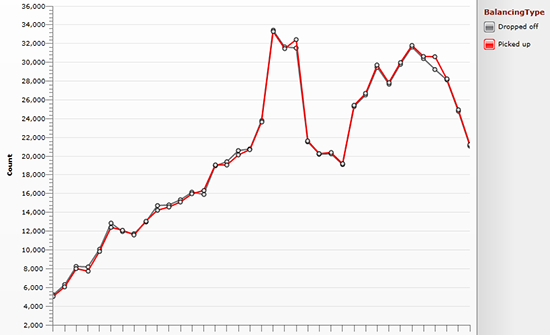
- Alta (system contractor) redistributes 15-30K (or more!) bikes per month
- 8 trucks, 2 locations
View full size image.
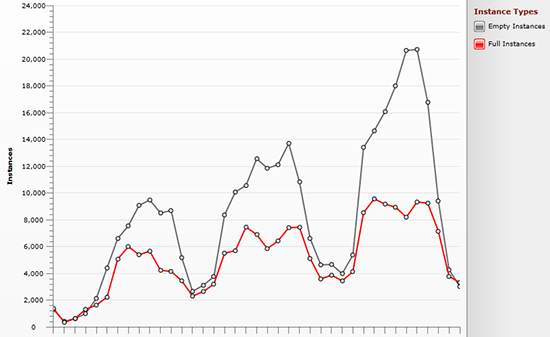
- Demand still outpacing both capital and operations growth
- Morning commute inflow demand cannot be met 100%
View full size image.
Source: CaBi Dashboard operations data, Sep 2010 - Jan 2014
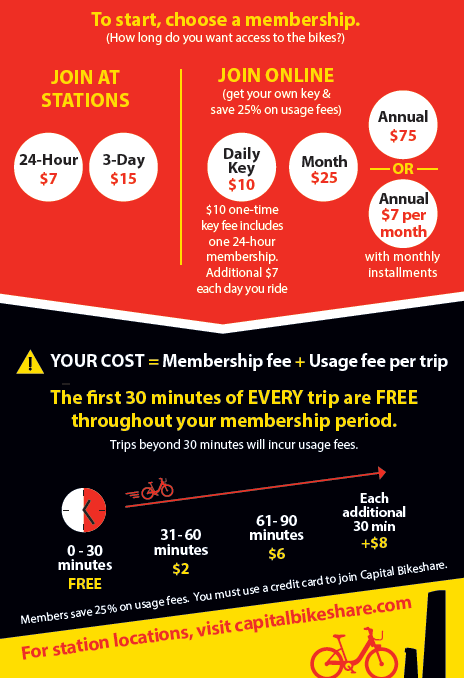
Carrots and Sticks?
- Charge a "cordon" congestion charge?
- Boost reverse-peak rides?
- Make more costs variable with a per-trip "fare" model?
- Encourage users to "graduate" to personal bikes?
- New contractual incentives/penalties?
- Or just "build our way out?"
- What would the impact on ridership be?
Planning for Continued Performance
- Long term sustainability plan
- Achieve long-term transportation plan bikeshare targets
- Goals for ridership, equity, accessibility, environment, & efficiency
- 26 draft measures of success
- Guide future stations, investments, promotions, pricing, and other tactical decisions
Capital Bikeshare surveys, data dashboard, and trip record archives
http://www.capitalbikeshare.com/system-data
CaBiTracker
http://cabitracker.com/
Virginia Tech report, "Economic Impacts and Operational Efficiency for Bikeshare Systems"
https://ralphbu.files.wordpress.com/2014/01/virginia-tech-capital-bikeshare-studio-report-2013-final.pdf
Darren.buck@dc.gov
202-671-5112
ddot.dc.gov/page/bicycles-and-pedestrians
@bikepedantic
Part C: Denver B-cycle
Understanding Denver B-cycle Use
Nick Bohnenkamp
Executive Director
Denver B-cycle
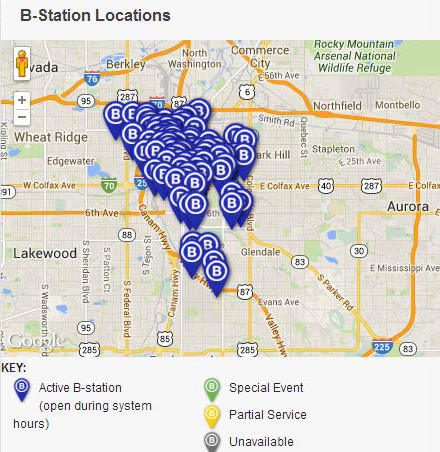
Denver B-cycle system at a glance
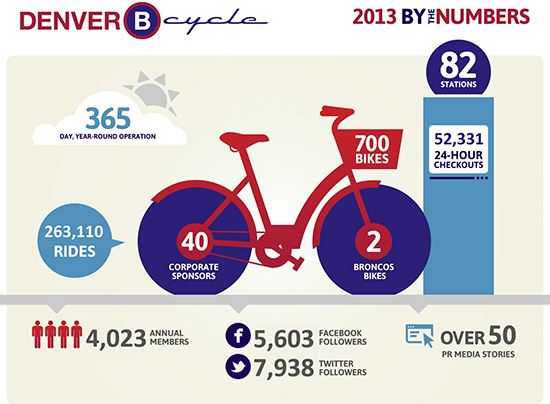
- 700 bikes at 82 stations
- Launched April 22nd, 2010
- 12.5 square mile service area
- Tie to Boulder B-cycle
- 2 truck balancing fleet
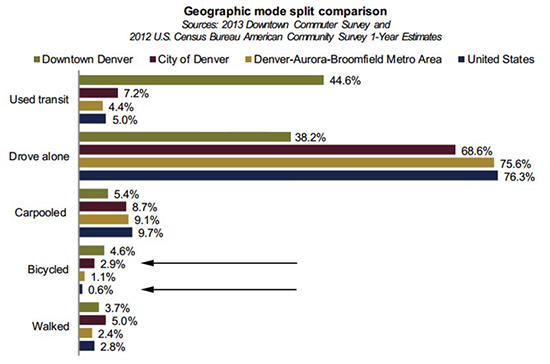
Denver mode share
2013 season results
View full size image.
Where do our members live?
- Annual Member footprint much larger than system footprint
- Casual users:
- 50% out of state
- 33% Denver
- 17% in state (non Denver)
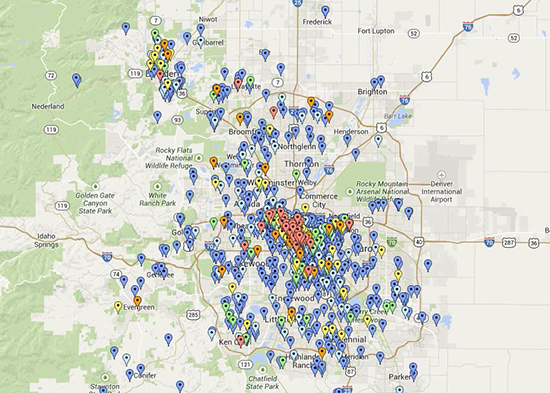
Annual Members by Home Address
Why do our members use B-cycle?
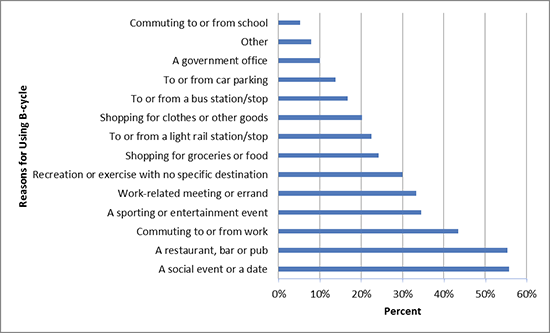
View full size image.
By Andrew Duvall, Ph.D.
2012 Survey of Users
DEPARTMENT OF HEALTH AND BEHAVIORAL SCIENCES
UNIVERSITY OF COLORADO DENVER
Modes replaced by B-cycle
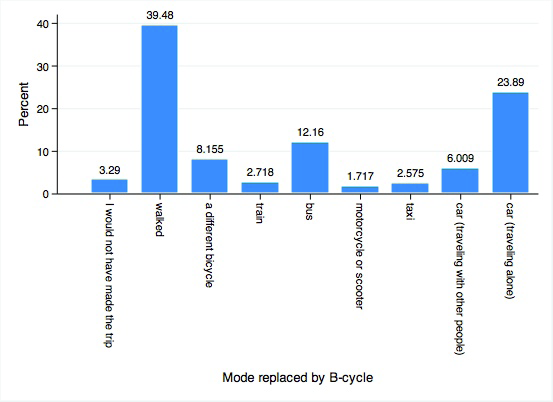
View full size image.
By Andrew Duvall, Ph.D.
2012 Survey of Users
DEPARTMENT OF HEALTH AND BEHAVIORAL SCIENCES
UNIVERSITY OF COLORADO DENVER
Trip Data: Annual vs Casual Users
Checkouts by Time of Day
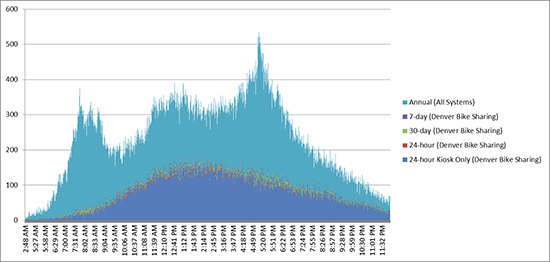
View full size image.
Trip Data: Annual vs Casual Users
Checkouts by Day of Week
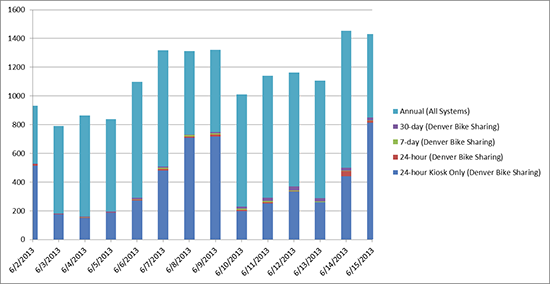
View full size image.
Chart represents Sunday through Saturday, two-week period
Trip Data: Annual vs Casual Users
Trip Durations by Member Type
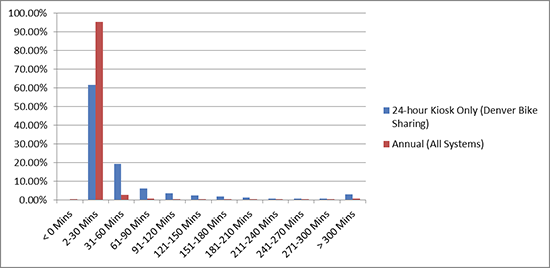
View full size image.
Operational Impacts
- Weekends, Weekdays, Events
- Demand, pre-balancing, & balancing for "an area"
- Full/empty station status
- Event pricing
- 50% System Expansion in 2013 lead to:
- ~30% increase in trips
- 47% increase in annual membership
- 29% increase in casual memberships
- Customer Service and brand building.
Financial Impacts
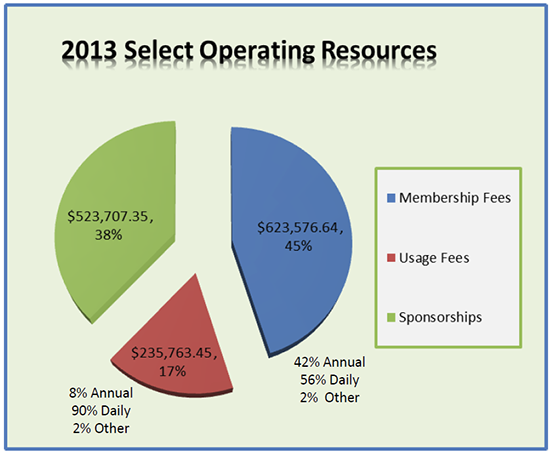
Planning for the Future
- Defining Expansion Plan Priorities
- Service Reliability Standards
- Membership Growth and Equity
- Pricing schedules and membership types
- Sponsorship Revenue Streams
Denver B-cycle
Nick Bohnenkamp
720-259-0139
Nick.Bohnenkamp@denverbikesharing.org


 View full size image

![]() Capital Bikeshare introduced
Capital Bikeshare introduced![]() 1-way L Street Cycletrack installed
1-way L Street Cycletrack installed![]() 2-way 15th Street Cycletrack installed
2-way 15th Street Cycletrack installed


