Patrick DeCorla-Souza, Tolling and Pricing Program
Manager, FHWA
Lee Munnich, Humphrey Institute, University of Minnesota
Kenneth Buckeye, Minnesota Department of Transportation
John Doan, SRF Consulting
Center for Innovative Finance Support
Federal Highway Administration
Fifth Part of a Webinar Series on Overcoming the Challenges of
Congestion Pricing.
Session 5: Technology to Enable and Complement Congestion Pricing
Audio:
- Via Computer - No action needed
- Via Telephone - Mute computer speakers, call 1-866-863-9293
passcode 57921953
Presentations by:
Audience Q&A: addressed after each presentation,
please type your questions into the chat area on the right side of
the screen
Closed captioning was available at: http://www.fedrcc.us//Enter.aspx?EventID=1781245&CustomerID=321
Upcoming Webinars:
Visit https://ops.fhwa.dot.gov/congestionpricing/webinars/index.htm
Recordings and Materials from Previous Webinars: https://www.fhwa.dot.gov/ipd/tolling_and_pricing/resources/webinars/congestion_pricing_2011.aspx
Upcoming Webinars:
July 28, 2011 - Dynamic Ridesharing and Congestion Pricing
August 25, 2011 - Pay-as-You-Drive Insurance
September 22, 2011 - Economics of Congestion Pricing and Impacts
on Business
October 27, 2011 - Integrating Transit with Congestion Pricing and
Increasing Congestion Pricing Acceptance
November 17, 2011 - Best Practices in Parking Pricing
December 15, 2011 - Results of the Urban Partnership and Congestion
Reduction Demonstration Programs
Part 1: Current and Future Congestion Charging Technologies
Jack Opiola
D'Artagnan Consulting LLP
Purpose
- To outline the key research and concepts in Road User Charging
process and technologies;
- To present worldwide trends in Road User Charging process
and technologies;
- To outline technology options for each system.
FHWA Primers
Primer Topics
- Technologies That Enable Congestion Pricing
- The functional processes for tolling and congestion
pricing.
- What technologies there are to consider.
- How the technologies are applied.
- Examples of how technologies have been applied.
- What technologies may make it work better in the future.
- Technologies That Complement Congestion Pricing: A Primer
- How technology complements congestion pricing.
- What technologies there are to consider.
- How the technologies are applied.
- Examples of how technologies were applied to retrofit
congestion pricing on an existing facility.
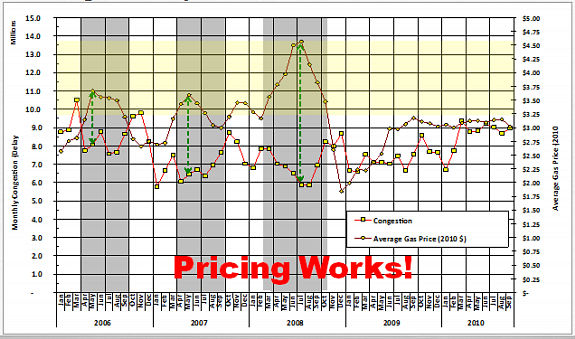
Travel behavior - Congestion related to gasoline prices in Southern
California
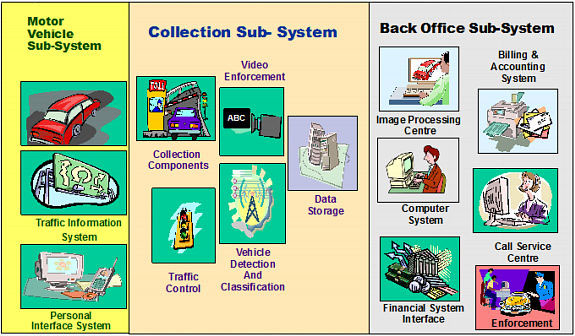
Revenue Collection Systems
- Motorist/Vehicle Sub-System (MVS)
- Collection Sub-System (RCS)
- Back Office Sub-System (BOS)
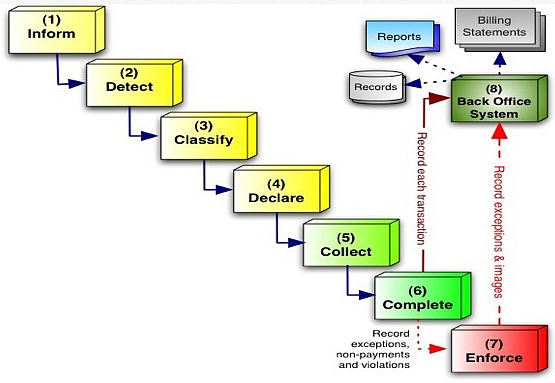
Revenue Collection Process
Revenue Collection Components
- Motor Vehicle Sub-System
- Traffic Information System
- Personal Interface System
- Collection Sub-System
- Collection Components
- Video Enforcement
- Data Storage
- Vehicle Detection and Classification
- Traffic Control
- Back Office Sub-System
- Image Processing Centre
- Billing & Accounting System
- Computer System
- Call Service Center
- Financial System Interface
- Enforcement
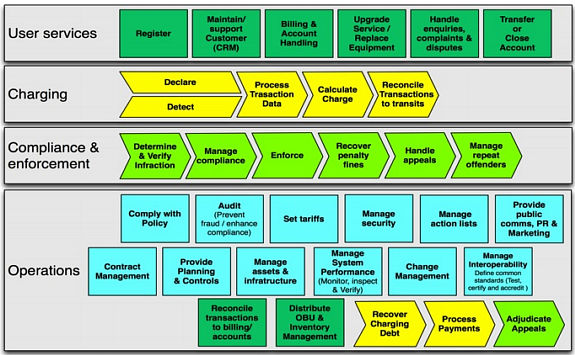
- User services
- Register
- Maintain/support Customer (CRM)
- Billing & Account Handling
- Upgrade Service/Replace Equipment
- Handle inquiries, complaints & disputes
- Transfer or Close Account
- Charging
- Declare
- Detect
- Process Transaction Data
- Calculate Charge
- Reconcile Transactions to transits
- Compliance & enforcement
- Determine & Verify Infraction
- Manage compliance
- Enforce
- Recover penalty fines
- Handle appeals
- Manage repeat offenders
- Operations
- Comply with Policy
- Audit (Prevent fraud/enhance compliance)
- Set tariffs
- Manage security
- Manage action lists
- Provide public comms, PR & Marketing
- Contract Management
- Provide Planning & Controls
- Manage assets and infrastructure
- Manage System Performance (Monitor, inspect & Verify)
- Change Management
- Manage Interoperability - Define common standards (Test,
certify and accredit)
- Reconcile transactions to billing/accounts
- Distribute OBU & Inventory Management
- Recover Charging Debt
- Process Payments Adjudicate Appeals
System Design Approach
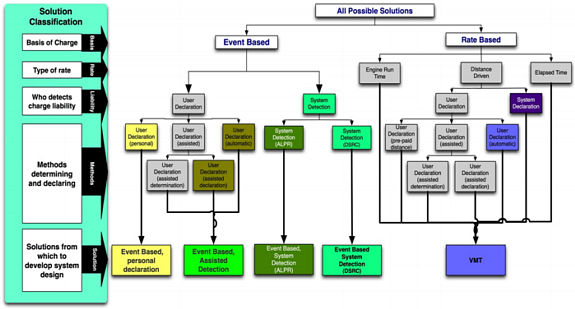
Technology Options
- Paper Based System;
- Auto-License Plate Recognition (ALPR);
- Radio Frequency Identification (RFID);
- Dedicated Short Range Communication (DSRC);
- Satellite Positioning System (GPS / GNSS); and
- Wireless "cell based" solutions and new "smart
phone" approaches
Comparison of Technology Options
| |
Paper Based |
ALPR |
RFID / DSRC |
GPS |
Smart Phone |
| Central Business District Single Zone/Unitary Charge |
X |
X |
X |
X |
X |
| Central Area / Multiple Zones / Multiple Routes/Variable
Charges |
|
O |
X |
X |
X |
| Multiple Time Frames/Variable Charges by Location/Time
of Day/Type of Vehicle / Environmental charges |
|
|
X |
X |
X |
| Distance Based Charging in Zones/ Combinations of above |
|
|
O |
X |
X |
Thank You!
Jack Opiola
+1 (703) 622-6446
jack.opiola@me.com
Part 2: Technology for Minnesota's Managed Lanes Systems
Nick Thompson
Minnesota Department of Transportation
Agenda
- Discuss the technology and systems needed to enable successful
congestion pricing system in Minnesota
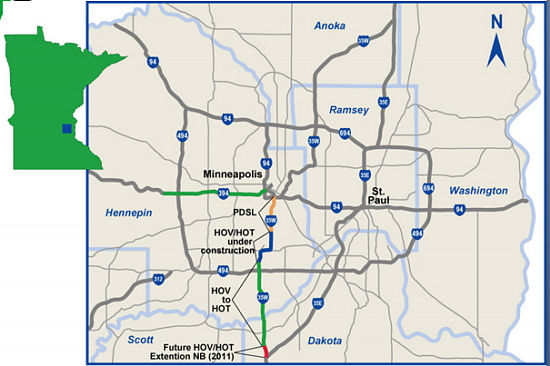
Managed Lanes in MN
- 2005 Converted 11 miles of HOV to HOT on I-394
- 2009 Expanded HOT network to 35W
- 8 miles HOV to HOT conversion
- 3 miles Shoulder to HOT conversion
- 11 miles of ATM/Managed lanes system (all lanes)
- 2010 Completed additional 4 mile HOT lane/Managed Lane system
on 35W
MnPASS Innovations
- Tolling on lanes directly adjacent to non-barrier separated
lanes with multiple access points
- Full dynamic pricing on multiple consecutive roadway segments
- Technology applications assist in enforcement, read/write
transponders and enforcement readers
- Tolling combined with Active Traffic Mgmt
MnPASS System Layer
- MnPASS enabled by underlying systems
Existing System and New
- Existing
- Communication network
- Traffic Sensors
- Dynamic Message Signs
- Cameras
- Gates for Reversible Road
- Traffic Management Center/Systems
- Incident Mgmt Systems
- New Technology
- Toll Systems
- Transponders
- Pricing Signs
- Toll Readers
- Communications
- Back office
- Transactions
- Customer Service
- Monitoring
- Enforcement
I-394 MnPASS Lane Design
Establishing the Toll Price
- Min: $0.25 Max $8,00
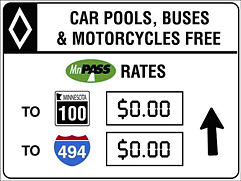
- Price based on HOT lane traffic conditions only and priced
in zones
- Data from sensors in lane every ½ mi
- Price updated every 3 minutes
- Price is set off customizable rate tables
- Existing Price, Level of Service, and Rate of Change
determine New Price
- Price based on worst traffic density point downstream of
entrance
- Pricing during set hours (i.e. not 24x7)
- Displayed price needs to be linked to the toll transaction
for the toll reader downstream from price sign
MnPASS Enforcement Strategy
- Goal: Violation rate <10%
- Convert violators to paying customers
- Measure compliance, target problems
- Be present
- Provide technology to enforce
- Desired, but unrealized, compliance strategies
- Higher fine structure, video enforcement
- Results: Violation rates are <10%
Enforcement
- Supplemental tools
- Beacons
- Enforcement transponder
- Mobile enforcement reader
Technology Provided to Enforce MnPASS
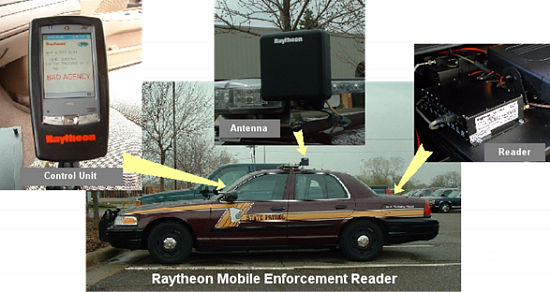
Toll Collection
- Pre-paid MnPASS account - Credit Card only
- User Install transponder
- Must have "off" switch
- License plate readers not allowed
- Antennae read transponder in vehicle
Back Office Operations
- Center to Center Communications
- Transaction Processing
- System Monitoring and testing
- Data Customer Service
- Highly Reliable Systems
- Built with expansion in mind
Expansion to 35W Corridor
- Built Upon
- In place communication networks
- In place traffic management systems
- Toll Systems
- Retain
- Tolling strategy
- Enforcement Technology
- Back office
- New
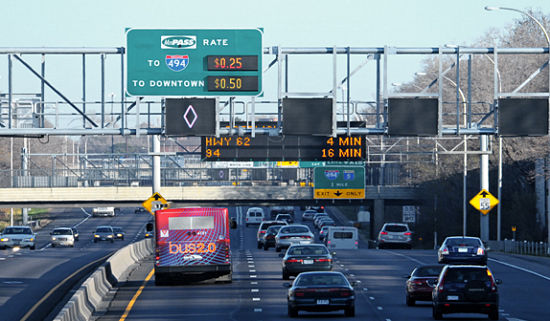
- Active Traffic Management all lanes
- Dynamic priced shoulder lane
- Dynamic lane signs integrated with toll pricing
I-35W MnPASS: Travel Time Advisory
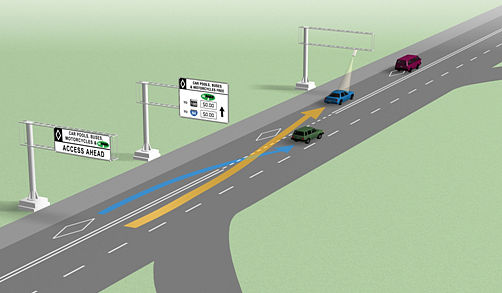
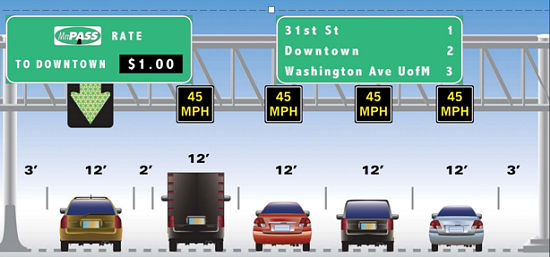
PDSL/Managed Lanes: Driver Views
Questions and More Information
Visit
www.mnpass.org
Or
www.dot.state.mn.us/upa/
Contact:
nick.thompson@state.mn.us
Part 3: Technologies That Complement Congestion Pricing
David L. Dye
Deputy Secretary
Paula J. Hammond, P.E.
Secretary
Steve Reinmuth
Chief of Staff
Presented by:
Morgan Balogh, P.E.,
PTOE Traffic Engineer, Northwest Region Operations
Congestion Pricing Webinar June 23, 2011

Monitor, Manage, Measure
WSDOT is a nationwide expert on using technology to keep drivers
informed, move more traffic safely & efficiently, and systematically
measure & report on performance.
WSDOT's Long History of Freeway System Operations
- Reversible express lanes operations
- Variable message signs
- Variable speed limits
- Traffic management centers
- Traffic cameras
- Ramp meters
Traffic Management Centers
- Integrated Operations
- Coordinated Communication
- System Controls
- Tunnel Operations
- Ramp Metering
- Active Traffic Management Systems
- Central Control of Traffic Signal Systems
- Integrated Corridor Management (ICM)
- Information Dissemination
How do we use high quality traffic data?
To develop strategies and assess the performance of the three-part
Moving Washington strategy
| Operating Roadways Efficiently |
Managing Demand |
Adding Capacity Strategically |
- Support variable pricing for HOT lanes
- Facilitate electronic tolling
- Implement Active Traffic
Management - Smarter Highways
- Provide real-time traveler information
- Apply other technologies in operations to enhance
safety and system efficiency
|
- Monitor results of various efforts to reduce VMT
(for GHG and congestion)
- Track HOV usage
- Validate the modeling analysis of TDM strategy
impacts
|
- Assess the impacts of past strategies
- Customize solutions for congested corridors
- Plan, prioritize, and program capital improvement
projects
- Assist legislature and governor in making investment
decisions
|
SR 167 High Occupancy Toll (HOT) Lanes
General Purpose drivers save time:
- GP lane speeds increased by 11 percent
- Volume has increased two to three percent
HOT lane drivers save time:
- HOT lane drivers save up to eight minutes during rush hour
- Volumes increased 12 percent
Usage and Revenue is growing:
- HOT lane usage doubled during the second year of the pilot
- Revenue covers O&M costs
What are Smarter Highways?
- Build upon current traffic technology
- Use the successes we have to build smarter roadways
for the future
- Install overhead electronic signs
- Alerts drivers to slow down or change lanes due to
blocking incidents. Also improves emergency access.
- Allow drivers to use shoulders
- Open shoulders as a travel lane during peak commute
hours where safe to do so
- Build in emergency pull off areas
- Gives space for vehicles to pull over in emergencies
and helps keep traffic moving
- Give drivers more real-time information
- Electronic signs allow drivers to make better reroute
decisions
Smarter Highways
- Traffic accidents are responsible for at least 25% of all
congestion
- Anticipate a 30% reduction in injury collisions
- Give drivers information to make better travel decisions
- Variable speed limits
- Lane control
- Real time traffic information
Signs every half mile
- 1st Sign Bridge: A collision ahead causes
speed limit to drop to 50 mph.
- 2nd Sign Bridge: Signs display lane status.
And direct drivers to begin to start moving over.
- 3rd Sign Bridge: At the incident, two right
lanes closed.
- 4th Sign Bridge: After the incident, the
speed limit automatically returns to the posted 60 mph.
Smarter Highways Segments Under Way
- Northbound I-5
August 2010
Boeing Access Road to I-90 in Seattle
- SR 520
November 2010
I-5 to 130th Avenue NE in Bellevue
- I-90
June 2011
I-5 to 150th Avenue SE in Bellevue
What other highways might get smarter?
- WSDOT engineers conducted a feasibility study to see where
in the Central Puget Sound Region Smarter Highways might be
effective in improving safety.
- Future expansions of the system are currently unfunded.
Lake Washington Urban Partnership Agreement
- $154.5 million federal grant to apply these innovative approaches
to reduce congestion in the SR 520 corridor
- Tolling - encourages travel at off-peak
hours and reduces trips
- Technology - variable speed limits
and real time driver info
- Transit - added over 130 new daily
bus trips to the 600 already in the corridor
- Telecommuting - educational efforts
with employers, van/carpools
- Partners:
- Puget Sound Regional Council
- Washington State Department of Transportation
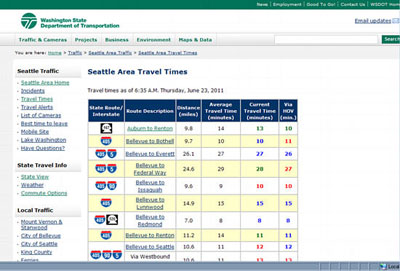
Lake Washington Travel Time Signs
- 3 new dedicated travel time signs
- WB SR 520 just east of I-405
- SB I-405 at NE 72nd Place
- SR 522 at SR 202
Seattle Integrated Management Corridor
- Freeway - I-5
- Commuter Rail
- Light Rail
- Transit Corridor
Corridor Dynamics
- Regionally critical corridor
- Geographically constrained
- Complex right-of-way network
- Significant freight traffic - Port of Seattle
- Over 90 major events annually
- Major highway construction over several years - Alaskan
Viaduct Replacement
Web, 511, & Other Media Comparison
- Web: Average about 1 Million page views per day.(~85% is
for travel information)
- Web: Routinely see over 2 million daily page views during
winter weather
- Comparatives
- 511 calls vary from 70K to 500K per month
- Reached our 10M 511 call after year 6
- Blog views are 10K per month
- YouTube views 20k per month
- Flickr sees up to 200K views per month (although had
1 million views last month due to north cascades!)
- Twitter has about 16,000 followers
- Email alert pushes, minimum 400K per month
- 2500 Facebook fans
Performance Measurement
- Accountability
- Optimization
- Investment Decisions
Travel time performance for July-December in 2007-2010 on a sample
of 18 high-demand commute routes
- Morning (am) peak is between 6 am and 9 am; evening (pm)
peak is between 3 pm and 7 pm; length of route in miles; all
travel times in minutes
| Route name (route length) |
Direction of travel |
Average travel time in minutes
during peak period |
Peak average travel time change
in minutes |
Peak volume change |
Daily volume change |
| 2007 |
2008 |
2009 |
2010 |
2008 vs. 2007 |
2009 vs. 2008 |
2010 vs. 2009 |
2009 vs. 2008 |
2010 vs, 2009 |
2009 vs. 2008 |
2010 vs, 2009 |
| Morning commutes |
| I-5 Federal Way to Seattle (22) |
NB |
42 |
35 |
31 |
34 |
-7 |
-4 |
+3 |
+5% |
-1% |
+5% |
-1% |
| I-5 Everett to Seattle (24) |
SB |
41 |
36 |
35 |
37 |
-5 |
-1 |
+2 |
+3% |
-4% |
+3% |
-1% |
| I-5/I-405 Everett to Bellevue (23) |
SB |
42 |
37 |
36 |
40 |
-5 |
-1 |
+4 |
0% |
-2% |
+3% |
0% |
| I-405 Tukwila to Bellevue (13) |
NB |
35 |
33 |
20 |
22 |
-2 |
-13 |
+2 |
+33% |
-2% |
+10% |
+1% |
| SR 167 Auburn to Renton (10) |
NB |
17 |
14 |
14 |
15 |
-2 |
0 |
+1 |
+9% |
-2% |
+5% |
-1% |
| I-405/I-90/I-5 Bellevue to Seattle (11) |
SB/WB/NB |
14 |
-* |
12 |
12 |
-* |
-* |
0 |
-1% |
+1% |
0% |
+3% |
| I-405/SR 520/I-5 Bellevue to Seattle (10) |
NB/WB/SB |
14 |
13 |
14 |
14 |
-1 |
+1 |
0 |
0% |
-3% |
+2% |
-2% |
| I-5/I-90/I-405 Seattle to Bellevue (11) |
SB/EB/NB |
14 |
14 |
12 |
13 |
0 |
-2 |
+1 |
-5% |
0% |
+1% |
-1% |
| I-5/SR 520/I-405 Seattle to Bellevue (10) |
NB/EB/SB |
16 |
15 |
15 |
16 |
-1 |
0 |
+1 |
-2% |
-2% |
+2% |
-2% |
For more information
Morgan Balogh, P.E., PTOE
Traffic Engineer, Northwest Region Operations
206-440-4487
baloghm@wsdot.wa.gov
Part 5: FHWA ETC Rule
Bob Sheehan
FHWA Office of Operations
robert.sheehan@dot.gov
FHWA ETC Rule
- Published October 8, 2009
- In response to SAFETEA-LU requirement in §1604 to issue
rule on req'ts, standards, or performance specs for automated
toll collection
- NPRM issued September 2007, included questions about need
for & timing of standard
- Headlines of Comments to NPRM
- Sunk costs of installed base must be considered
- Long phase-in period or grandfathering
- Back-office is major aspect of interoperability; toll
tag is only a part
- Significant cost difference between DSRC/5.9Ghz &
toll-only devices
- Question related to timing of std: General response
was "too soon" & DSRC considered when it's
ready
- Only applies to 3 tolling programs: Interstate Construction
Pilot (1), Express Lanes Demonstration (2) and Value Pricing
Pilot Program
- Not applicable to HOV-HOT, 23 USC §129 or
Interstate Reconstruction Pilot
- Requires ETC for all these programs
- ETC defined as "ability for vehicle operators
to pay tolls automatically without slowing down from
normal highway speeds"
- Requires FHWA concurrence of selected ETC method
- Consider likely users, how interoperability
is addressed, consider future (5-year) techniques
- Intent is not to be a barrier or hindrance,
but to ensure a collaboration between industry/deployers
and Government as technologies & techniques
advance
- About 1/2 of responders stated that any national
toll collection std be pursued as an integral part
of connected vehicle research (formerly known as the
IntelliDrive SM program)