Patrick DeCorla-Souza, Tolling and Pricing Program Manager, FHWA
Lee Munnich, Humphrey Institute, University of Minnesota
Kenneth Buckeye, Minnesota Department of Transportation
John Doan, SRF Consulting
Center for Innovative Finance Support
Federal Highway Administration
Thirteenth Part of a Webinar Series on Overcoming the Challenges of Congestion Pricing.
Session 13: Incident Management and Access for Managed Lanes - Webinar
Audio:
- Via Computer - No action needed
- Via Telephone - Mute computer speakers, call 1-866-863-9293 passcode 93130562
Presentations by:
Audience Q&A: addressed after each presentation, please type
your questions into the chat area on the right side of the screen
Closed captioning was available at: http://www.fedrcc.us//Enter.aspx?EventID=1980150&CustomerID=321
Upcoming Webinars:
Visit https://ops.fhwa.dot.gov/congestionpricing/webinars/index.htm
Recordings and Materials from Previous Webinars: https://www.fhwa.dot.gov/ipd/tolling_and_pricing/resources/webinars/congestion_pricing_2011.aspx
Part 1: Traffic Incident Management - Enhancing TIM for all Operations Strategies
Congestion Pricing Webinar
July 17, 2012
Average annual number of responders struck and killed nationally while working in
or near moving traffic:
- Fire/Rescue and EMS: 6 to 8/year
- Law Enforcement: 10 to 12/year
- Tow/Recovery: 50/year
- Highway: 100/year + 20,000 injured
*Source: Emergency Responder Safety Institute

- Example of a 1998 "Struck-By" incident that killed one firefighter and
injured nine additional responders
- Vehicle on PA Turnpike lost control and slid into a drainage ditch...911 is called
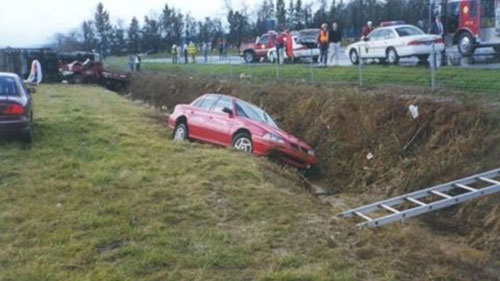
Courtesy Lionville (PA) Fire Co.
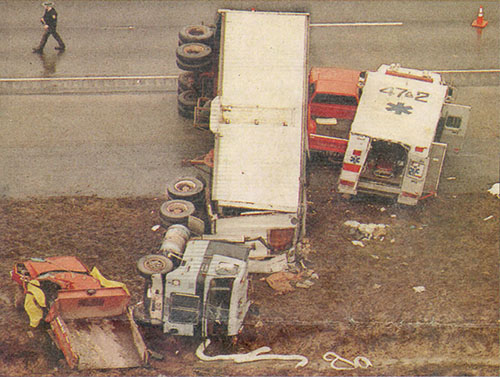
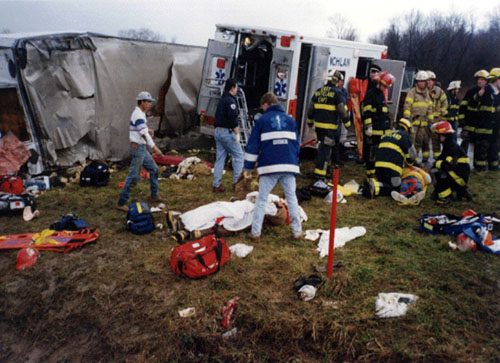
- Estimated 20-25% of all Incidents are secondary
- Estimated that the likelihood of a secondary incident raises 2.8% for every minute
- Often more severe than the primary incident
Quantifying the Problem- Congestion vs. Crashes
 Annual cost of traffic crashes: $299.5
billion (+ 83% from 2008) Average cost per person ≈ $1,522
2011 Major TIM Initiatives
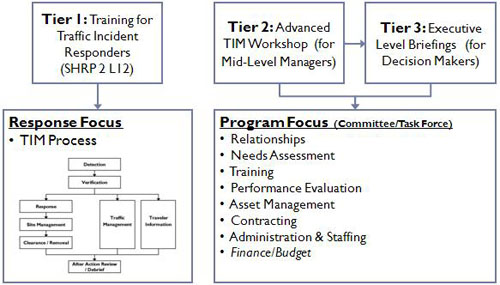
- Advanced Workshops and Executive Briefings
- Self Assessment (Big move nationally in 2011)
- National TIM Framework
- Training Standardization
- Public Outreach Toolkit
- Performance Metrics
- P2P Program
- IACP Agenda and National Executive Meeting
- Training for Traffic Incident Responders (SHRP 2 L12)
Advanced TIM Workshops: 40 Completed
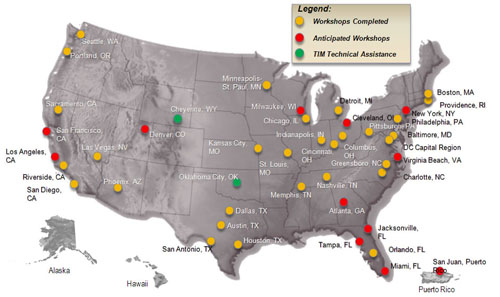
Common Critical Needs
- Develop/enhance TIM Program
- Develop/implement multi-discipline TIM training
- Enhance responder notification/communication
- Measure performance
- Public Outreach and Awareness
National TIM Program Vision...
Through continuous and enhanced planning and training of all TIM personnel:
- Reduce or eliminate responder and motorist injuries and fatalities
- Promote rapid incident clearance thereby reducing traffic congestion
- Develop or enhance local TIM Programs that ultimately benefit corridors, regions
and states
- Emphasize TIM as a system operations "core mission" for all responders
- Measure performance that demonstrates improved TIM responses and programs over time
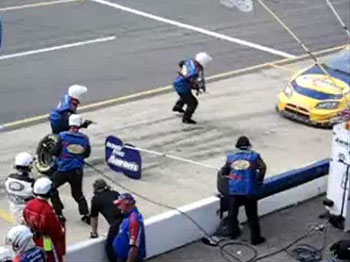
The NASCAR Pit Stop - TIM Analogy
- NASCAR: Quicker pit stops = the difference between winning and losing
- 1960: 45 seconds (4-prong lug wrench)
- 1963: 25 seconds (air/impact wrench)
Training - Practice - Technology
"I feel that we've gotten stuck at 25 seconds..."
Brian Kary, Mn/DOT RTMC TIM Engineer
Operations Overview
Moving from Building a System
TO
Using and Operating the System
At the core...
Traffic Incident Management (TIM)
- TIM consists of a planned and coordinated multi-disciplinary process to detect,
respond to, and clear traffic incidents so that traffic flow may be restored as
safely and quickly as possible
- Effective TIM reduces the duration and impacts of traffic incidents and improves
the safety of motorists, crash victims and emergency responders
National Unified Goal for TIM
The NUG for TIM is:
- Responder Safety
- Safe, Quick Clearance
- Prompt, Reliable, Interoperable Communications
NUG Framework
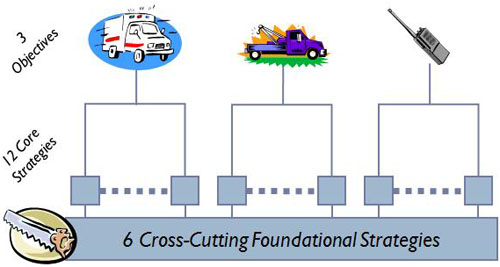
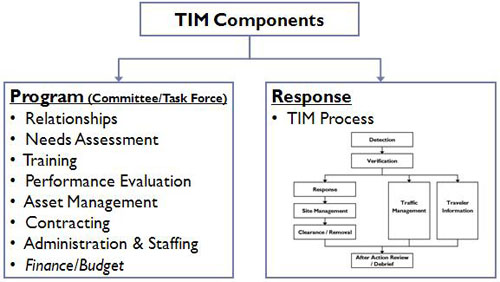
TIM Program Components
TIM Performance Measures - Good Practices and Enhancement Discussion
Measuring Success
What Gets Measured Gets Performed...
- Quantifying TIM benefits will advance program continuity:
- Builds critical mass for program support from managers and elected officials:
- Ensures buy-in from diverse stakeholders:
- Multiple agencies, coordinated response
- Supports allocation of technical and budget resources
TIM Performance Measures
"Roadway" Clearance Time
- The time between first recordable awareness of an incident (detection/ notification/verification)
by a responsible agency and first confirmation that all lanes are available for
traffic flow.
"Incident" Clearance Time
- The time between the first recordable awareness and the time at which the last responder
has left the scene.
Secondary Crashes
- The number of secondary crashes beginning with the time of detection of the primary
incident where a collision occurs either a) within the incident scene or b) within
the queue, including the opposite direction, resulting from the original incident.
High-Level TIM Training Framework and Tiered TIM Focus Areas
Strategic Highway Research Program (SHRP2)
- Authorized by Congress to address some of the most pressing needs related to the
nation's highway system
- Research areas: Safety, Renewal, Reliability, Capacity
- Administered by Transportation Research Board (TRB) :
- Federal Highway Administration (FHWA)
- America Association of State Highway and Trans Officials (AASHTO)
SHRP2 : National Traffic Incident Management Responder Course
- Objectives: Improved responder safety
- Improved reliability (reduced incident duration)
- Improved motorist safety (reduced secondary crashes)
- Approach:
- Researched core competencies
- All disciplines participated every step
- Development of multi-disciplinary training program for all responder stakeholders
- Cross-training in TIM core competencies
SHRP2 - L12: Training Course Elements
- Course Design:
- Final course is developed so entire course can be taught by Experienced Trainers
from All Disciplines
- Presented in its entirety or through selected modules
- Four Hour Version will be available
- Course Delivery Mechanisms:
- Provide course to existing entities already conducting training - central body sets
course
- Flexible approach - delivery provided at local level
- Instructors from different disciplines
Under Development
- E-Learning Course: An eTools version of the training will be developed
to facilitate wide scale deployment of the training
- Evaluation: assess the degree to which the training accomplishes
the L12 objectives of improving TIM core competencies and coordination among multidisciplinary
response teams.
First Round
TRB Pilots - Tennessee, Virginia, Montana Transition workshop -
Fort Lauderdale, FL
FHWA Implementation - Starts late August - Aggressive schedule
Delivery
- Train the Trainer: Multi- discipline full curriculum developed
in SHRP2 L12 project. After completing the TtT course participants will be equipped
to provide the training to a larger audience of incident responders in their discipline.
- Classroom Training: Multi-discipline trainers trained through the
TtT courses will conduct classroom-based training for a broader audience of incident
responders across that state and/or region.
National TIM Responder Classroom Training
To the extent possible:
- Conduct multi-discipline sessions
- 2 instructors (police, fire, DOT) per session
- 4 hours curriculum will be available
Other training options:
Academy curriculums
SHRP2-L32: Implementation Goals
- By August 2012:
- Conduct 4 TtT pilot workshops (TRB)
- By August 2014:
- Conduct 40-60 additional TtT sessions
- Train 1000-1500 State/local responders to deliver classroom training
- Deliver Classroom Training to 30K-70K responders
- Within 10 Years:
- Train 4500 State/local responders to deliver classroom training
- Deliver Classroom Training to 425K-900K responders
- Deliver E-Learning to 1.2M responders
High Level Support
- International Association of Chiefs of Police
- State and Providential Division
- Expected to formally endorse in September
- International Association of Fire Chiefs
- American Association of State Highway and Transportation Officials (AASHTO) - Priority
project
- National Volunteer Fire Council- endorsement
- Public Safety/Transportation Summit -
Towing and Recovery
Georgia TIME Program
Towing and Recovery Incentive Program (TRIP)
- Implemented to pay heavy-duty recovery companies a monetary bonus for clearing commercial
vehicles wrecks within 90 minutes
Towing and Recovery Incentive Program (TRIP)
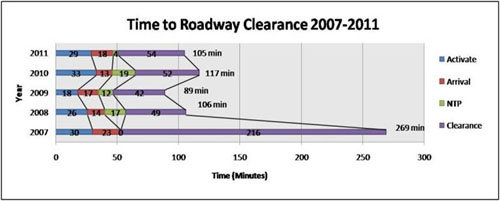
Reference: http://www.timetaskforce.com/trip.html
Do incentive based programs work?
- Evaluation completed by Atkins in 2011
- Cost savings PER INCIDENT = $456,396
- Percentage of Savings = 71%
- Financial benefit of TRIP for 2008 & 2009= $9,154,431
- Benefit / Cost of 11:1
Other Towing Programs
- Rapid Incident Scene Clearance Program- FL
- WSTOT- Blockbuster Tow Program
- WSDOT - Instant Tow Program
After-Action Review (AAR) / Debrief
- Typically a function of an on-going TIM Program (i.e. should NOT be done at the
incident scene)
- Absolutely critical for success
- Facilitates inter-agency relationship building
- Evaluation
- What went well?
- What went not so well?
- How can we do better?
Safe, Quick Clearance - Good Practices TIM SA 4.2.1.3
Safety Service Patrols
- Full-Function Service Patrols
- Provide all of the services provided by baseline and mid-level Safety Service Patrols,
PLUS:
- Clearance and recovery services
- Emergency traffic control and management
- Assistance with emergency services
- Example: Tennessee HELP Program
Safe, Quick Clearance - Good Practices TIM SA 4.2.1.3 Safety Service Patrols
- Today's Safety Service Patrols:
- Are a new generation of first responders
- Provide valuable public safety and protection services
- Help keep incident scenes safe
- Clear incidents more quickly
- Assist other emergency responders at incident scenes
- FHWA supports the expanded role of full-function service patrols and encourages
metropolitan jurisdictions and their states to establish or upgrade Safety Service
Patrols to full-function standards
Questions?
Paul.Jodoin@dot.gov
Part 2: 95 Express Phase 1 Miami, Florida - Incident Management for Managed Lanes
Federal Highway Administration Webinar
July 17, 2012
Javier Rodriguez, P.E., ITS Operations Engineer
FDOT District Six
Agenda
- FDOT District Six TMC
- Project Overview
- Incident Management Plan
- Development
- Resources
- Procedures
- Results
- Questions
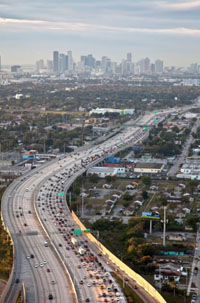
Photo: Interstate 95 Southbound heading towards Downtown Miami during AM Peak Period
FDOT District Six TMC - Overview
- Miami-Dade County
- Monroe County
- Miami is 7th Most Congested City in U.S.*
- 2.5 million residents**
- 9.9 million visitors in 2011***
- Limited Access Facilities (ITS)
- I-75, I-95, I-195, I-395 & S.R. 826
- Other Roadways (ITS)
- Incident Management
- Traffic Management
- Traveler Information
- Miles Managed Limited Access:
- 53.5 centerline miles
- Other Roadways: 212 centerline miles
- Closed Circuit TV (CCTV) Cameras - 226
- Dynamic Message Signs - 99
- Detector Stations - 301
- Ramp Meters - 22
* Texas Transportation Institute , Annual Urban Mobility Report (Rank in Total Annual
Delay)
** 2010 U.S. Census Bureau
*** Greater Miami Convention & Visitors Bureau (to September 2011)
District Six is fully ITS instrumented.
Project Overview - Scope
- Phase 1 Complete
- Northbound Tolling - Dec. 2008
- Southbound Tolling - Jan. 2010
- HOV to HOT Conversion
- 1 HOV Lane 2 Express Lanes
- Congestion-Priced Tolling
- Ramp Signaling
- Bus-Rapid Transit Service / HOV Enhancements

Phase 1 is complete and Phase 2 will be completed during the next 2-3 years.
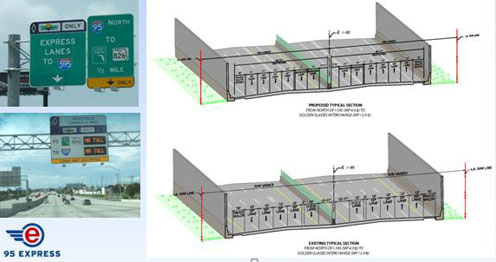
Project Overview - Design
- SIGNING AND MARKING CONCEPT
Project Overview - Operations
- Integrated with TMC Operations
- Expanded Procedures
- More Staff Responsibility = More Training
- Higher Expectations for EL Operators
- Dedicated EL Operators = TMC Supervisors, Daily Report
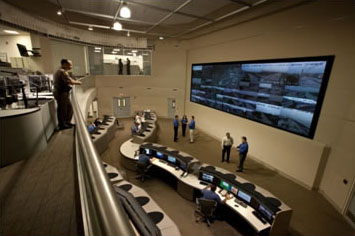
FDOT District Six TMC staff oversees all Incident Management efforts for 95 Express.
Project Overview - Incident Management (Prior to 95 Express)
- Road Rangers - 24/7 Service Patrols
- Asset Maintenance Contractor
- TMC Manager Responsible for TIM
- Improved Internal/External Coordination with Partner Agencies
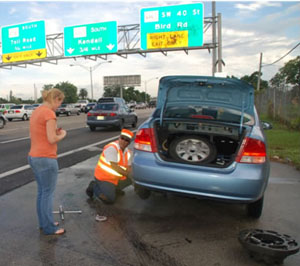
Prior to 95 Express, Road Rangers were the primary incident management services.
Project Overview - Operational Performance - FY 10/11
- EL Average Weekday Trips
- EL Average Peak Period Speeds
- Northbound: 56 MPH
- Southbound: 63 MPH
- Events Managed
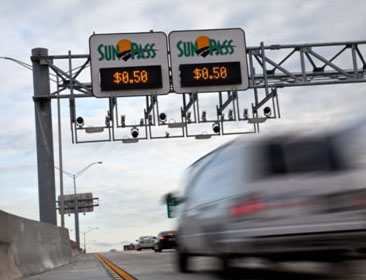
Express Lanes serviced approximately 19.2 million vehicle trips last Fiscal Year.
Incident Management Plan - Development
- Operational Risk Assessment
- Incident Management Workshops
- Follow-up Meetings with Agency Partners
- Developed protocols/agreements
- Developed quick clearance procedures
- Video sharing opportunities
- Updated for Phase 1B (SB) Opening
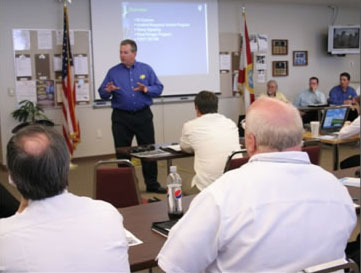
FDOT District Six Team held numerous workshops in preparation for project launch.
Incident Management Plan - Resources
- TMC 95 Express Lane (EL) Operators
- Road Ranger Services
- Additional Incident Responders
- Outreach/Training
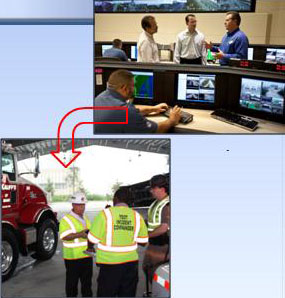
Incident management procedures developed at the TMC are executed on the field.
- TMC 95 Express Lane Operators
- Specially Trained EL procedures
- Central Contact Point for Agency Coordination & Dispatchers for Incident Response
Operators
- Dedicated radio channel on the existing 470 MHz radio system

Express Lanes Operators needed to evolve from traffic managers to travel demand
managers.
- Additional Incident Response Additional FHP Trooper (6am - 10pm, M-F)
- Incident Response Operators (5:30am to 9:30pm, M-F)
- Coordinates FDOT resources
- Specially Trained
- Incident Response Vehicles
- Specially Equipped IRV Truck
- Flatbed Tow Truck
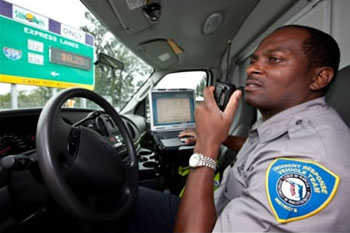
Incident Managers work together to clear event along northbound I-95.
- Outreach & Training
- One-on-One Meetings
- Post Incident Analysis
- Multi-Agency Training; MOT, Procedures
- Recurring Effort
Incident Management Plan - Procedures
- Road Rangers
- FHP support for Road Rangers to cross double white lines and delineators for incidents
- Disabled Vehicles
- Quickly/safely relocated to designated area
- Abandoned Vehicles
- Expedite logging the initial discovery
- FHP Trooper "sweeps" the 95 EL daily
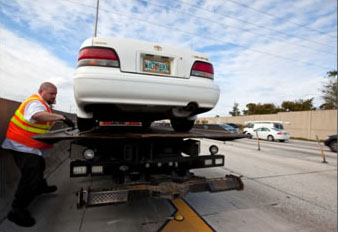
Procedures were developed to ensure efficiency and safety on the field.
- Staging
- Crash Investigations
- Relocated to strategic staging locations
- 5AM - 1 PM: Park & Ride Lot, 95 Street SB On-Ramp
- 1PM - 9PM: Park & Ride Lot, SR 112 Toll Plaza
- 9PM - 5AM: Park & Ride Lot
- Closure Procedures
- Less than 30 minutes - Post "Closed"
- 30 to 60 minutes - Road Rangers
- 60 minutes plus - Asset Maintenance Contractor
- DMS Strategies
- MOT Resources
- Developed New MOT Plans
- Within EL
- Redirection
- Buses
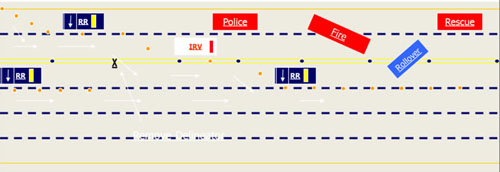
Results
- *Initial Impacts
- Travel Lane Blockage down 55%
- Response Times down 19%
* Data from 11/24/2008 through June 30th 2009
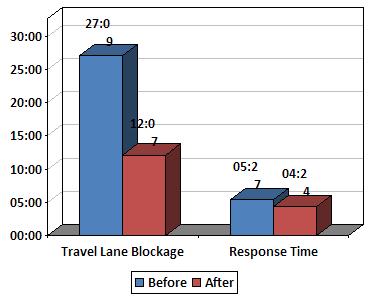
Results - FY 10/11
- 95 Express Closed due to Incidents 1.3% of time
- Travel Lanes Blockage Duration
- Express Lanes: 19 minutes
- District wide: 30 minutes

The Incident Management Plan has contributed to the overall success of 95 Express.
Questions
"Motorists and Motorcycles Share the Road"
Thank you,
Javier Rodriguez, PE
Intelligent Transportation Systems Operations Engineer
Florida Department of Transportation District Six
javier.rodriguez2@dot.state.fl.us
(305) 470-5757
https://95express.com
Part 3: SR 167 HOT Lanes
FHWA Webinar: Incident Management for Managed Lanes
July 17, 2012
Paula J. Hammond
P.E. Secretary
Steve Reinmuth
Chief of Staff
Todd S. Merkens
Toll Development Engineer
Tyler Patterson
Toll Operations Engineer

Introduction
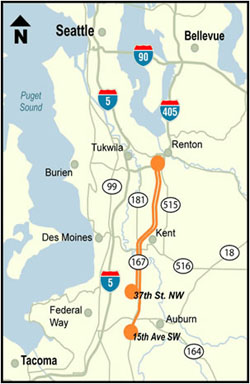 HOT lanes ...
- are carpool lanes that also are open to other users who pay a toll
- use toll rates that adjust automatically according to traffic volumes to keep HOT
lane traffic flowing at 45 mph or faster
Why HOT lanes on SR 167?
- Highly congested route
- Underutilized HOV lanes
- Ability to provide drivers a new choice
Opened: May 3, 2008
SR 167 HOT Lanes
- Lanes operate between 5 AM and 7 PM
- Lanes open to all, including solo drivers 7 PM - 5AM
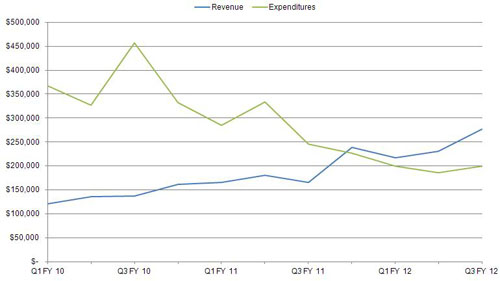
- Revenue helps pay for operations and maintenance, increased enforcement, and added
incident response.
- State Patrol enforces HOT lane rules
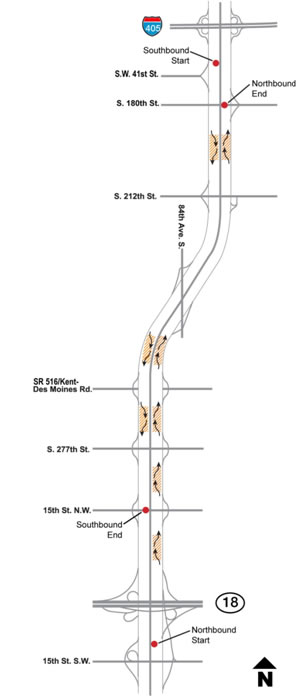
SR 167 HOT Lane Features
- Free to buses, 2+ carpools and motorcycles
- Solo drivers pay a single toll to travel any distance on 10-mile route
- Single HOT lane in each direction
- HOT lane separated from GP lanes by double-white line, which is illegal to cross
- Electronic signs indicate the toll rate before each entry point
- 10 access points
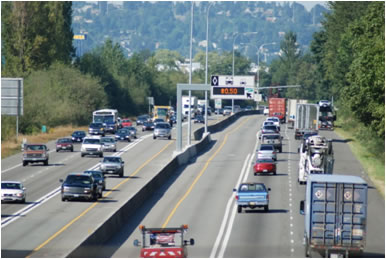
Post HOT lanes: HOV lanes were converted to a single HOT lane in each direction.
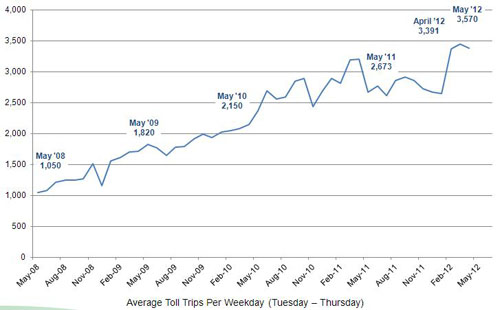
HOT Lanes Usage Continues to Grow
Quarterly Revenue & Expenditures
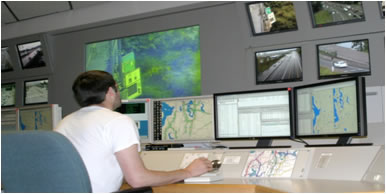
Traffic Management Center
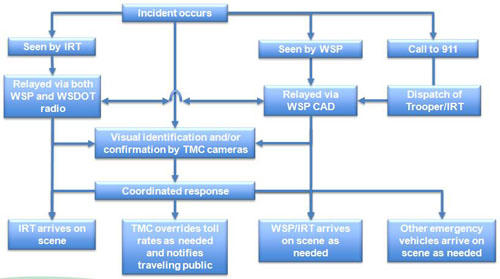
- Monitors live traffic conditions via cameras
- Identifies incidents and blockages
- Coordinates IRT and WSP response efforts
- Continue to fund 1 FTE from toll revenue
Incident Response Teams
- Additional teams added to keep traffic clear and to response times low, for vehicles
in all lanes
- Use of smaller trucks and split shifts for cost savings
- Opened with 2 FTE for IRT operations on SR 167
- Currently funding 1 FTE for SR 167 IRT operations
| |
2008 |
2009 |
2010 |
2011 |
| Monthly Incidents Responded To |
130 |
195 |
180 |
180 |
| Average Response Time (in minutes) |
10.3 |
9.3 |
9.9 |
8.9 |
Washington State Patrol
- Extra patrols in place for HOT lane enforcement
- Visual enforcement
- Reduced from initial all day extra enforcement to peak-hour only for cost savings
- First six weeks: 540 hours/month
- Through September 2010: 240 hours/month
- Currently: 130 hours/month
Incident Response Flow Diagram
Questions?
For more information regarding the SR 167 HOT Lanes, please contact:
Tyler Patterson Toll
Operations
206-716-1134 or PatterT@wsdot.wa.gov
Todd S. Merkens
Toll Development
206-716-1151 or MerkeTo@wsdot.wa.gov
Part 4: Incident Management and Managed Lanes
Brian Kary
Minnesota Department of Transportation
Freeway Operations Engineer
Regional Transportation Management Center
 Shared
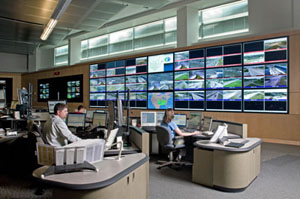
Operations Center
- MnDOT Traffic Operations
- MnDOT Maintenance Dispatch
- State Patrol Dispatch
- 400 miles of freeway management system
- Backbone for Managed Lanes system
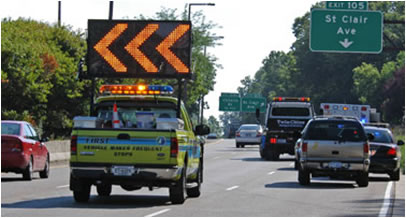
Freeway Incident Response Safety Team
- Monday - Friday
- 5:30 AM to 7:30 PM
- Limited weekend coverage
- 20 Drivers, 2 Shifts
- 12 Trucks
- 250 freeway miles
- "Open Roads" - A statewide policy between MNDOT and State
Patrol to make re-opening roads & lanes a priority.
- "Quick Clearance" - A change in state law 169.041, applies
to Metro district only, gives MSP & MNDOT additional legal force to clear obstructions
promptly.
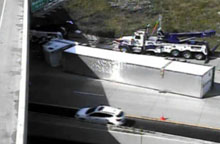
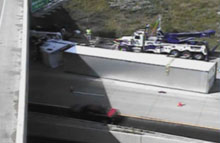
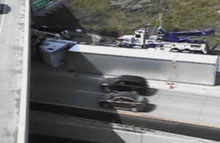
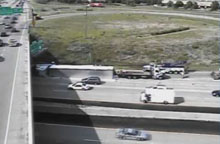
I-94 Truck Rollover

Congestion Pricing in Minnesota
- High Occupancy Toll Lanes
- Provide for faster, safer and more reliable travel options
- Travel benefits for transit, carpoolers, motorcycles and MnPASS customers
MnPASS System
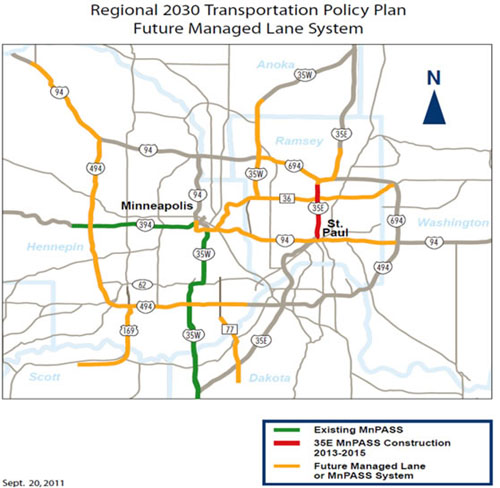
- Opened 11 miles HOT lane on I-394 in 2005
- Opened 16 mile HOT lane on I-35W in 2009/2010
- Planned 4 mile HOT lane on I-35E in 2015
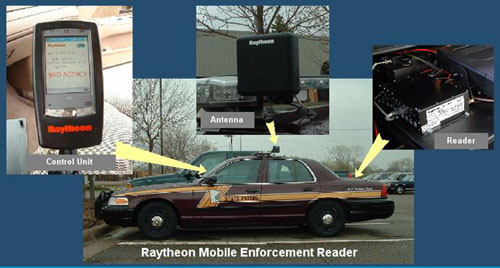
MnPASS Enforcement
- Central Unit
- Antenna
- Reader
- Raytheon Mobile Enforcement Reader
I-35W Smart Lanes
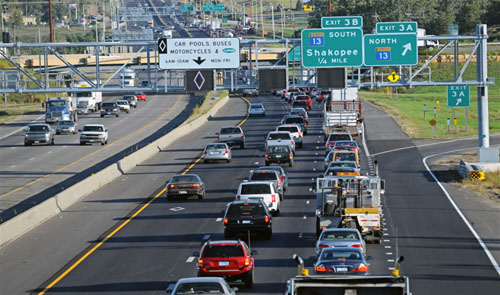
- Intelligent Lane Control Signals (ILCS) located every ½ mile over every lane.
- A total of 187 ILCS.
- ILCS are a 4ft x 5ft full color matrix signs.
- Use of the ILCS is for incident management , speed harmonization and priced dynamic
shoulder lane
ILCS Sign Options
 |
Blank - default |
 |
Green - Lane Open |
 |
Flashing Yellow - Caution |
 |
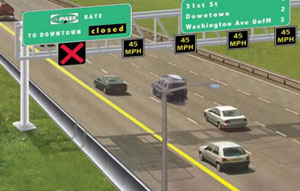
Rex X - Closed |
 |
Yellow X - Closed Ahead |
 |
Merge |
 |
Speed Limit |
 |
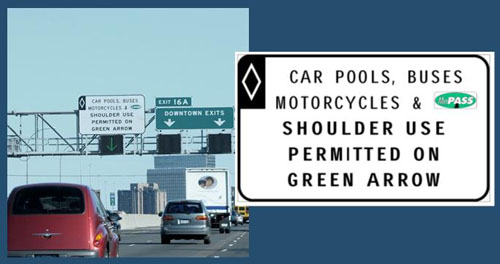
White Diamond |
Variable Speed Limits
- Advisory Only
- Detection measures traffic
- speeds downstream
- Speeds are posted up to 1 ½ miles upstream
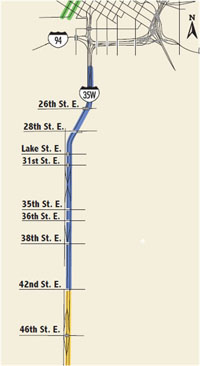
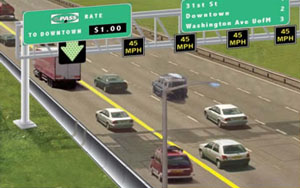
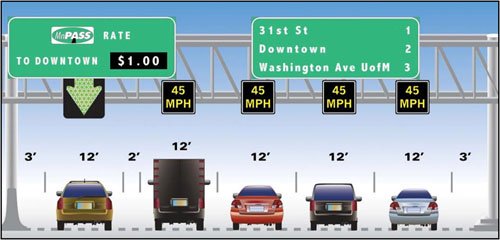
Priced Dynamic Shoulder Lane (PDSL)
- 3 Mile Segment on NB 35W
- Maintains existing 4 lanes with an added PDSL Lane
- Effectively extends the MnPASS lane to downtown Minneapolis using existing road
space
I-35W PDSL Operations
- Monday - Friday
- Can be open on weekends or evenings for special events, weather or incidents.
I-35W PDSL Cross Section
I-35W MnPASS: Regulatory Signing
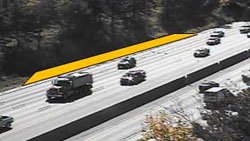
Emergency Pull-Offs
Why we have them:
- Refuge for disabled vehicles and crashes
- Enforcement areas
- Co-located with Maintenance pull-offs
Design considerations:
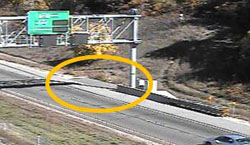 Goal to locate every ½ mile
- 14 ft width, min 200 ft long
Questions?
Brian Kary
Freeway Operations Engineer


 Annual cost of traffic crashes: $299.5
billion (+ 83% from 2008) Average cost per person ≈ $1,522


 HOT lanes ...


 Shared
Operations Center


 Goal to locate every ½ mile