Patrick DeCorla-Souza, Tolling and Pricing Program Manager, FHWA
Lee Munnich, Humphrey Institute, University of Minnesota
Kenneth Buckeye, Minnesota Department of Transportation
John Doan, SRF Consulting
Center for Innovative Finance Support
Federal Highway Administration
Seventh Part of a Webinar Series on Overcoming the Challenges of Congestion Pricing.
Session 7: Pay-As-You-Drive Insurance
Audio:
- Via Computer - No action needed
- Via Telephone - Mute computer speakers, call 1-866-863-9293 passcode 57922142
Presentations by:
Audience Q&A: addressed after each presentation, please type your questions into the chat area on the right side of the screen
Closed captioning was available at: http://www.fedrcc.us//Enter.aspx?EventID=1811816&CustomerID=321
Upcoming Webinars:
Visit https://ops.fhwa.dot.gov/congestionpricing/webinars/index.htm
Recordings and Materials from Previous Webinars: https://www.fhwa.dot.gov/ipd/tolling_and_pricing/resources/webinars/congestion_pricing_2011.aspx
Upcoming Webinars:
September 22, 2011 - Economics of Congestion Pricing and Impacts on Business
October 27, 2011 - Integrating Transit with Congestion Pricing and Increasing Congestion Pricing Acceptance
November 17, 2011 - Best Practices in Parking Pricing
December 15, 2011 - Results of the Urban Partnership and Congestion Reduction Demonstration Programs
Part 1: Role of State DOTs in Promotion
Allen Greenberg
U.S. Department of Transportation
Federal Highway Administration
FHWA Congestion Pricing Webinar
August 25, 2011
Part I: Public Benefits and Public Policy
What are Pay-as-you-drive Pricing and PAYDI?
- Converting hidden and lump-sum costs of auto ownership and usage to transparent, variable costs.
- Such costs may relate to insurance, but also to parking, vehicle taxes and fees, or to the car itself through car sharing.
Why Pay-as-you-drive Pricing?
- Most of the costs of owning and operating a vehicle are fixed.
- The financial incentive not to use personal vehicles heavily is relatively small.
- Many households, especially low-income ones, would prefer variable costs to fixed ones.
- Various studies project substantial driving reductions, public policy benefits, and consumer savings resulting from PAYD pricing.
PAYDI Is Not a New Concept
- As early as 1929, virtues of charging for car insurance by the mile were recognized.
- Concept promoted by Nobel economist William Vickery in his 1968 work: "Automobile Accidents, Tort Law, Externalities and Insurance."
Growing Body of Research Supports PAYD Pricing
- New research from Massachusetts that combines vehicle mileage and loss cost data shows a compelling relationship.
- Host of mostly small instrumented vehicle studies consistently shows a strong linkage between certain driving habits and crashes.
- Actions of insurance companies also suggest actuarial underpinnings for PAYD pricing.
Instrumented Vehicle Studies Support PAYD Pricing
- "100-Car Naturalistic Study" in No. VA found that the 12.5% most dangerous drivers had over 100X the crash risk of the 12.5% safest drivers.
- An Israeli 103-vehicle monitoring study found that aggressive drivers were responsible for 16.6X the crash costs of the safest drivers.
- A 95-driver test of incentives to reduce speeding in Sweden led to a decline in speeding frequency from 15% to 8% of driving time.
New PAYD Incentives
- Created a hypothetical government program providing payments or tax credits equal to 10% of the value of new PAYD pricing.
- Compared against other government programs designed to build infrastructure and to reduce air emissions and fatalities.
- Shown to be far more cost effective than the average Federal transportation emissions reduction program (CMAQ) expenditure and to the cost of providing new infrastructure.
- Cost effective fatality reductions were also demonstrated.
- Examined Federal fuel economy rulemakings for calculation of public costs and benefits of driving miles to establish economically appropriate PAYD incentives.
PAYD Benefits Comparisons 1
| |
Program or Policy Effectiveness |
PAYD Effectiveness |
PAYD Effectiveness w/ 50% Allocation 2 |
| Environment ($ per ton) |
| Congestion Mitigation and Air Quality Improvement Program |
$66,300 |
$2,700 |
$1,350 |
| Safety ($ per life) |
| Hazard Elimination Program |
$532,188 |
$797,388 |
$398,694 |
| Rail-Highway Crossings Program |
$810,618 |
$797,388 |
$398,694 |
| Seatbelts Incentive Grants Bonus Program |
$110,836 |
$797,388 |
$398,694 |
| All Government Crash Costs |
$495,435 |
$797,388 |
$398,694 |
| Infrastructure (¢ per mile) |
All Cost-Beneficial Improvements:
0-2.08 % VMT Growth;
2.08-2.99% VMT Growth |
3.1¢
5.2¢ |
1.65¢ |
|
| Non-Driver Costs (¢ per mile) |
| External and Bundled Internal Costs |
10-15¢ |
1.65¢ |
|
1 PAYD benefits are presented in bold when they outperform the comparison program or concept.
2 Since PAYD provides both environmental and safety benefits, it is appropriate to attribute half of the bonus funding to each of these types of benefits when comparing the efficacy of PAYD with strategies that provide either only environmental or only safety benefits.
Estimated Per-Mile Benefits of Reduced Driving from NHTSA's Rulemakings
| PUBLIC BENEFITS |
|
|
| Monopsony (decreased costs of foreign oil reflecting demand) |
0.9¢ |
|
| Supply disruption risk reduction associated with demand |
0.5¢ |
|
| Congestion reduction benefits |
4.9¢ |
|
| Crash reduction benefits |
2.4¢ |
|
| Criteria air pollutant reduction benefits |
1.2¢ |
|
| Noise reduction benefits |
0.1¢ |
|
| Carbon emissions reduction benefits |
0.1¢ |
|
| SUBTOTAL: PUBLIC BENEFITS |
|
10.1¢ |
PRIVATE BENEFITS
(50% of private savings based on "rule of half") |
|
|
| Average reduced insurance premium (not from NHTSA rules) |
6.7¢ |
|
| Pre-tax gasoline savings (updated using EIA 2009 projections) |
15.2¢ |
|
| SUBTOTAL: PRIVATE BENEFITS |
|
11.0¢ |
| TOTAL OF ALL BENEFITS |
|
21.1¢ |
| BENEFITS OF EACH PAYD INSURED MILE (21.1¢ x 8%) |
|
1.7¢ |
Results of PAYD Insurance
- Cuts vehicle miles traveled
- Curtails crash claims in excess of driving reductions
- Relieves congestion at a rate greatly exceeding driving reductions
- Diminishes air pollution and carbon emissions
- Lowers infrastructure costs
- Strengthens cities and lessens urban sprawl
- Provides substantial consumer savings
- Increases insurance company profits
Features of PAYDI To Maximize Driving Reductions
- Direct and transparent per-mile or per-minute-of-driving pricing - avoid rebates
- In-vehicle graphic displays of "insurance pricing meter" with e-mail and Web summaries
- Frequent billing without automatic bill payment
- Transit pass discounts (instead of bundling with a few free miles of insurance)
- Individualized assistance to identify alternatives
- Peer comparisons and competitions with incentives to encourage continuous mileage reductions
Part II: Role of State DOTs in Promotion
Forge Government Cooperation and Partnerships with Insurance Companies
- Meet with insurances commissioners and staff to help convey public policy benefits of allowing PAYDI offerings.
- In the 14 states with climate action plans that include PAYD insurance, work with environmental agency and insurance commission to promote implementation.
Use Transportation Resources to Encourage
- Congestion Mitigation and Air Quality Improvement (CMAQ) Program funds
- Eligibility under other Federal-aid highway and transit programs
- $1 million in tax credits for PAYDI is available in Oregon
Future Opportunities
- With unstable gas prices and the poor economy, consumers are driving less and are looking to save money (comScore 2010 and 2011 surveys).
- Strategic Highway Research Program study of 2,500 instrumented vehicles is just beginning now, and will provide important data.
- Other forthcoming "before" and "after" data enabling emissions trading dollars (e.g., from Federally-funded pilots in Texas and Washington State).
- Concerted regional efforts using a mixture of funding sources and other incentives.
- The reauthorized Federal transportation program could provide new opportunities, especially around fuel tax alternatives.
Thank you!
Allen Greenberg
U.S. Department of Transportation
Federal Highway Administration
Congestion Management and Pricing Team
1200 New Jersey Ave., SE
HOTM-1, Mail Stop E-84-402
Washington, DC 20590
(202) 366-2425 (ph)
Allen.Greenberg@dot.gov
Part 2: How Insurers Consider PAYDI
David Huber
PAYDI Insurance Industry Consultant and Veteran
davehuberinc@gmail.com
How Insurers Consider PAYDI
- Insurance is obviously about assessing risk; in this case, predicting the frequency and severity of future losses
- The premium needs to cover costs - some of which are known & some of which are not
- Most insurers try to make $.04 on every dollar of premium
- Customer data is used to determine the premium - age, gender, marital status, ymm vehicle, accidents & violations, home ownership, coverages, limits, deductibles
- Pricing sophistication can be a competitive advantage
- Education, insurance history, territory, financial responsibility are predictive and have provided competitive advantages
- Information about how, when & where a vehicle is driven is also predictive - maybe more predictive than the rest
- Until telematics, usage data has been elusive or self-reported
- Insurers are betting that telematics data can give them a competitive advantage
- It's a strategic investment that can be either offensive or defensive
- It extends beyond core competencies
- The economics aren't always crystal clear
- The hurdles are getting lower
Part 3: Usage-based Auto Insurance (UBI)
Robin Harbage, FCAS, MAAA
25 August 2011
©2011 Towers Watson. All rights reserved.

Table of Contents
- Market Update
- Data for Risk-based Pricing
- Forecast of UBI
Market Update
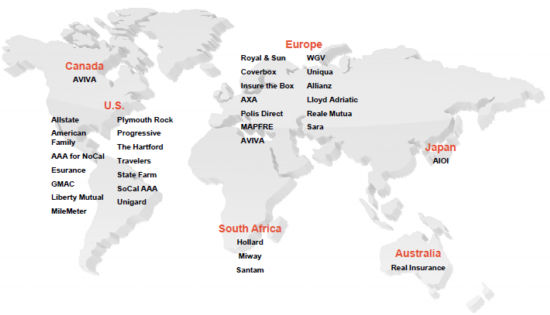
UBI in personal auto around the globe
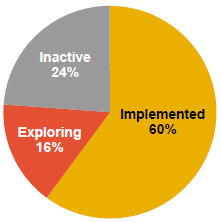
Top 50 U.S. private passenger auto companies - Market overview
- At least six top 10 personal auto insurers have implemented programs to insureds in at least one state
- U.S. companies representing over 75% of the market already have programs or are actively pursuing them
"UBI device sales rocketing from $50 million in 2011 to approximately $2.6 billion by 2015." - FC Business Intelligence
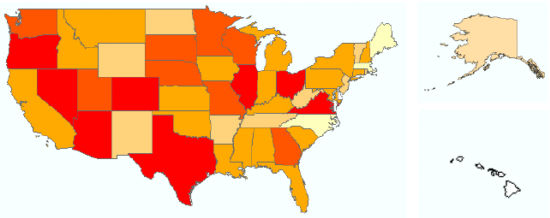
Telematics in personal auto - Geographic presence in the U.S.
- Seventeen states have 4+ Personal Auto UBI programs implemented
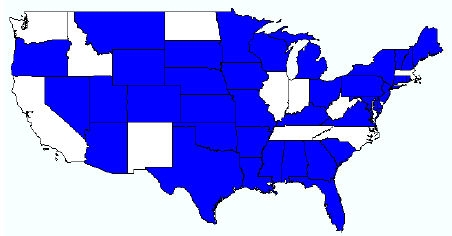
Progressive Snapshot SM - 37 states
"...the mere fact that we're saying we're ready to approach national rollout and advertising, you can infer that we're at a level of comfort that is greater than we have ever been before." - Glenn Renwick, CEO
"More than a quarter of a million drivers have participated countrywide to get personalized sharing a picture of how they drive " - Richard Hutchinson, UBI general manager
Data for Risk-based Pricing
Usage-Based Insurance (UBI)
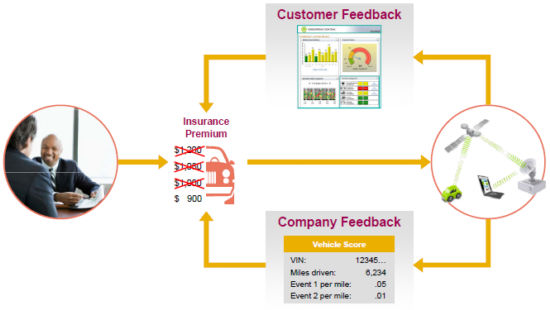
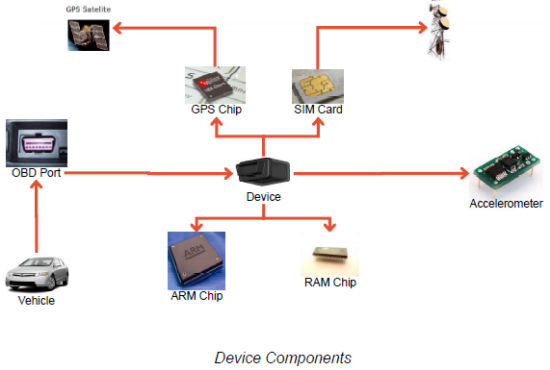
Telematics devices
Components
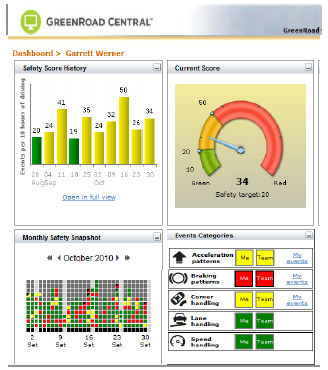
Telematics provides a wealth of Information
Telematics
| Start time |
Start location |
Use of seatbelt |
Roads used |
Use of accelerator |
| Use of brakes |
Speed |
Stop time |
Stop location |
Idling time |
| Time taken |
Mileage |
Time of impact |
Direction of impact |
Impact severity |
| Driver - if camera is installed in vehicle |
Number of passengers - if camera is installed in vehicle |
| Route-based charging |
Local area information |
Insurance rating |
| Vehicle location |
Incident alert |
Incident details |
| Distance-based charging |
Monitoring vehicle usage |
|
Expanding the data
- Even the simplest devices can provide significant value
- Distance
- Time of Day
- Speed
- Other info can be inferred
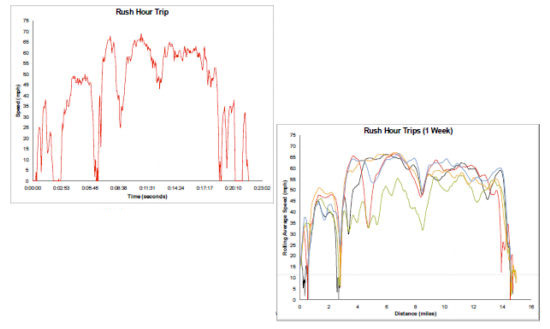
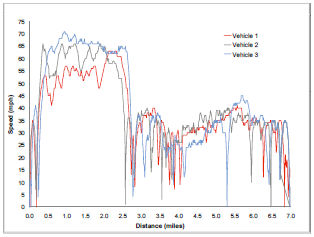
Vehicles have different driving patterns
- Loss costs are impacted by how the vehicle is operated
- Each driver has their own driving habits
- Vehicle 2 is driven more than vehicle 50 1 or 3
- Vehicle 2 has a higher frequency of extreme events
| |
Vehicle 1 |
Vehicle 2 |
Vehicle 3 |
| Avg. Miles Weekly |
181 |
386 |
235 |
| Annual Miles |
9.4K |
20.1K |
12.2K |
| Hard Brakes/Mile |
0.05 |
0.10 |
0.04 |
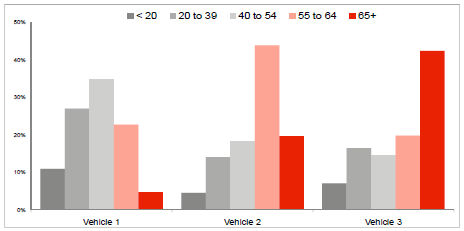
- Vehicles 2 and 3 appear to have more highway miles
- Vehicle 1 is predominantly rush hour
- Vehicle 2 driven during highest frequency times
| |
Vehicle 1 |
Vehicle 2 |
Vehicle 3 |
| Day, Rush |
59% |
16% |
29% |
| Day, Non-Rush |
18% |
40% |
65% |
| Evening |
3% |
24% |
6% |
| Late Night |
0% |
20% |
0% |
Forecast of UBI
Appeals to participating consumers
- Improves driving behavior
- Controllable
- Makes sense and reduces reliance on proxies
- Insurance credit scores
- Driver assignment
- Charges for relatively rare accidents, convictions
- Ancillary services
Proliferation of Device Manufacturers
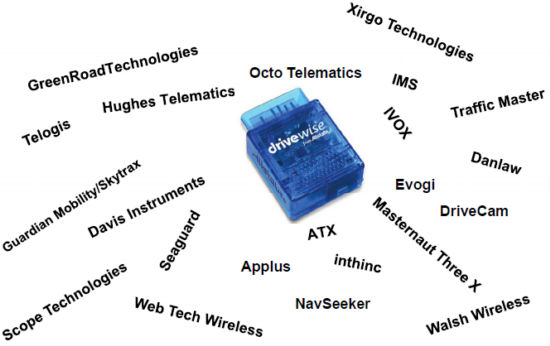
- GreenRoad Technologies
- Xirgo Technologies
- Traffic Master
- IMS
- Octo Telematics
- Telogis
- Hughes Telematics
- Guardian Mobility/Skytrax
- Davis Instruments
- Scope Technologies
- Seaguard
- Web Tech Wireless
- Applus
- ATX
- inthinc
- NavSeeker
- Walsh Wireless
- Masternaut Three X
- DriveCam
- Evogi
- Danlaw
- IVOX
Telematics Devices
Alternative Models
- Dedicated Device
- Insurance pays for device and install
- Need self install to appeal to mass market
- Reasonable cost
- Ease of use
- Shared Services Device
- Device is able to support added value services outside insurance for example
- Satellite Navigation
- Rerouting to avoid Traffic Congestion
- Theft Tracking
- Speed camera warnings
- Emergency Call etc.
- OEM or hard install may be required for these
Technology will change, but data is critical now to get a foothold.
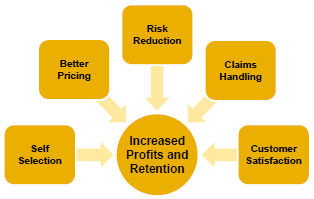
Why is UBI game-changing?
- Differentiates product offering by offering additional services
- Significantly increases pricing accuracy
- Appeals to consumers as it makes sense, is controllable and minimizes reliance on controversial proxies
- Attracts lower-risk insureds via self-selection
- Allows customers to understand and eliminate risky behaviors, actually reducing accident frequency
- Improves claims handling
Contact Details
Robin Harbage
+1 440 725 6204
Robin.Harbage@towerswatson.com


