Patrick DeCorla-Souza, Tolling and Pricing Program Manager, FHWA
Lee Munnich, Humphrey Institute, University of Minnesota
Kenneth Buckeye, Minnesota Department of Transportation
John Doan, SRF Consulting
Center for Innovative Finance Support
Federal Highway Administration
Fourteenth Part of a Webinar Series on Overcoming the Challenges of Congestion Pricing.
Session 14: The Impacts of Congestion Pricing - Lessons Learned from Recent Evaluations - Webinar
Audio:
- Via Computer - No action needed
- Via Telephone - Mute computer speakers, call 1-866-863-9293 passcode 36546155
Presentations by:
Audience Q&A
- Addressed after each presentation, please type your questions into the chat area on the right side of the screen
Closed captioning is available at:
http://www.captionedtext.com/client/profile.aspx?EventID=2228200&CustomerID=321
Upcoming Webinars:
- September 17: The Impacts of Congestion Pricing on Carpooling and Transit - register at http://www.nhi.fhwa.dot.gov/resources/webconference/web_conf_learner_reg.aspx?webconfid=26475
Recordings and Materials from Previous Webinars:
https://www.fhwa.dot.gov/ipd/tolling_and_pricing/resources/webinars/congestion_pricing_2011.aspx
Part 1: National Congestion Pricing Conference
Wayne Berman, FHWA
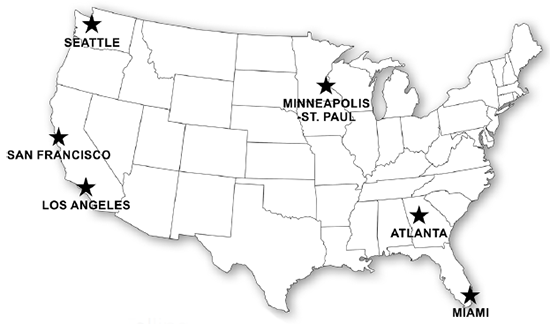
National Congestion Pricing Conference
- July 9-10, 2013 in Seattle, Washington
- Sponsored by FHWA in coordination with TRB Congestion Pricing Committee
- 114 attendees
- Objective: Raise awareness, advance the state-of-the- practice, and identify the research and technology transfer needs in support of deploying congestion pricing strategies in the United States
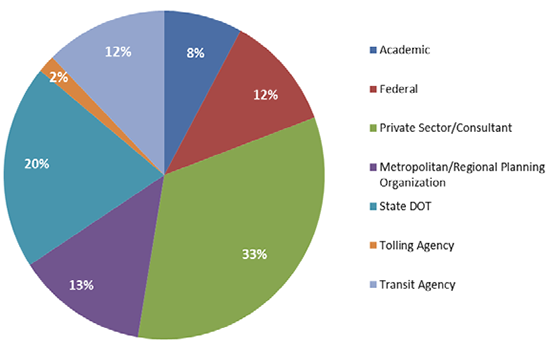
Attendee Mix
- Academic - 8%
- Federal - 12%
- Private Sector/Consultant - 33%
- Metropolitan/Regional Planning Organization - 13%
- State DOT - 20%
- Tolling Agency - 2%
- Transit Agency - 12%
Agenda Topics
- Innovations in Congestion Pricing in the United States over the Past 3 years
- Gaining Support and Buy-in from Elected Officials
- Issues, Impacts, and Lessons Learned in Advancing Congestion Pricing Projects
- Influence of Congestion Pricing on Ridesharing
- Aligning Back Office Capabilities with Policy Goals
- Addressing the Challenges of Acceptability
- Parking Pricing Projects
- Congestion Pricing Projects in Seattle (included site visits)
- Regional Approaches for Implementing Congestion Pricing
- Experiences in Evaluating Congestion Pricing
- Putting It All Together - A Year of Learning and the Year Ahead
Key Conference Outcomes
- System-wide pricing is needed to sustain funding for transportation
- Priced networks, being implemented in many metro area, will be the focus of research and innovation for the next several years
- Political support for pricing projects must span political parties and reach from urban core to exurbs
- Transit benefits have been substantial on recently implemented projects
- Parking pricing - Integrate as key element of regional pricing program
- Need to clearly define pricing objectives up front, communicate it broadly, and use it to guide project decisions
- Articulate a "value proposition" to the public for pricing project - don't "sell" on need to raise revenue
Part 2: National Evaluation of Urban Partnership Agreement & Congestion Reduction Demonstration: Early Findings

Urban Partnership Agreement/Congestion Reduction Demonstration Program
Katie Turnbull
Texas A&M Transportation Institute
September 13, 2013

Presentation Overview
- National Evaluation Overview
- Individual Site Results
UPA/CRD Partners
4 'T' Strategies - Tolling, Transit, Telecommuting/TDM, Technology
National Evaluation
- Sponsored by U.S. Department of Transportation to:
- Assess Impacts of strategies
- Provide information to support deployments in other areas, including lessons learned
- Help inform federal policy and program development
- Team Approach - U.S. DOT, Local Partners, National Evaluation Team
- Battelle (Prime), TTI, CUTR, U of Minnesota Humphrey School, ESTC
Evaluation Analyses
| USDOT 4 Evaluation Questions |
→ Evaluation Analyses |
A. How much congestion was reduced?
B. What are the associated impacts of the congestion reduction strategies?
C. What are the lessons learned?
D. What is the overall cost/benefit of the strategies? |
- Congestion
- Strategy performance
- Tolling
- Transit
- Telecommuting
- Technology
- Equity
- Environmental
- Safety
- Non-Technical Success Factors
- Cost/Benefit
|
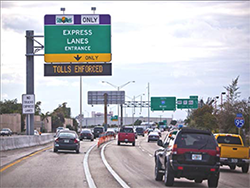
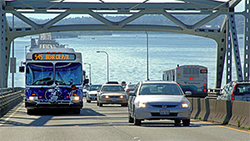
Miami UPA Final Evaluation - 95 Express
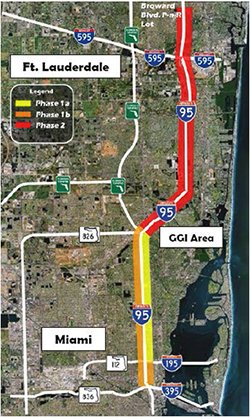

Miami UPA Projects
- 95 Express - HOV2+ to HOT3+
- 3 Phases
- Phase 1A: Dec. 2008
- Phase 1B: Jan. 2010
- Phase 2: Mid-2014
- 2 HOT lanes in both directions
- Registered 3+ carpools and hybrid vehicles, motorcycles, toll-free
- Enhancements to Transit
- New routes, additional park & ride spaces, transit signal priority
Miami UPA Evaluation
- Miami UPA "self-evaluated" with national evaluation team monitoring and advising
- Key Findings:
- Reductions in congestion in HOT and general purpose lanes
- Express bus ridership increased
Miami Congestion Analysis
 Average Peak Period Traffic Flow Improved
- 2008: 20 mph or less in HOV and GP
- 2011: HOT 61-to-51 mph, GP 47-to-35 mph
- 2013: HOT 62-to-55 mph, GP 46-to-38 mph
- Change in the Average Peak Volume
- HOT lanes - 8,900 in 2011 to 9,700 in 2013
- GP lanes - 18,400 in 2011 to 17,900 in 2013
Miami Tolling Analysis
- Peak period tolls average $2.33 SB, $2.90 NB in February 2013, highest $7.00
- Monthly toll revenues increased from $740,000 in January 2010 to $1.72 Million in February 2013
- Peak period HOV2 shifted from HOT to GP lanes, HOV3 declined in both lanes in 2010
- But, HOV3 appears to have grown: now about 4-5K in HOT lane in 2013 (peak and non-peak) vs. 357 in peak in 2010
- Hybrids currently account for 50% of non-tolled trips
Miami Transit Analysis
- Express Bus Service Has Improved
- Average travel speed increased from 18-to-55 mph
- Travel time decreased from 25 to 8 minutes
- Ridership Has Increased
- Average weekday ridership increased from 1,827 to 2,877 (57%) between 2008 and 2010 and to 4,500 by Aug. 2011
- 2010 Survey
- 72% of riders new since tolling began
- 53% of riders said tolling affected their decision to use transit
Minnesota UPA -
Final Evaluation
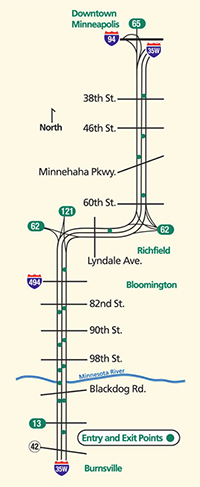
Minnesota UPA Projects
- Tolling
- I-35W HOV lanes to dynamic-priced HOT lanes
- I-35W New HOT lanes and priced dynamic shoulder lane (PDSL)
- Transit
- 6 new or expanded park-and-ride lots
- 27 new buses
- Marquette and Second (MARQ2) dual bus lanes in downtown Minneapolis
- Technology
- Real-time transit and traffic signs
- Driver assistance for shoulder-running lanes
- Telecommuting: eWorkPlace
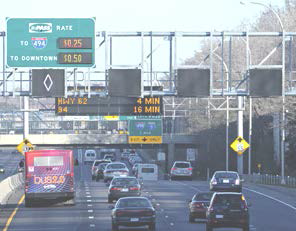 I-35W MnPASS HOT Lanes
Minnesota UPA Evaluation
- Difficult to Separate Effects of Various UPA Elements and from GP Lane Expansion on Crosstown Commons
- Highlights of Findings:
- Post-tolling improvements in travel in HOT and GP lanes
- Transit usage increased and performance improved
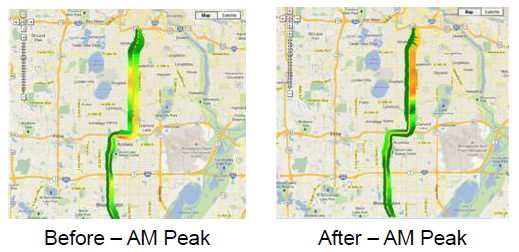
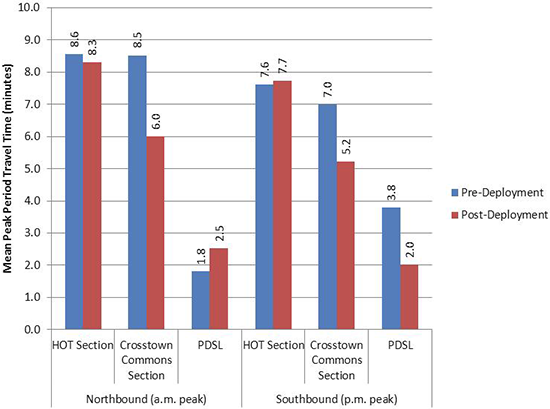
Minnesota Congestion Analysis
- Peak-Period, End-to-end Average Corridor Travel Times Improved
- GP lanes: 2.1 min. NB, 3.4 min. SB
- Tolled lanes: Chart
- Average Travel Speeds Increased
- Increased Total and Per-lane Vehicle Throughput
- Majority of Survey Respondents Said "Travel Easier and Less Congested"
Minnesota Tolling Analysis
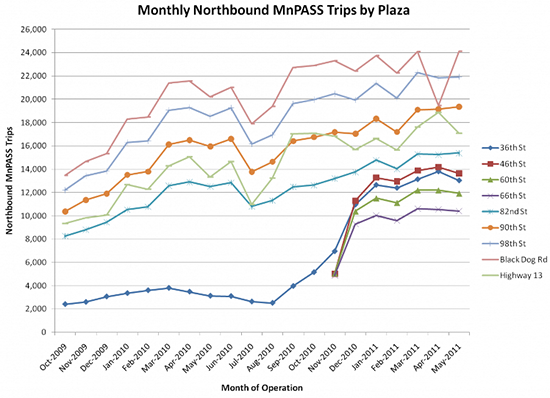
- As of April 2013 Monthly Trips Reached 73,260, Average Toll $1.71, and Maximum Average $5.00 - 7.00
- Increased Use and Throughput in Corridor
- Some Shift to HOT Lanes from GP and HOVs Have Remained
- Reduced Violations
I-35W HOT Lane Use - AM Peak Period
| |
4th Quarter 2008 |
2nd Quarter 2011 |
| Vehicles |
% |
Vehicles |
% |
| Total Vehicles |
2,068 |
|
2,969 |
|
| Carpools/Vanpools |
1,718 |
83% |
1,784 |
60% |
| Tolled at Black Dog Road |
0 |
|
967 |
33% |
| - |
| Transit Buses |
47 |
2% |
54 |
2% |
| SOVs (Violators) |
303 |
15% |
164 |
5% |
I-35W MnPASS Trips by Plaza
Transit Analysis
- On I-35W South o Bus speeds increased
- Bus travel times decreased
- Park-and-ride lot usage grew by 641 vehicles
- Ridership increased by 13%
- MARQ2 Lanes
- Bus speeds increased
- Bus travel times decreased
- Trip-time reliability increased
- Consolidated bus routes
- Removed buses from Nicollet Mall
- Positive feedback riders & operators
Atlanta CRD
Draft Final Evaluation

Atlanta CRD Projects
- HOV2 to HOT 3+ Conversion on 16 Miles of I-85
- Toll tag and pre-registration for HOV3+ required
- Transit Enhancements on I-85 CRD Corridor
- 12 new buses, 3 new routes, 2468 more parking spaces at 3 new and one expanded park-and-ride lots
- Technology-enhanced Enforcement Systems
- RFID toll tag and video camera images of license plates identify toll violators automatically
- Mobile automated video license plate readers in enforcement vehicles alert officers to check occupancy in HOV3+ vehicles
- Outreach to Convert Registered HOV2+ to HOV3+ Users
Atlanta CRD Area
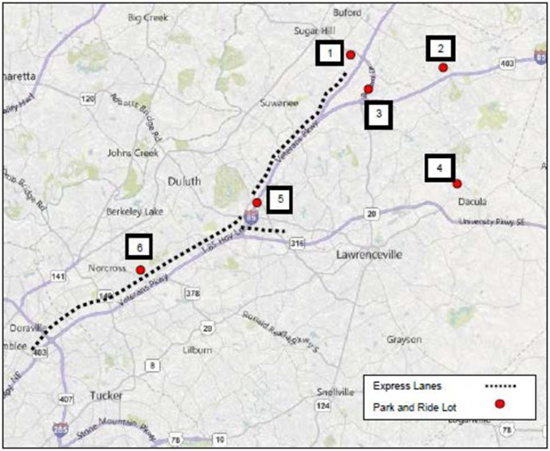
CRD-funded P&R Lots: 1, 2, 3, 4
Preliminary Evaluation Findings
- Findings Reflect One Year of Post-Deployment Data Gathered Through September 2012
- Findings To-Date indicate:
- Express Lanes provided modest improvements to users during the first post-deployment year
- Congestion in general purpose lanes increased
- Xpress Bus ridership and use of park-and-ride lots increased on CRD-funded routes and lots
- Express Lane transponder violations decreased
Atlanta CRD Congestion Analysis Findings
- Based on Peak Period GDOT Sensor Data Before & After Tolling
- Average Peak Period Corridor Travel Times
- GP - 5% a.m. and 10% p.m. longer
- Express Lanes - 2% a.m. and 4% p.m. shorter
- 2-to-3 minute travel-time advantage in Express Lanes over GP, with SRTA reporting greater advantage in EL based on transponder data
- Travel Speeds
- GP - 2-to-5 mph slower
- Express Lanes - 1-to-2 mph faster
- Vehicle Throughput
- GP - 3%-to-4% lower
- Express Lanes - 3% lower
- Person Throughput (including transit) Across All Lanes
- 6% decrease in the a.m. peak and a 1% increase in the p.m. peak.
Atlanta CRD Tolling Analysis
- July 2011 - September 2012 - 233,180 Peach Pass Accounts and 353,708 Transponders Issues
- Monthly Trips - 159,799 in October 2011, 387,935 in September 2012
- Average Daily Weekday Toll - $1.19 in October 2011 and $1.47 in September 2012
- Median Usage was 2 trips Per Month for Both Tolled and HOV3+ Users
- Approximately 7% of Users Switch Between Tolled/Non-tolled Status
- Carpooling - HOV3+ Usage Has Remained Steady At 29,300 Per Month in Both Directions, Field Occupancy Study Suggests Many 2-Person Carpools Have Moved to GP Lanes
- Transponder Violations Declined from 15% in February 2012 to 6% by September 2012
Atlanta CRD Transit Analysis
- Xpress bus Peak-period Travel Times on 8 Routes Improved by 2.4% in A.M. and 5.0% in P.M.
- Park-and-ride Lot Usage Grew in New CRD-funded Lots, declined in Other I-85 Lots
- Ridership Increased on Three New CRD-funded Routes Serving New P&R lots, but Decreased on Other I-85 Routes and Regionally
- Overall, Peak-period Transit Ridership Increased 27% in A.M. and 17% in P.M. From 2010 to 2012
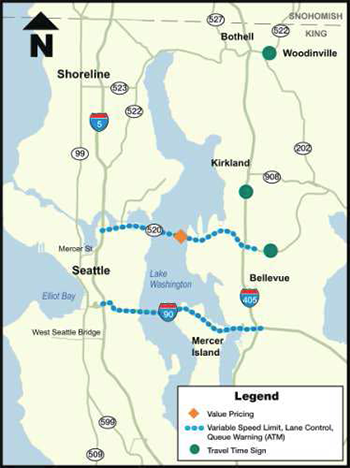
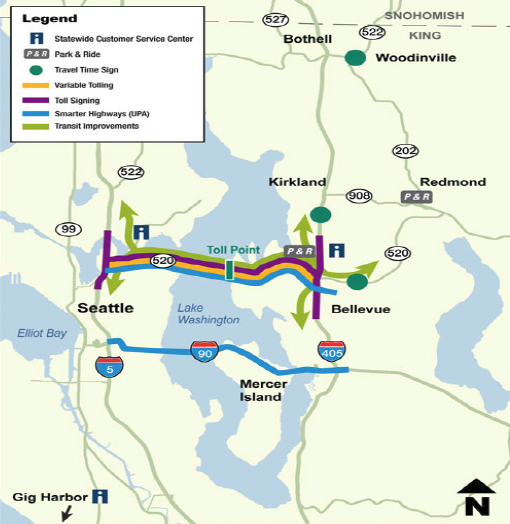
Seattle/Lake Washington Corridor
UPA Preliminary Final Evaluation
Seattle UPA Projects
- Variable Tolling on SR 520 Bridge
- Real-Time Travel Time Signs on I-405, SR 520, and SR 522
- Active Traffic Management (ATM) Strategies on SR 520 and I-90
- Transit Improvements - 44 New Buses, Additional Bus Trips, Park-and-Ride Lot Improvements
- Vanpool and Carpool Programs
Seattle UPA Congestion Analysis
- SR 520 - Travel Times Reduced, Average Peak Period Travel Speeds Increased, Trip-time Reliability Improved, VMT reduced
- I-90 - Travel Times Increased or Remained the Same, Average Peak-Period Travel Speeds Declined, Trip-time Reliability Degraded, VMT increased
- I-5, I-405, and SR 522 - Mixed Results
- Survey and Interview Results
- Congestion reduced on SR 520
- Congestion increased on I-90
Seattle UPA Tolling Analysis
- 275,308 Good To Go! Accounts Opened February 2011 to December 2012
- Variable Toll Rates By Time-of-day
- Peak period Good To Go! - $3.59
- Peak period Pay by Mail - $5.13
- No toll - 11:00 p.m. to 5:00 a.m.
- Decline in Number of Trips on SR 520
- Survey results
- Fewer trips reported on SR 520 since tolling
- Trip satisfaction increased in SR 520, but declined on I-90
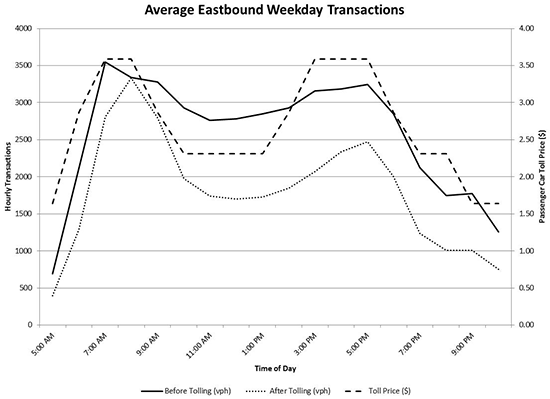
Source: Texas A&M Transportation Institute, based on data from WSDOT, July 2013. SR 520
Bridge Average Eastbound Weekday Pre- and Post-Deployment Toll Transactions.
Seattle UPA Transit Analysis
 90-to-140 Bus Trips Added to SR 520
- Bus Travel Times on SR 520 Remained About the Same
- Peak Period Ridership on SR 520 Increased by 46%
- Survey Results
- Riders report SR 520 less congested
- New riders due to tolling
- Riders report faster travel times
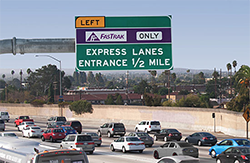
Los Angeles CRD
Draft Early Results

Los Angeles CRD Projects
- ExpressLanes - HOV to HOT on I-110 and I-10
- Transponders required for carpools
- Second HOT lane added on I-10
- I-10 HOV3+ toll free, HOV 2 toll free off peak, HOV 2 toll peak periods
- I-110 HOV 2 toll free
- Equity plan accounts
- Transit Improvements
- 59 new buses and added service
- Transit station expansions
- Downtown transit signal priority
- Community-Based Vanpool Formation
- Intelligent Parking Management - LA ExpressPark
Los Angeles CRD Congestion Analysis
 I-110 Average A.M. Peak Period Travel Time Decreased in GP and ExpressLanes, Except Southbound GP with Sight Increase
- I-110 Average A.M. Peak Period Vehicle Throughput Declined in Both GP and ExpressLanes, Except Northbound ExpressLanes
Los Angeles CRD Tolling Analysis
- 139,249 FasTrak Accounts Opened and 167,759 Transponders Issued from July 2012 to May 2013
- Monthly I-110 Toll Transactions Increased from Approximately 643,000 in November 2012 to 1,173,000 in January 2013
- 60% of ExpressLane Users were HOV 2+ and 40% were SOVs
- I-110 Average Posted A.M. Toll Rate $5.40 in November 2012, $5.33 in January 2013
- I-110 Maximum Posted A.M. Toll Rate $10.85 in November 2012, $10.10 in January 2013
Los Angeles Transit Analysis
- I-110 Segment of the Silver Line BRT
- Transit travel times remained relatively constant
- Transit on-time performance increased
- Average daily peak period ridership increased by 52% in the a.m. peak period and 41% in the p.m. peak period after CRD-funded service was added, and again by 29% in the a.m. peak period and 25% in the p.m. period after tolling began
- Survey Results Indicate
- Customer satisfaction with frequency of service increased, but availability of seats and parking availability declined
- 62% new riders
- 33% used to drive alone
- 78 New Registered Vanpools Formed
Summary
- HOT Lane Use Continues to Increase
- Congestion Reduced
- Transit Ridership Increased
- User Perceptions Generally Positive
Questions?
Part 3: What Do People Think About Congestion Pricing?
A Deliberative Dialogue with Residents of Metropolitan Washington
Presentation on the MWCOG Study on the Public Acceptability of Congestion Pricing
John Swanson, Principal Transportation Planner
Metropolitan Washington Council of Governments
Webinar on Congestion Pricing
September 13, 2013
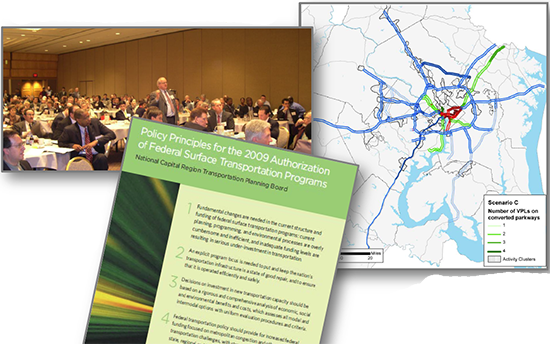
A decade of work on pricing at the MPO
- Regional Conference on Value Pricing (2003)
- TPB Policy Principles (2008)
- Scenario Analysis: VPL Network (2008) CLRP Aspirations (2010)
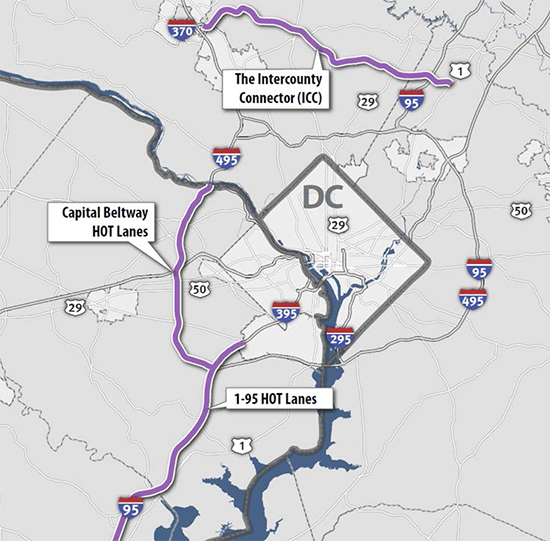
Value pricing projects in the region
- Intercounty Connector (ICC)
- Added to the CLRP in 2004
- Largely opened 2011
- Beltway HOT Lanes
- Added to CLRP in 2005
- Opened 2012
- I-95/I-395 HOT Lanes
- Added to CLRP in 2007
- Under construction (I-95)
Brookings Institution proposal
- Authored by Alice Rivlin & Benjamin Orr in 2009
- "proposes replacing state gas taxes with regional road-use pricing"
- "A demonstration project should be launched in the Washington region that uses GPS transponders to categorize motorists' travel"
Joint research project
- Grant awarded in 2011 from the FHWA's Value Pricing Pilot Program
- Research partners:
- TPB & the Brookings Institution
- Public engagement consultant:
Research Problem
- Transportation revenues are decreasing and congestion is increasing
- Congestion pricing is a tool that could partially solve these twin challenges
- But officials assume that support for congestion pricing is very low.
Research Questions
- As people learn more about congestion pricing, will their attitudes about it change?
- Upon which factors (costs and benefits) does their acceptance hinge?
- What factors matter to people?
- How strongly do people feel about those factors?
- What factors cause people to change their minds? Research Questions
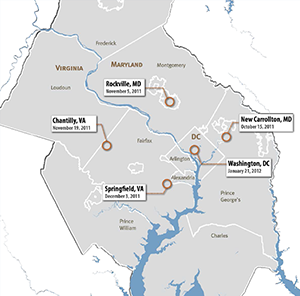
Deliberative Forums

Sampling the region
- Five forums
- October 2011-January 2012
- Each forum lasted 4½ hours
- More than 300 paid participants
- Broadly representative of the region
"Why are you here?"
How we explained the forums to participants:
- Congestion pricing is a type of road tolling that could help solve our funding and congestion problems.
- But, do you believe the benefits are worth the costs?
Let's talk about it...
Baseline Information
Big challenges ahead
- Severe congestion
- Funding shortfalls
What are the costs of congestion?
For the average driver in 2010:
- Time: More than 100 hours of delay
- Money: value of lost time is more than $2,000
Why is funding so tight?
Gas taxes haven't been increased in years
| |
Tax Per Gallon |
Year of Last Increase |
| Federal |
18.4 cents |
1993 |
| Virginia |
17.5 cents |
1986 |
| Maryland |
23.5 cents |
1992 |
| D.C. |
23.5 cents |
2009 |
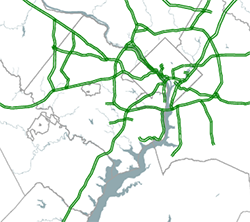
Scenario I: Priced Lanes on All Major Highways
What if...
All major highways had at least one tolled lane with free-flowing traffic?
Scenario 2: Pricing on All Streets and Roads
What if...
Instead of paying gas taxes, drivers paid per-mile fees calculated by GPS?
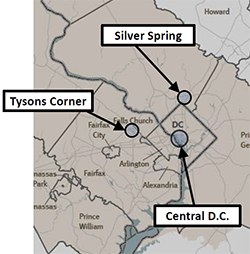
Scenario 3: Priced Zones
What if...
Drivers had to pay to enter central Washington, DC, Silver Spring, or Tysons Corner?
Data Sources
A combination of qualitative and quantitative data:
- Keypad poll questions (including demographics)
- Scribe notes
- Paper surveys
Small groups discuss benefits and costs

Scribes record discussions

Theme teams summarize comments

Polling questions throughout the day

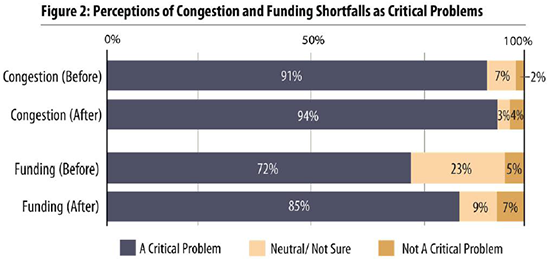
How do people see the region's transportation problems?
- Congestion has deep personal impacts
- Funding shortfalls do not resonate
- Many people are unaware of how transportation is currently funded or that gas taxes haven't been raised in 20 years
- People lack confidence in government to solve transportation problems.
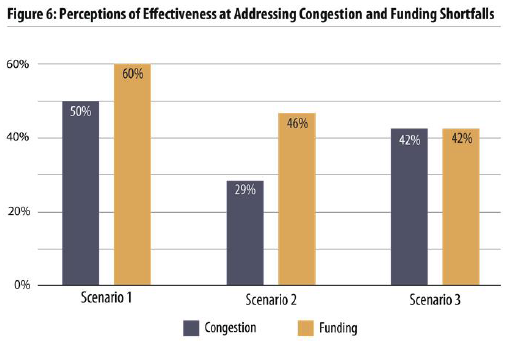
How did people react to the pricing scenarios?
- Scenario 1: Priced Lanes on All Major Highways
- Garnered the most support
- Offers choice and predictability
- Scenario 2: Pricing on All Streets and Roads
- Strong negative reactions
- Concerns about privacy, complications, impracticality
- Scenario 3: Priced Zones
- Seemed logical and straightforward to participants
- Was not seen as regional
Scenario 2: People did not support replacing gas taxes.
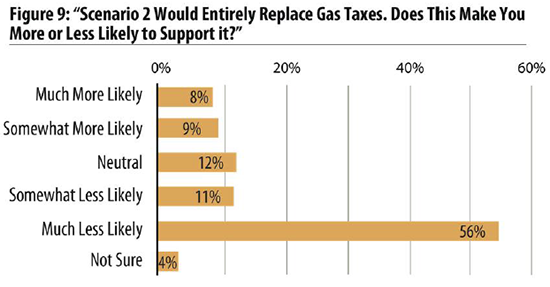
Overall: People were skeptical about the effectiveness of the scenarios, particularly in reducing congestion.
What's the basis for people's opinions?
- Choice: Pricing must provide options.
- Privacy: Significant concerns. People are worried about government overreach and a loss of control.
- Effectiveness: Doubts about whether pricing will actually work.
- Use of revenues: Guarantee transparency and accountability.
- Fairness: Not pivotal.
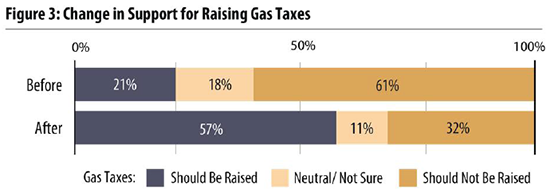
At the end of the forums, what did people think?
- Support for raising gas taxes tripled.
What does it mean?
People are:
- Skeptical of pricing as an overall solution, but they may support specific proposals if they see direct daily benefits.
- More concerned about losing options than they are about "Lexus Lanes."
- Lack confidence in government and fear government overreach.
- More likely to support obvious solutions - such as increasing gas taxes - than radical approaches like congestion pricing.
- Want to know that congestion pricing is part of a wider strategic vision.
For more information
https://www.mwcog.org/documents/2013/09/18/what-do-people-think-about-congestion-pricing-hot-lanes-congestion-pricing/
John Swanson
jswanson@mwcog.org
Benjamin Hampton
bhampton@mwcog.org
Thank you!
Part 4: Effects of Congestion Pricing on Traveler Behavior
Evidence from a Panel Study in Seattle's SR-520 Corridor
Volpe - The National Transportation Systems Center
Advancing transportation innovation for the public good
U.S. Department of Transportation
Research and Innovative Technology Administration
John A. Volpe National Transportation Systems Center
Study Motivation
- Since UPA/CRD are demonstration programs, strong emphasis on evaluation and learning
- FHWA-sponsored evaluation at all six UPA sites, plus in-depth household surveys in Seattle and Atlanta to study impacts on traveler behavior
- Survey addresses the impacts of tolling on:
- Route and mode choice
- Trip departure times
- Origin-destination patterns
- Overall VMT and daily travel time budgets
- Carpooling
- Telecommuting
- Equity
Outline
- Survey Methodology Summary
- Key Findings from Seattle
- Discussion / Future Work
Approach and Methodology
- Household Panel Study: same households before and after tolling
- 2-day travel diary plus questions on demographics, typical commute, technology ownership, attitudes and values
- Sample corridor users
- Drivers: license plate capture during AM and PM peak, with match to registered address; mail study invitations to households
- Transit intercept in-person
- Vanpool members: via email to vanpool participants
- Invite ALL adult members of household to participate
- Online survey with option to take by phone
- Pilot Study
- Incentives ($15/$30 Amazon gift card)
- Panel maintenance
 Focus groups in Seattle to get initial impressions of tolling & refine Wave 2 survey
- Weighting of data to adjust for stratified sampling approach
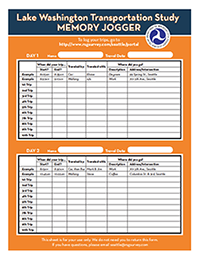
Survey Invitation
- Advance notification postcard
- Introductory letter
- FAQs
- Memory Jogger
- Reminder postcards and emails
Overall Response and Sample Size Summary
| |
Seattle |
Atlanta |
| Net Survey Invitations |
31,873 |
37,888 |
| Wave 1 Completed Households (Entire Survey Completed by All Adult Household Members) |
3356 |
2412 |
Wave 1 Response Rate
(As Share of Initial Contacts) |
10% |
6% |
| Households Retained in Wave 2 |
2063 |
1655 |
| Wave 1 to Wave 2 Panel Retention Rate |
61% |
69% |
| Overall Response Rate (as Share of Initial Contacts, by Mode) |
6% |
4% |
Sample Demographics
- Panels were demographically similar to other survey samples of their regions/corridors
- However, compared to the Census, there were higher levels of education and income; more respondents from middle age groups
Seattle: SR-520 Project Overview
- Weekday toll schedule as of spring 2012:
| |
Toll Tag |
Pay by Mail |
| 5-6 AM: |
$1.60 |
$3.10 |
| 6-7 AM: |
$2.80 |
$4.30 |
| 7-9 AM: |
$3.50 |
$5.00 |
| 9-10 AM: |
$2.80 |
$4.30 |
| 10 AM - 2 PM: |
$2.25 |
$3.75 |
| 2-3 PM: |
$2.80 |
$4.30 |
| 3-6 PM: |
$3.50 |
$5.00 |
| 6-7 PM: |
$2.80 |
$4.30 |
| 7-9 PM: |
$2.25 |
$3.75 |
| 9-11 PM: |
$1.60 |
$3.10 |
| 11 PM - 5 AM: |
Free |
Free |
External Factors
- Gasoline prices: increased 35% from Wave 1 ($3.06) to Wave 2 ($4.13)
- Transit fares: base Metro bus fare up $0.25 per ride since Wave 1
- Employment levels: total nonfarm employees in region about 3% higher in Wave 2
Results: Overall Travel
- Significant drop in overall corridor travel, especially on SR-520
- Not offset by any increase in off-corridor travel
- Diary data consistent with respondents' self-estimates of "typical" weekly travel
Travel Diary Summary, Wave 1 to Wave 2
| |
Trip Count |
Imputed VMT |
| Overall Corridor |
-18% |
-23% |
| SR-520 |
-43% |
-50% |
| I-90 |
-13% |
+1% |
| Non- Corridor |
-13% |
-9% |
| TOTAL |
-14% |
-17% |
"I do what I can to avoid the premium rate and any travel to Seattle that isn't necessary, i.e. I used to hop over to the U-Village or City People's on a regular basis. Not any more."
Mode Choice
- Transit mode share on corridor rose from 15% to 18%
- Share of commuters reporting transit as a "typical" commute mode rose 1.5 percentage points
- Avoiding tolls was common motivation for switching to transit (45%) but respondents also mentioned reduced stress (44%) and gasoline costs (39%); few cited improved bus service (8%)
"I have also been taking the bus with some frequency. I expected to be inconvenienced by these changes, but surprisingly, I do not feel that way. I enjoy my new travel arrangements."
Route Choice
- SR-520's share of corridor trips fell, while shares for I-90 and SR-522 both increased
- 86% of those who switched from SR-520 to I-90 or SR-522 cited avoiding the toll as a motivation; no other factor came close
Summary of Lake Wash. Corridor Trips by Route/Mode
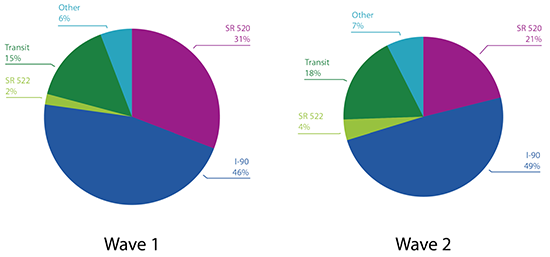
| Wave 1 |
Wave 2 |
- SR 520 - 31%
- I-90 - 46%
- Transit - 15%
- SR 522 - 2%
- Other - 6%
|
- SR 520 - 21%
- I-90 - 49%
- Transit - 18%
- SR 522 - 4%
- Other - 7%
|
Trip Purpose
| Biggest Drops in VMT, Wave 1 to Wave 2 |
Most Stable, Wave 1 to Wave 2 |
| Shopping |
-29% |
Social/rec. |
+1% |
| Dining |
-29% |
Child care |
-1% |
| Pick-up/Drop-off |
-27% |
Return home |
-14% |
| School |
-26% |
Go to work |
-17% |
"We have greatly reduced our trips to the eastside, except for our child, who takes a school bus now."
Vehicle Occupancy
- Mean private vehicle occupancies rose slightly on corridor, 1.48 to 1.56
- On SR-520, rose from 1.42 to 1.61; solo trips fell from 76% to 69%
- However, no indications of a major shift to carpooling for commuting; held steady at 13%-14%
Telecommuting
- Two measurements: recorded telecommuting on assigned travel days & self-reported typical telecommuting
- Both showed no significant change from Wave 1 to Wave 2
- About 15% of employed respondents telecommuted during at least part of one assigned travel day
- In follow-up questions, any changes to telecommuting patterns were most frequently attributed to work-related factors, not transportation- or toll-related
"It has motivated us to take transit or telecommute as much as possible, but that's not always do-able."
Trip Departure Time
- Little net change in the peak vs. off-peak distribution of trips in the corridor
- On I-90, peak share fell from 61% to 56%
- On SR-520, peak share rose from 53% to 57%
"Because traffic has increased on the I-90 bridge due to the 520 tolling, I leave 15 minutes earlier from both home and work to try to beat the congestion on Mercer Island."
"Decreased traffic means I can sleep in later in the morning and get to/from work faster."
Origin-Destination Patterns
- Cross-lake travel declined slightly more than overall travel (-18% vs. -14%)
- Open-ended comments frequently mention staying on own side of Lake Washington
- Otherwise, there do not appear to be other large shifts in overall O-D patterns
- We are analyzing in GIS in more detail
Tracking the Choices of SR-520 Users
- Among those using SR-520 as their primary route in Wave 1:
- 55% were still using it in Wave 2
- 24% switched to I-90
- 7% switched to SR-522
- 8% switched to transit
- 4% switched to another route/mode
- 1% no longer crossed the lake regularly
- Those who switched to I-90 were more likely to be male, lower-income, with less schedule flexibility
Trip Satisfaction Ratings
- There was a significant increase in trip satisfaction levels on SR-520
- For example, for peak-period trips, mean score on satisfaction with travel speed on SR-520 rose from 3.4 to 5.2 (on 7-point scale)
- Satisfaction with I-90 trips fell slightly, especially among existing I-90 users
- On transit, satisfaction was mixed: up slightly for travel time, down slightly for seating availability
Equity Issues and Toll Payment
- Transponder ownership and use of pay-by-plate were both correlated with higher incomes
- Higher income HHs generally paying more tolls
- Highest income HHs (>$200K) recorded about $3 in tolls paid over 2-day period, vs. about $1 for HHs under $50K
- Avg. toll paid was roughly equal (c. $3) - difference was in the number of trips
- Lower-income HHs cut back on travel much more
- HHs below poverty level: VMT down 48%, cross-lake trips down 38% (esp. in "discretionary" trip categories)
- HHs over 10 times poverty level: VMT down 14%, cross-lake trips down 19%
Recap of Key Survey Findings
- Significant decline in overall Lake Washington corridor travel, particularly on SR-520
- Diversion to toll-free alternative routes & transit
- Small increases in vehicle occupancy on SR-520
- Some small variations in trip-making behavior by purpose and destination
- Little to no change in telecommuting
- Demographic differences between those who stayed with SR-520 vs. switched to I-90
- Significant increase in trip satisfaction levels for trips on SR-520
- Differences in response to tolling among income groups
Planned Future Work
- GIS-based analysis of changes in origin-destination patterns
- Archiving of anonymized survey data for use by other researchers
Thank you!
Sean Peirce
617-494-3156
sean.peirce@dot.gov


