A way of harnessing the power of the market to reduce the waste associated with traffic congestion.
Shifting some rush hour highway travel to other transportation modes or to off-peak periods
By removing a fraction (even as small as 5 percent) of the vehicles from a congested roadway, pricing
enables the system to flow much more efficiently, allowing more cars to move through the same physical
space
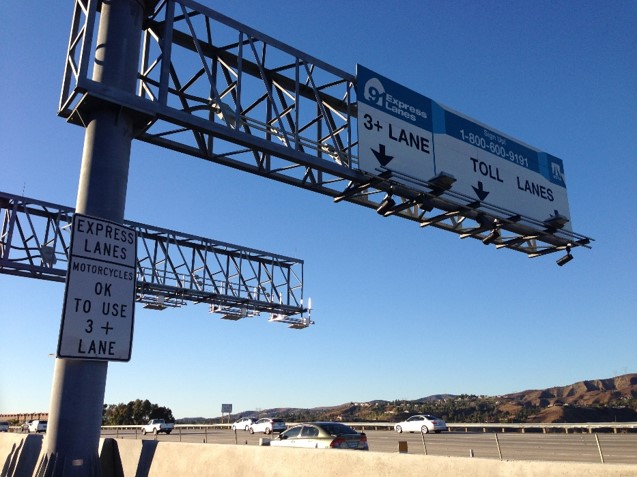
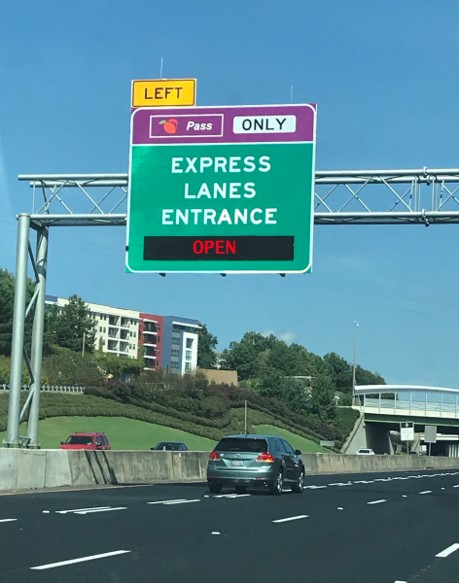
Congestion pricing projects can be grouped into two broad categories: (1) projects involving tolls and
(2) projects not involving tolls
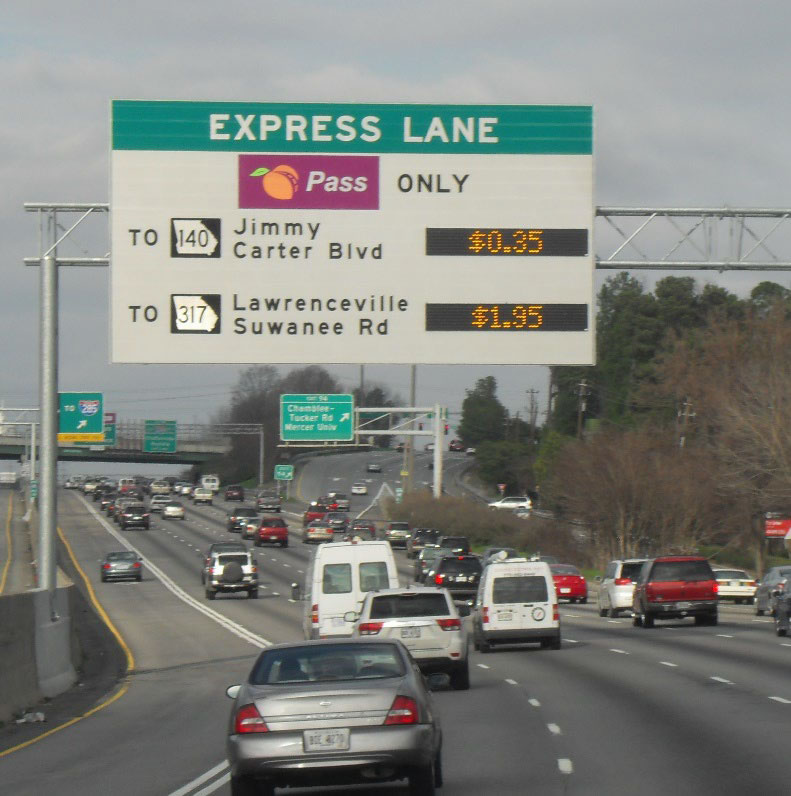
FDOT Sun Pass
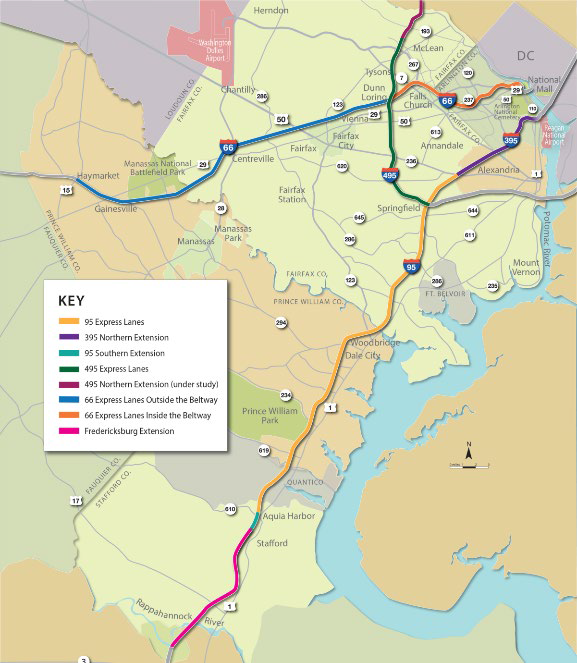
VDOT Virginia Department of Transportation
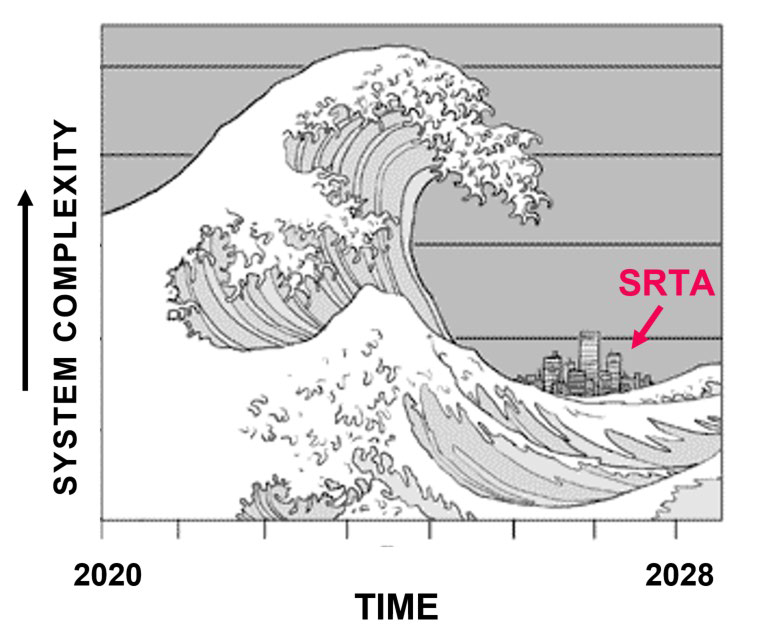
SRTA State Road & Tollway Authority
carma
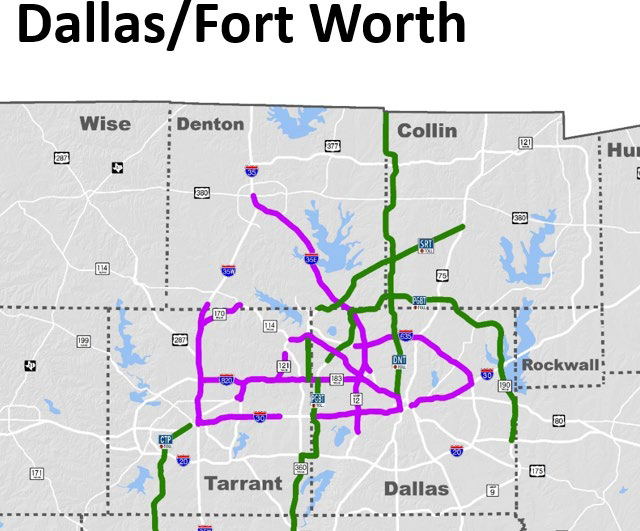
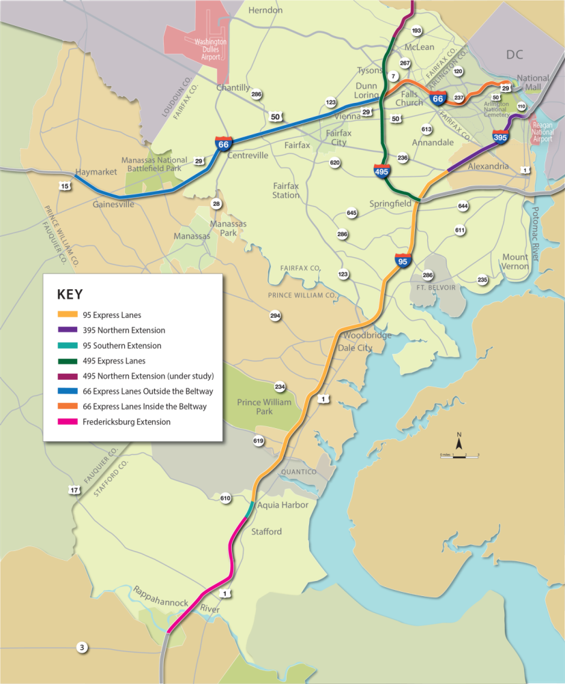
Managed Lanes Networks
Dallas/Fort Worth region is building a 160 centerline miles managed lanes network
NCTCOG formed a regional working group to develop a consistent set of regional policies
Continual work to defend against external threats
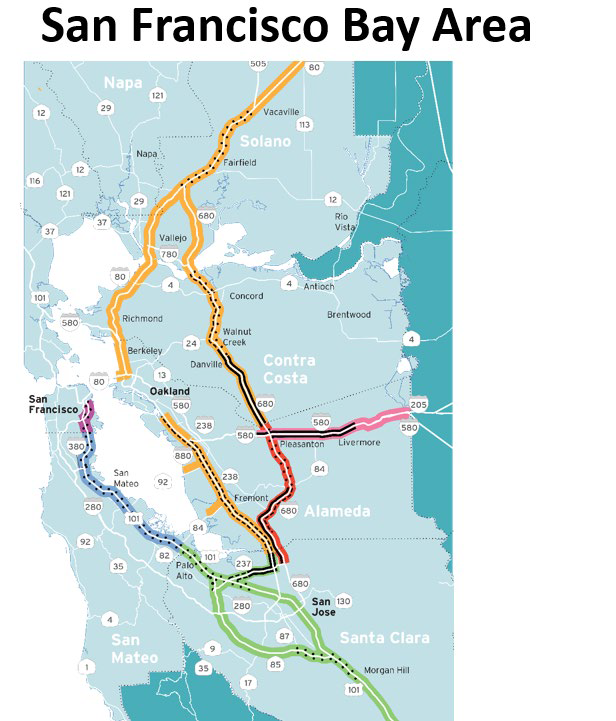
Bay Area is working on a 640 centerline miles managed lanes network
Informal 4 agency working group to coordinate
Consistency with signage and FasTrak toll account
Need to work on hours of operations, toll violation enforcement, Clean Air Vehicle, increasing
occupancy from HOV 2+ to HOV 3+, adjudication of violations
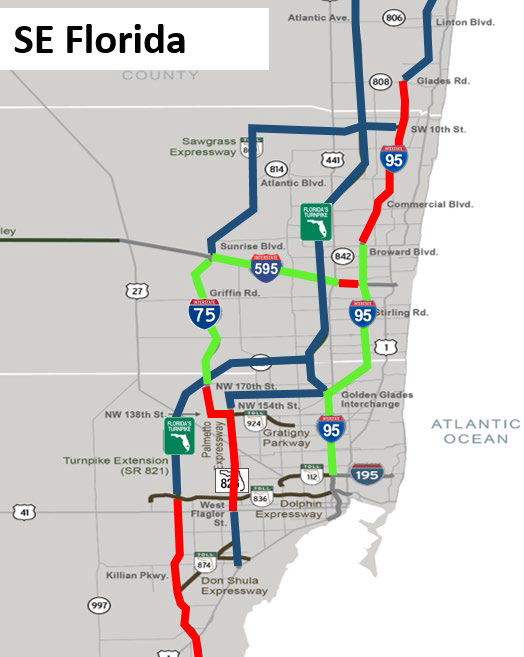
South East FL region is building a 267 centerline miles managed lanes network
FDOT began developing a Regional Concept of Transportation Operations (RCTO) Handbook
One project can impact the network
Common Network Themes
Coordination between regional operators/stakeholders key
Strive for regional consistency
Continual improvement needs
Pricing and Operations Insights
Dynamic pricing, where the toll rate change according to traffic conditions, has been widely adopted
VDOT has been able to manage demand and capacity effectively with dynamic pricing on its express lanes
As SRTA deploys their managed lanes network, they are challenging the need for dynamic pricing in order
to simply customer messaging and operations
Carma's experience is that commuters make carpooling decisions before they leave not when looking
at rate
signs
Future use of dynamic pricing ultimately depends on agency goal
If focusing on roadway demand/capacity management, then keep doing dynamic pricing
If looking at travel managing demand (ie mode shift), then want to look at new pricing schemes, ie
reservation system or other incentives like rebates
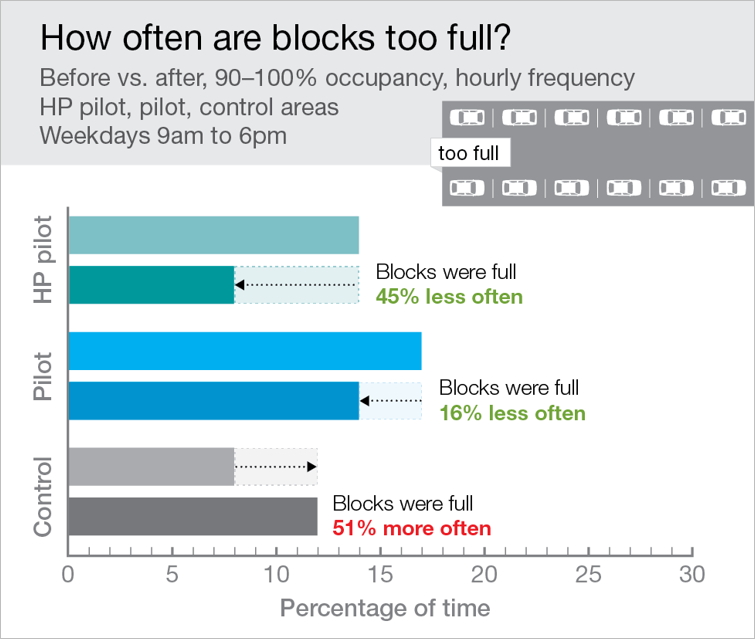
Blocks were full 51% more often in the control group, and 16% less often during the pilot. They were 45% less full during the HP Pilot.
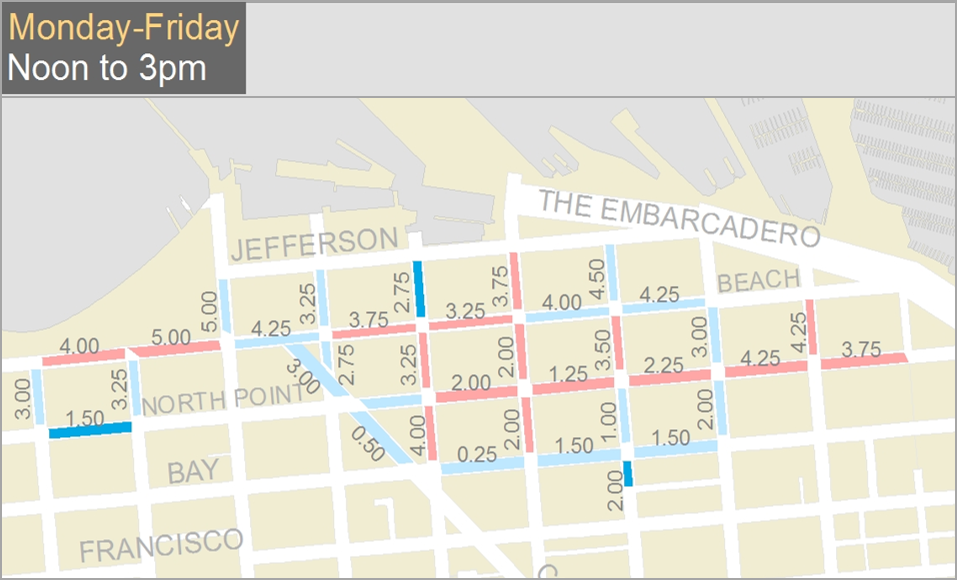
Rethinking Performance Pricing
Proactive parking pricing instead of reactive pricing
Present occupancy
Price
Occupancy of nearby blocks
Set the price of parking on a collection of blocks instead of individual blocks.
Fabusuyi, T., & Hampshire, R. C. (2018). Rethinking performance based parking pricing: A case study of
SFpark. Transportation Research Part A: Policy and Practice.
114 block faces
1,000 metered spaces
30 loading zones
Asset lite & multi-modal (monitoring ratio 1 sensor for two spaces)
Data fusion:
Paid versus occupied
Meter mobile payments
In-ground meters
Cameras & area sensors
Data intensive -drive to "minimum viable product"
real time information availability
Pricing engine
Moving in the right direction:
Occupancy and turnover
Placard usage
Public reaction (survey of businesses, customers, delivery drivers)
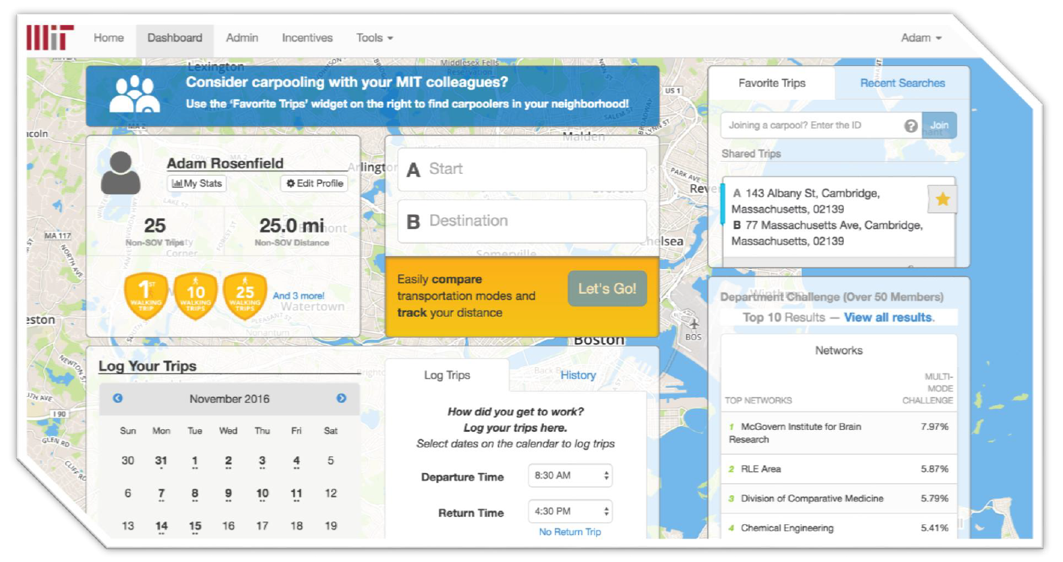
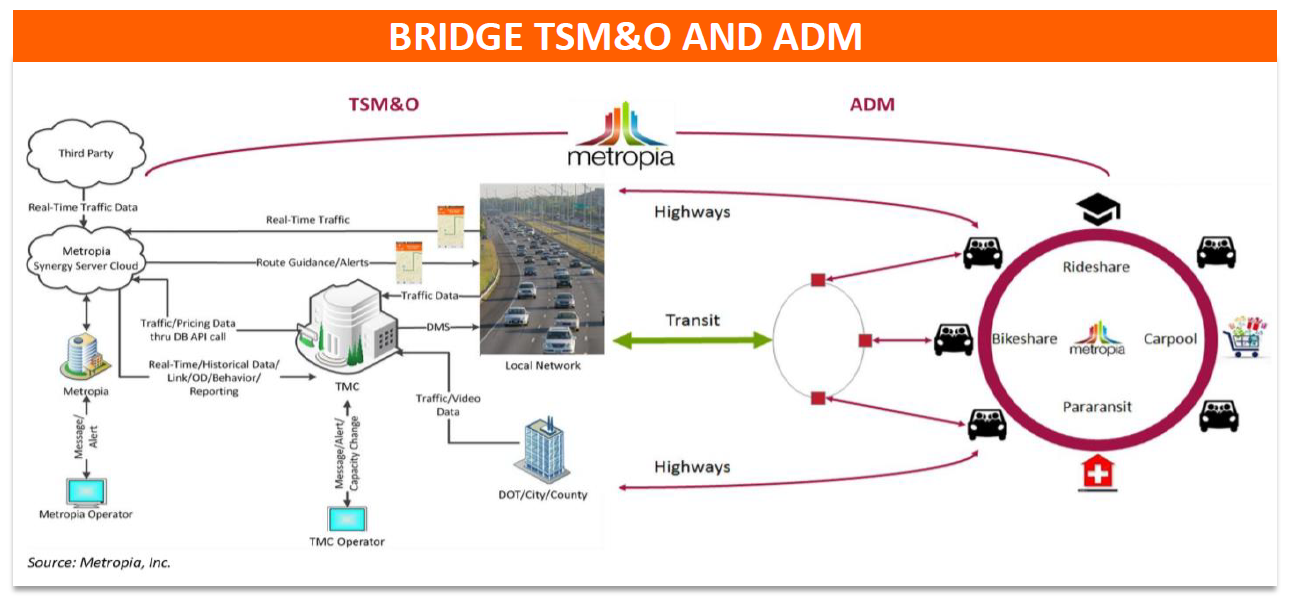
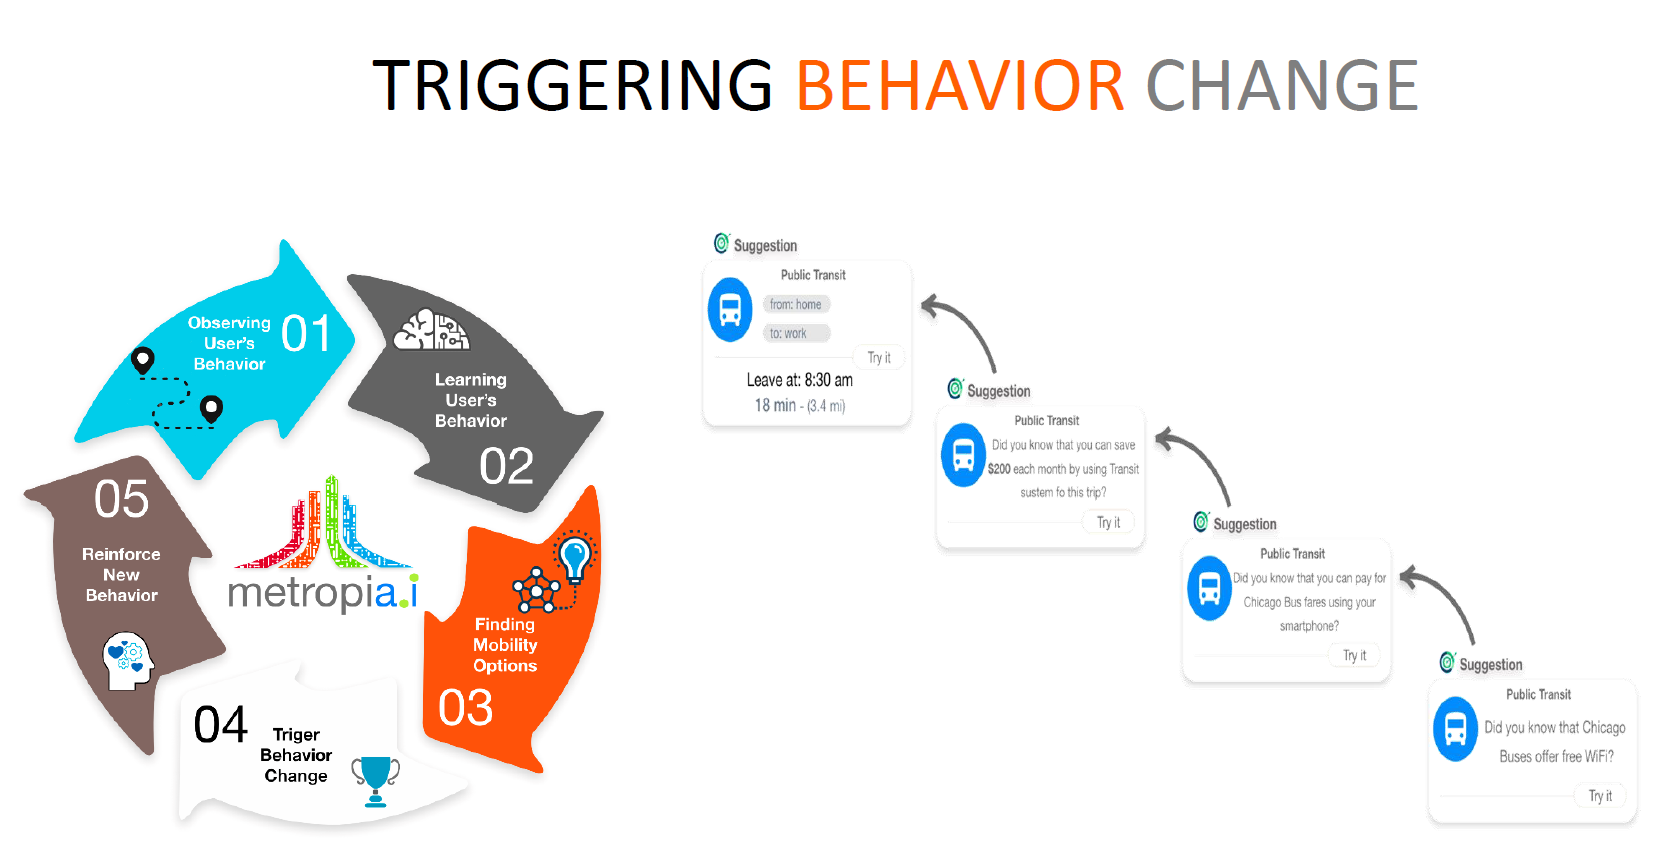
Sample suggestions sent to users :
Suggestion: Public Transit - Did you know that Chicago Buses offer free WiFi? Try it.
Suggestion: Public Transit - Did you know that you can pay for Chicago Bus fares using your smartphone? Try it.
Suggestion: Public Transit - Did yo know that you can save $200 each month by using transit system for this trip? Try it.
Suggestion: Public Transit - From Home To Work - Leave at 8:30am - 18 min (3.4 mi). Try it.
Eight really interesting presentations with some common themes:
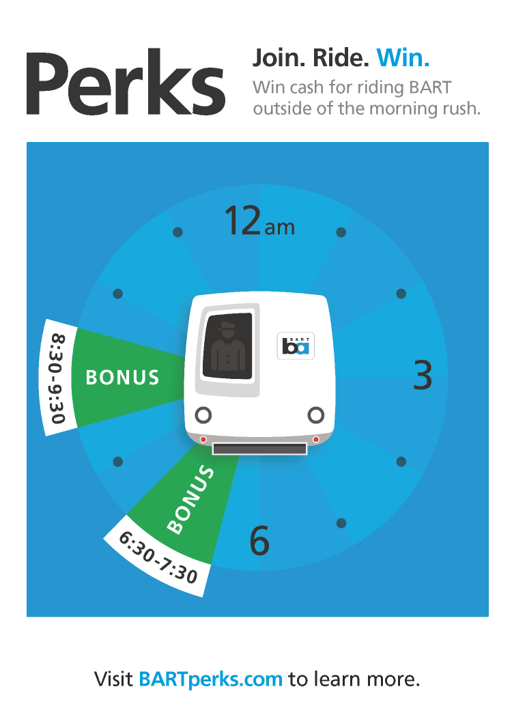
Need to get people's attention
Sometimes you can using gamification
Pricing matters and pricing in finer increments (daily cash-out versus monthly) can be more effective
Congestion Pricing Webinar:
Lessons Learned from the 2018 National Congestion Pricing Conference
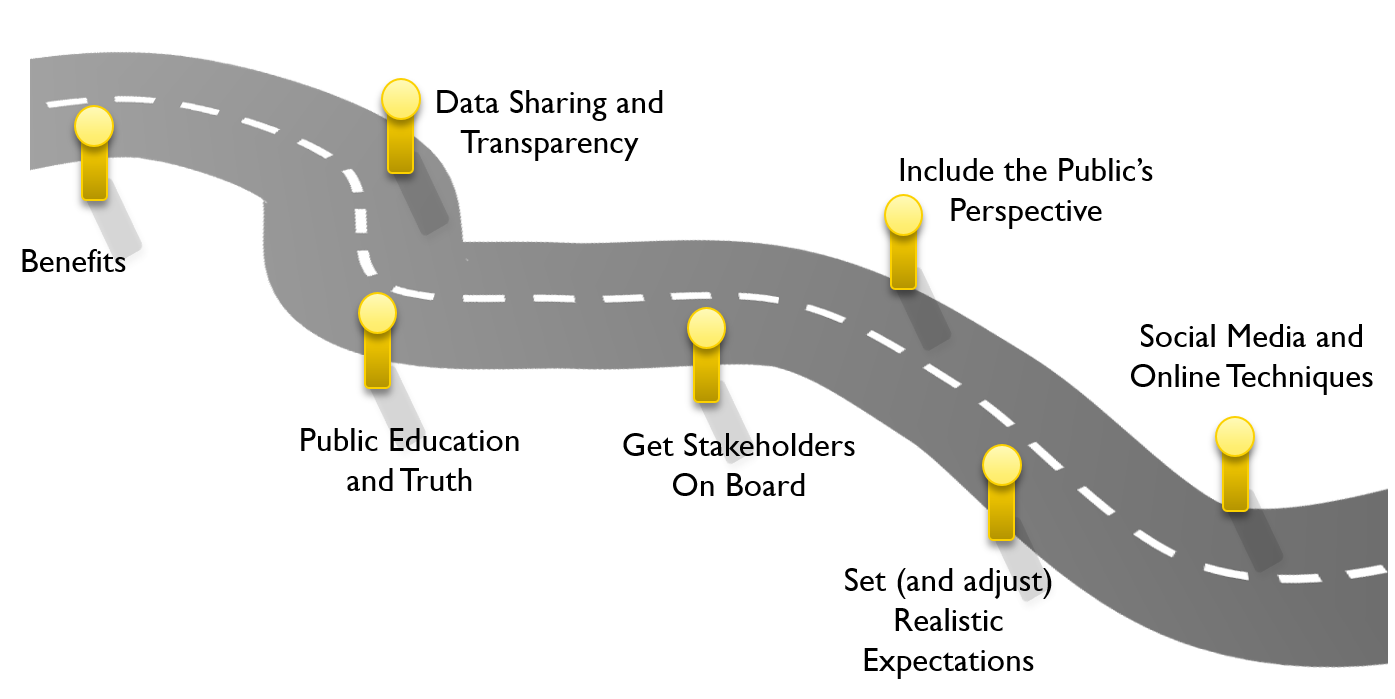
Public Acceptance
Mia Zmud, MZ Insights
September 13, 2018
Overview
Cross-cutting themes and observations
Presentation highlights
Summary of lessons learned
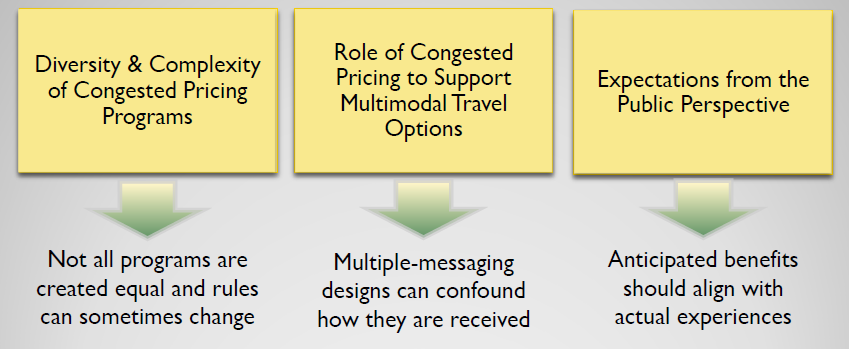
Cross-cutting themes
Public acceptance of congestion pricing is a major challenge
While customers readily accept premium pricing in many areas of their lives (hotel, air travel) they are
warming to the concept for paying for road travel as well
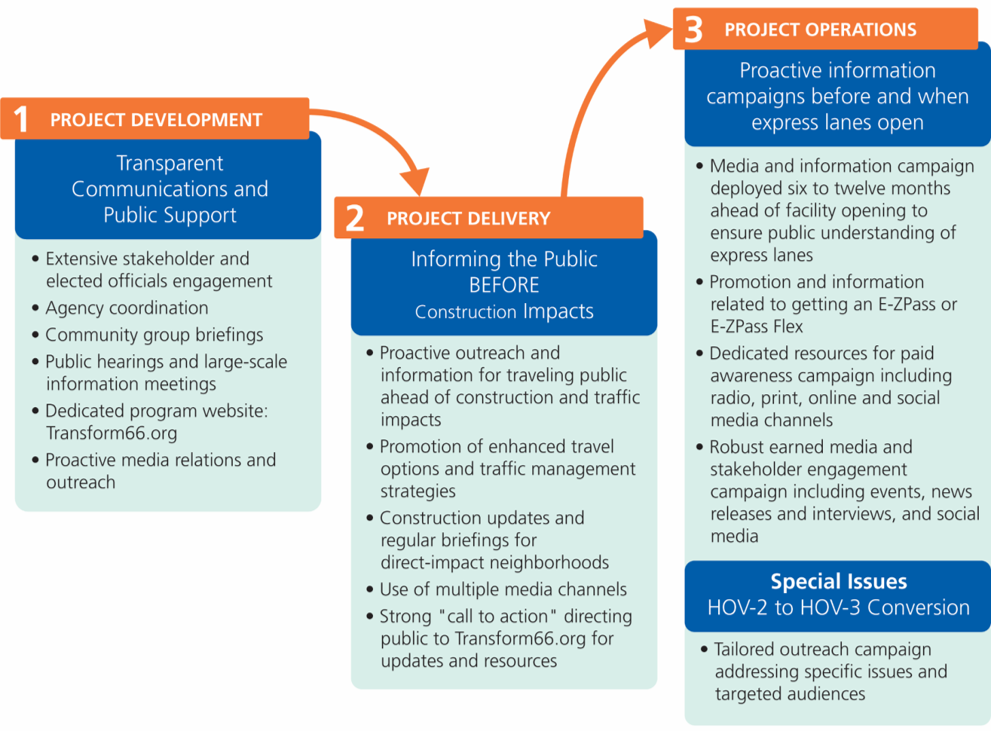
Communications and public education is essential in overcoming barriers to acceptance
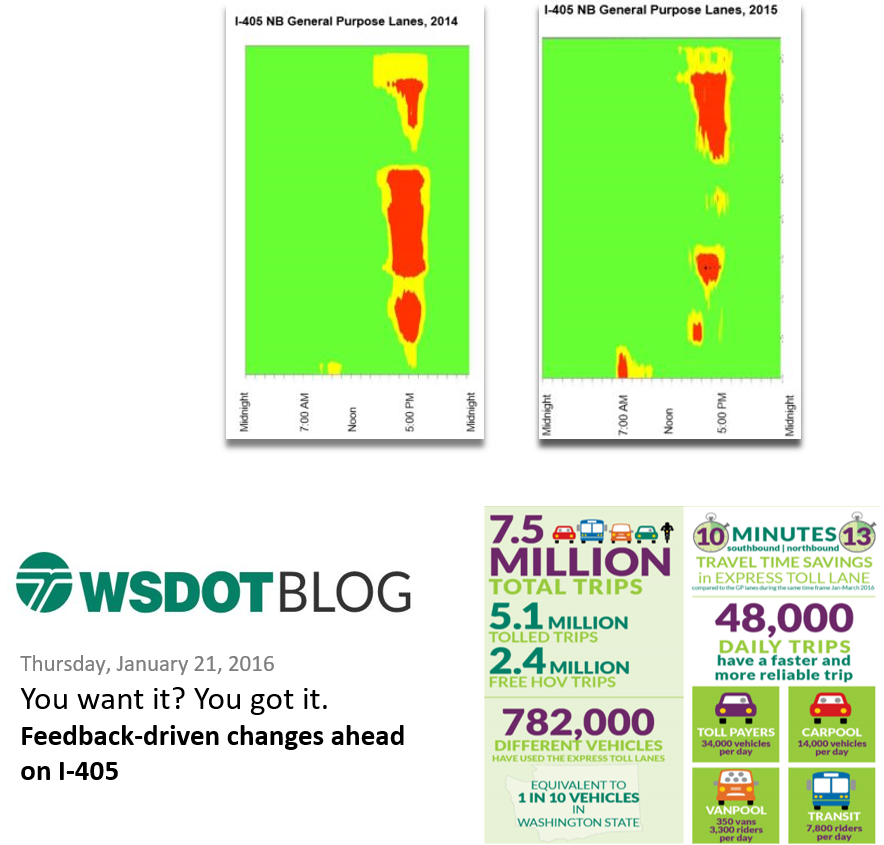
Thursday, January 21, 2016 Blog Post
Heat maps show that afternoon rush hour traffic was reduced from 2014 to 2015 but 7am traffic was heavier.
You want it? You got it. Feedback-driven changes ahead on I-405.
7.5 million total trips
5.1 million tolled trips
2.4 million free HOV trips
782,000 different vehicles have used the Express Toll Lanes
Equivalent to 1 in 10 vehicles in Washington State.
Travel Time Savings in Express Toll Lane: 10 minutes southbound, 13 minutes northbound (compared to the GP lanes during the same time frame Jan-March 2016)
48,000 daily trips have a faster and more reliable trip
Toll Payers: 34,000 vehicles per day
Carpool: 14,000 vehicles per day
Vanpool: 350 vans, 3,300 riders per day
Transit: 7,800 riders per day
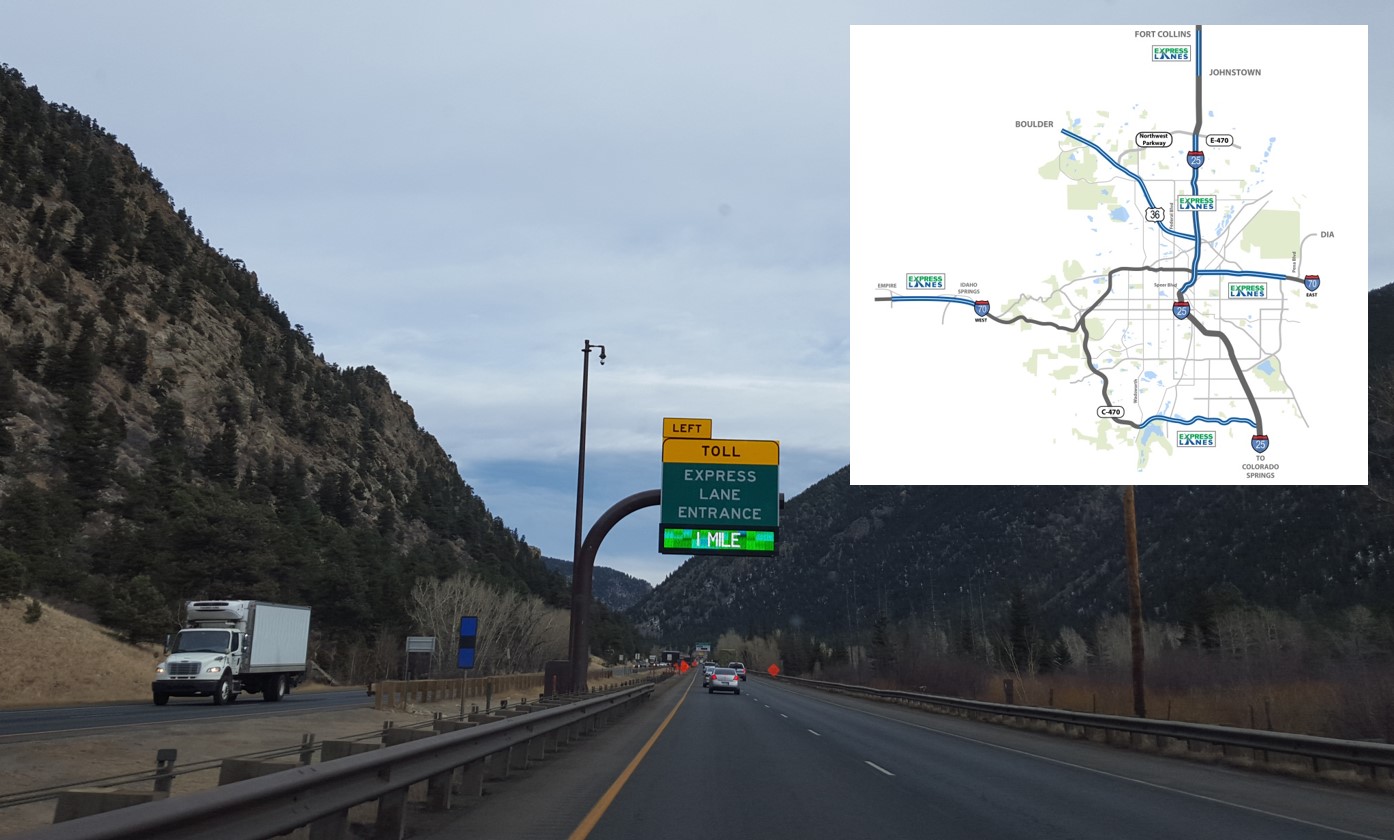
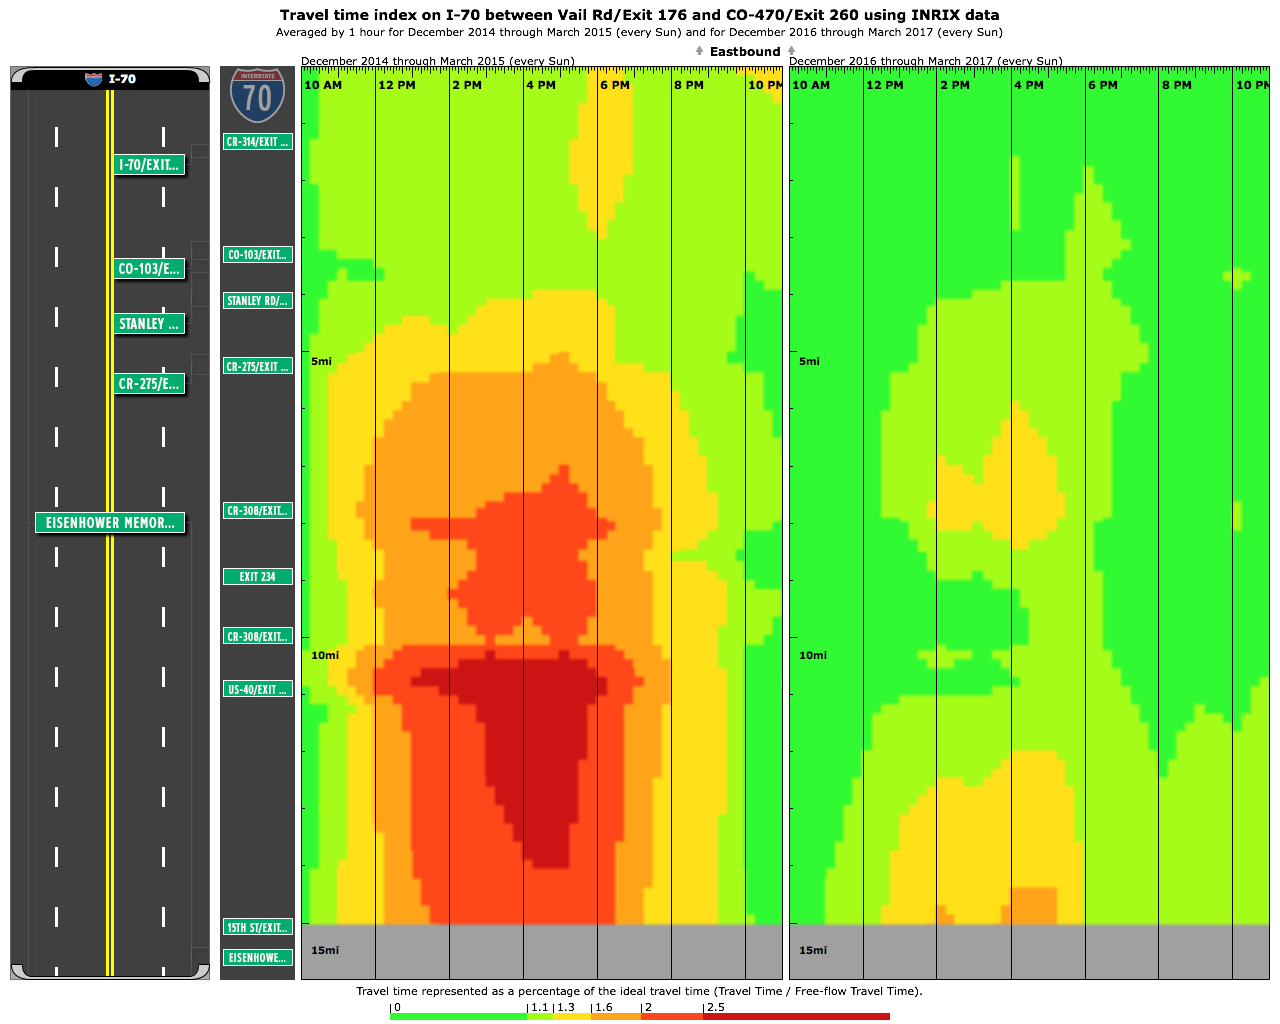
CODOT: Setting toll rates for the I-70 Mountain Express Lane
One of the most congested corridors in the nation and connecting Denver to mountains
Protocols for public outreach to mitigate operational challenges
Social traditional and paid PR
Virtual town halls (attracting 3k-5k attendees)
Stressed "Express Lane Brand" to emphasize difference from other toll roads in the region.
Results drive acceptance: Travel time savings up to 20-50% for all lanes (including non-tolled general
purpose lanes)
Travel time index on I-70 between Vail Rd/Exit 176 and CO-470/Exit 260 using INRIX data Averaged by 1 hour for December 2014 through March 2015 (every Sun) and for December 2016 through March 2017 (every Sun)
The heat map comparison of December 2014 through March 2015 and December 2016 through March 2017 shows a vast reduction in travel time in 2016-2017 time frame