Patrick DeCorla-Souza, Tolling and Pricing Program Manager, FHWA
Lee Munnich, Humphrey Institute, University of Minnesota
Kenneth Buckeye, Minnesota Department of Transportation
John Doan, SRF Consulting
Center for Innovative Finance Support
Federal Highway Administration
Fifteenth Part of a Webinar Series on Overcoming the Challenges of Congestion Pricing.
Session 15: The Impacts of Congestion Pricing on Carpooling and Transit - Webinar
Audio:
- Via Computer - No action needed
- Via Telephone - Mute computer speakers, call 1-866-863-9293 passcode 36547547
Presentations by:
- Allen Greenberg, FHWA, allen.greenberg@dot.gov
- Eric Schreffler, Transportation Consultant, estc@san.rr.com
- Brian Pessaro, University of South Florida Center for Urban Transportation Research, pessaro@cutr.usf.edu
- Dave Schumacher, San Diego Association of Governments, Dave.Schumacher@sandag.org
- Jim Edwards, SoundTransit, Seattle, jim.edwards@soundtransit.org
Audience Q&A: addressed after each presentation, please type
your questions into the chat area on the right side of the screen
Closed captioning was available at:
http://www.captionedtext.com/client/profile.aspx?EventID=1980150&CustomerID=321
Upcoming Webinars:
Visit https://ops.fhwa.dot.gov/congestionpricing/webinars/index.htm
Recordings and Materials from Previous Webinars: https://www.fhwa.dot.gov/ipd/tolling_and_pricing/resources/webinars/congestion_pricing_2011.aspx
Part 1: Managed Lanes and Alternative Modes - How Can They Peacefully Coexist?
Allen Greenberg
FHWA, Congestion Management and Pricing Team
Overview
- Why managed lanes are important
- Unique issues for casual carpooling with managed lanes
- Appropriate program goals
- What not to worry about
- Other commuter-related pricing
- Employer programs
- Parking and access pricing "gems"
Why managed lanes are important: the problem
- Because HOV lanes had excess vehicle carrying capacity (despite higher person throughput than GP lanes), drivers in GP lanes demanded less restrictive or open access to these lanes
- Where HOV lanes remained, occupancy requirements were reduced, especially through the early 1990s prior to the popularization of HOT lanes
- New capacity built on the promise that it would be for HOV became GP lanes
Why managed lanes are important: the solution
- HOT lanes have for the first time led to increasing occupancy requirements for free HOV travel (albeit often with projects adding capacity)
- HOT lane projects, especially through the Urban Partnership Program, have been the backbone of enormously successful new and expanded express bus services (case study: Miami)
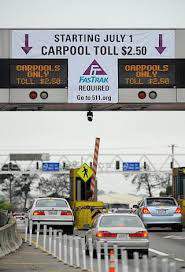
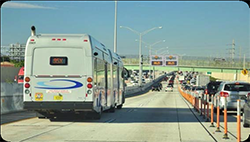
Miami I-95 Express Lanes
Unique issues for casual carpooling with managed lanes
- Describe casual carpooling
- Casual carpooling requires 3+ occupancy for enhanced safety (Houston HOT-2 exception)
- HOT-3 is likely to work with casual carpooling if tolls are high and not work if tolls are low
- Where HOT lanes are introduced, driver/rider numerical balance could be maintained by, with political support from casual carpoolers, moving from HOT-3 to HOT-4
Appropriate program goals
- Preserving a managed lane network that offers users fast and efficient travel
- Serve and foster express bus and casual carpooling systems
- Offer solo-drivers a premium travel option (used occasionally by drivers of all incomes) as a substitute for adding new GP lanes (can reward transit riders with credits toward free access)
What not to worry about
- Slight changes in vehicle occupancy or slower commutes for HOV-2 "fam-pools" that choose not to pay a HOT-3 toll (perhaps to enjoy more "in-vehicle quality family time")
- Focus should instead be on having a system that allows fast and efficient "high-value" trips (e.g., bus, commuter van, and perhaps other multi-occupant vehicle trips, plus SOV users paying a real premium)
Other commuter-related pricing
- Fairly pricing employee parking
- Parking pricing and access gems
Fairly pricing employee parking
- 95% of private-sector employees receive free parking v. 6% receiving transit benefits
- Equalizing parking and non-parking benefits through cash-out and transportation allowances works:
- Eight-site Los Angeles study showed cash-out to cut drive-alone commutes from 76% to 63% of total
- CH2M Hill in Bellevue, WA converted free parking to a travel allowance, cutting SOV commuting from 89% to 64%
- Cities without cash-out ordinances uniquely disadvantage their own citizens (e.g., 31% SOV mode share for DC residents v. 50+% for suburban residents traveling to DC worksites)
Parking and access pricing gems
- Minneapolis PayGo Flex-Pass led to 56.5% driving days v. 78.5% for traditional paid monthly parking
- After off-peak port-access discounts were introduced, 45% of trucks at the Los Angeles and Long Beach piers arrived during off-peak hours, versus only 17-21% prior to such discounts
- Parking pricing can include congestion pricing elements (e.g., SFpark $2 peak-shoulder garage entrance/exit discount)
Contact Information
Part 2: Impact of HOV to HOT Conversions on Carpooling
White Paper prepared for FHWA Office of Operations, Transportation Management
Eric N. Schreffler
ESTC
Purpose of White Paper
- Preliminary assessment of impacts of HOT conversion on carpooling
- Does not focus on transit impacts; acknowledges primary objectives such as increased efficiency
- Cross-cutting investigation of UPA/CRD projects (Atlanta and Miami) and other projects, e.g., I-15 (San Diego) and I-394 (Minneapolis)
- Intended to assess findings from early projects and provide input to USDOT and others
- Builds upon recent work by Caltrans and TTI
- Desire to elicit discussion at this conference
Co-Authors
- Ginger Goodin, TTI
- Nick Wood, TTI
- Eric Schreffler, ESTC
- Carol Zimmerman, Battelle
Projects Investigated
- UPA/CRD (completed)
- Newer UPA/CRD & Studies
- Seattle
- Los Angeles
- Dallas
- Other Operational Projects
- San Diego
- Houston
- Minneapolis
- Denver
- Seattle
- San Francisco/Oakland
Range of Interventions
 HOV to HOT lane conversion
- Requirement to obtain transponder
- Increase free usage to 3+ carpools
- Slugging possible
- Additional commuter transit service
Time Series Data Utilized
- Occupancy Counts
- Traffic counts (to assess vehicle and person throughput)
- License plate surveys (SEA and ATL)
- Carpool registrant surveys (ATL)
- Transponder applicant data (LA)*
- Vanpool data (SEA and LA)*
* being collected
Range of Impacts
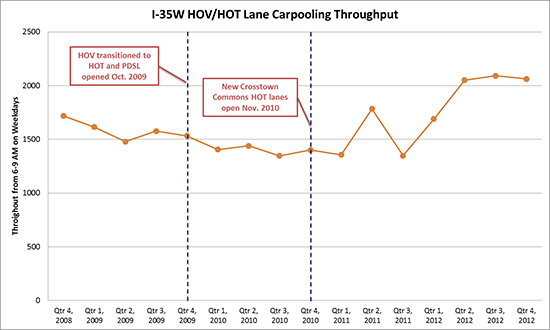
- Positive impacts (carpooling increased in managed lanes) - Minnesota I-35W
- Neutral impacts (no change in carpooling) - Denver
- Negative impacts (carpooling decreased in managed lanes) - Atlanta and Miami (and SF)
- Variable impacts (carpooling increases and decreases) - San Diego and Minneapolis I-394
- Other impacts (carpools shifted to free GP lanes) - Atlanta and Miami
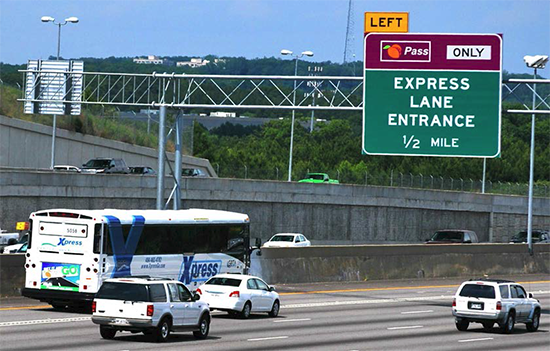
Atlanta I-85
 2-person CP tolled
- Transponder required
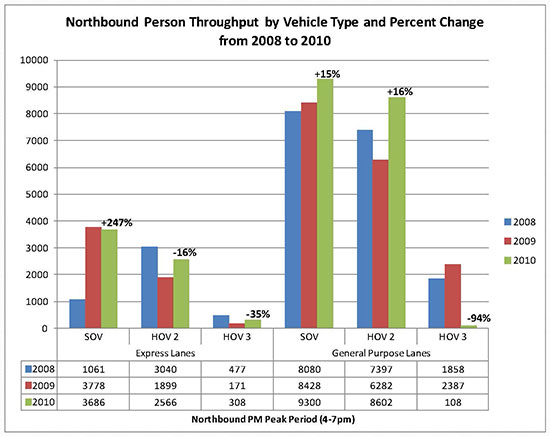
- Person throughput down 7% in a.m. and up 1% in p.m.
- Many 2-person CPs (38%) switched to GP lanes
- Few 3-person CPs formed
- 29% of existing CPs switched to drive alone
Miami I-95
Minneapolis I-35W
San Diego I-15
 2+ carpools free
- Carpool volumes increased 7% first phase (monthly permit)
- Carpool volumes decreased during second phase (dynamic pricing) in both HOT and GP lanes (overall 15-32%)
- Longer term trends show stabilization
Probable Influence Factors
- Increase in occupancy requirement for free usage and challenges in forming 3-person carpools
- Requirement for carpools to register and obtain transponder
- Toll structure and changes therein
- Parallel transit service
- Conflicting regional HOV and HOT policies
- Exogenous factors (gas prices and employment)
Issues for Further Investigation
- Policy - e.g., are there conflicting policy objectives for HOV and HOT projects?
- Analytic and Behavioral - e.g., can existing analytic tools accurately predict impact on carpooling?
- Operational - e.g., can the negative impacts be mitigated?
- Institutional - e.g., what level of public understanding is needed for HOT conversion projects?
Implications
- Carpool support needed after HOT implementation
- Policy objectives need to be carefully considered
- Quantification of actual impacts necessary for better future predictive exercise
- Lessons can be learned from HOT pioneers
- Continuing investigation and assessment needed
More Information
Part 3: Impacts of Congestion Pricing on Transit

Brian Pessaro, AICP
FHWA Webinar
September 17, 2013
I-85 Express Lanes -
Atlanta
I-35W MnPass Lanes - Minneapolis
I-95 Express Lanes - Miami
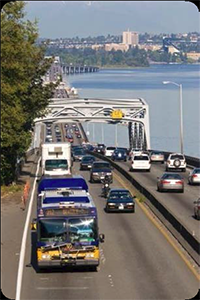
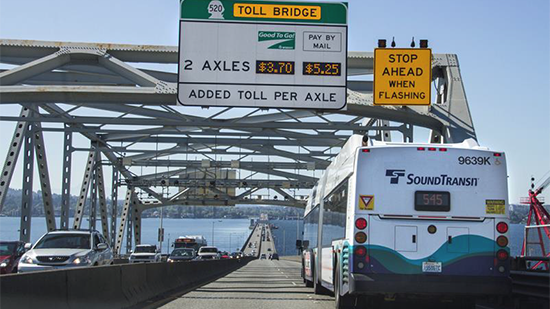
SR 520 Bridge - Seattle
More Average Daily Riders
| UPA Site |
Before
HOT |
After HOT |
% Change |
| Miami |
1,827 |
2,877 |
57% |
| Minneapolis |
4,572 |
4,649 |
8% |
| Atlanta |
1,210 |
1,459 |
21% |
| Seattle |
4,441 |
4,889 |
24% |
Figures reflect a.m. peak period
Seattle figures are for eastbound and westbound combined
Ridership
Shorter Travel Times
| UPA Site |
Before HOT |
After HOT |
% Change |
| Miami |
25.0 min |
8.2 min |
-67% |
| Minneapolis |
20.0 min |
15.6 min |
-22% |
| Atlanta |
47.2 min |
42.4 min |
-10%* |
| Seattle (west) |
5.3 min |
5.1 min |
-4% |
| Seattle (east) |
6.1 min |
5.2 min |
-15% |
Figures reflect a.m. peak period
Variation in travel time due to variation in HOT segment length
Rider Perceptions of Travel Time
| UPA Site |
Before HOT |
After HOT |
Statistical Sig. |
| Miami |
4.05 |
4.51 |
Yes |
| Minneapolis |
4.18 |
4.26 |
Yes |
| Seattle |
4.22 |
4.23 |
No |
1
Very Poor |
2
Poor |
3
Fair |
4
Good |
5
Very Good |
Rider Perceptions of Reliability
| UPA Site |
Before HOT |
After HOT |
Statistical Sig. |
| Miami |
4.06 |
4.37 |
Yes |
| Minneapolis |
4.33 |
4.37 |
No |
| Seattle |
4.24 |
4.14 |
Yes |
1
Very Poor |
2
Poor |
3
Fair |
4
Good |
5
Very Good |
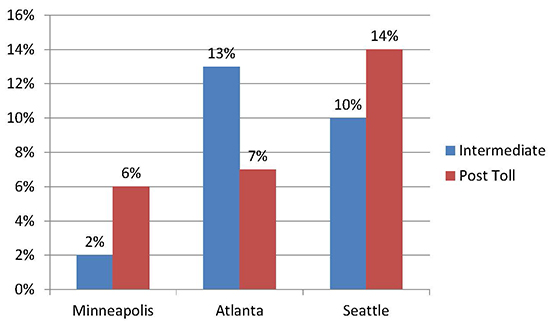
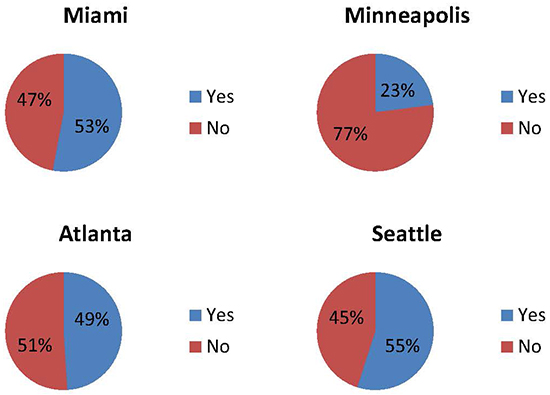
Previous mode of new transit riders
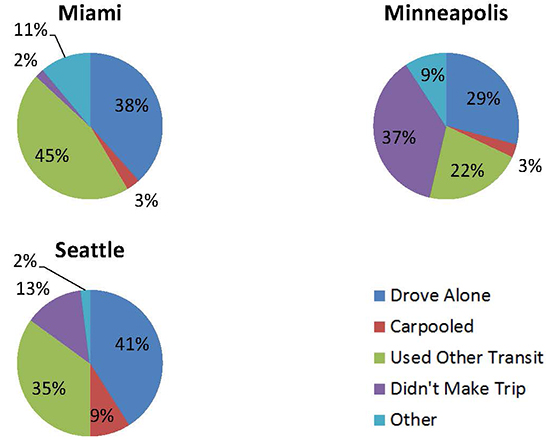
Did the tolls influence new riders to take transit?
What had more influence on Seattle transit riders?
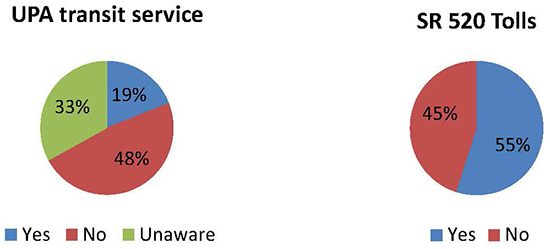
- Most new riders in Seattle were unaware or uninfluenced by the UPA-funded transit service that began prior to SR 520 tolls.
- The SR 520 tolls had a greater influence.
Other Observations
Atlanta riders loved the transit service but not the priced lane
- In pre-toll survey 60% disapproved converting I-85 HOV lane to HOT
- In the post-toll survey
- Only 18% said I-85 Express Lanes improved travel
- Only 13% said they have been good for Atlanta
Transit riders from other UPA sites were more positive about the tolls
- In Seattle, 57% said the SR 520 tolls have improved their travel and 42% said the tolls have been good for the region.
- In Minneapolis, 61% said the MnPass lanes have improved bus travel speeds and 55% said the MnPass lanes improved bus reliability.
- In Miami, over 80% of transit riders said their bus travel time was faster after the I-95 Express Lanes opened.
Contact Information
 Brian Pessaro, AICP
Senior Research Associate
Center for Urban Transportation Research
University of South Florida
(813) 974-5113
pessaro@cutr.usf.edu
Part 4: San Diego I-15 Managed Lanes and FasTrak: Lessons Learned for Transit
FHWA Webinar:
Impacts of Congestion Pricing on Carpooling and Transit
September 17, 2013
Role of Managed Lanes
- Focus of 2050 Regional Transportation Plan is a multi-modal strategy
- Provide "travel choices"
- Offer time competitive travel time for alternative modes
- Increase freeway operating efficiency
- Managed Lanes are "dynamic"
- Users, access, pricing all can adjust time depending on changing conditions
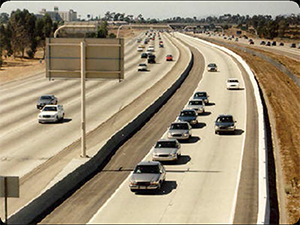
I-15 Managed Lanes Design
- Barrier-separated, 4-lanes, movable barrier
- Direct Access Ramps every 4-5 miles
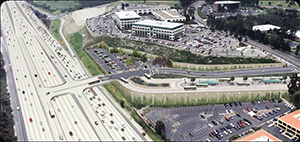
- Off-line BRT transit stations and park-n-rides
- FasTrak for SOV buy-in - dynamic pricing
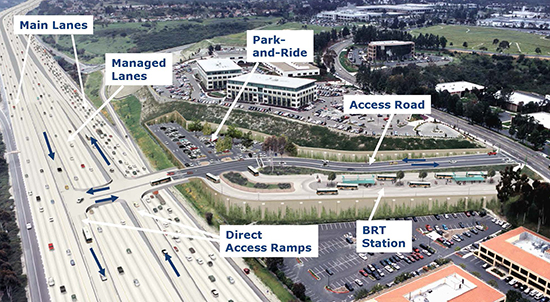
Direct access ramps open to BRT, carpools, and FasTrak customers.
I-15 FasTrak Design
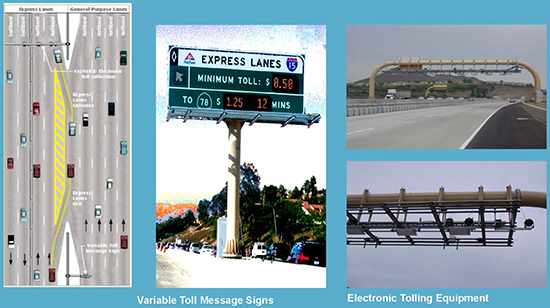
Multiple access points, dynamic pricing strategy
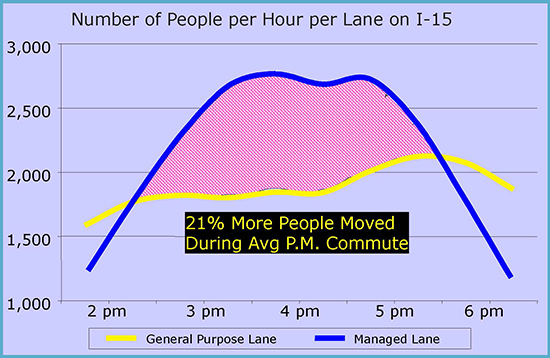
Managed Lanes: I-15 Results
- Increased use of HOV Lanes
- Up to 20,000 avg daily users (75% HOV, 25% FasTrak)
- Provides travel choices
- Transit, carpool, FasTrak
- FasTrak revenues to transit
- Generated over $7 million for I-15 transit in first decade
Moving People, Not Just Cars
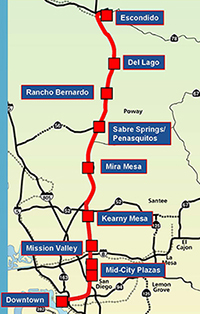
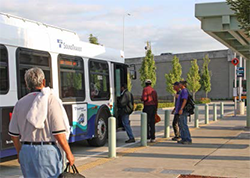
I-15 BRT Operations
- Serves long distance trips
- High speed - Stations spaced 4-5 miles avg
- Managed Lanes = transitway
- Service includes:
- All-stop, all day trunk
- Peak period limited stop commuter expresses
- Opens in 2015
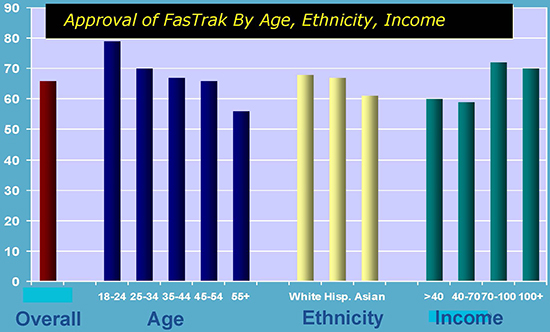
FasTrak Value Pricing Support
I-15 Managed Lanes/BRT - Lessons Learned
- Managed Lanes = collaboration between SANDAG, Caltrans, and transit operators
- SANDAG lead, but joint vision/decisionmaking
- Local TransNet program:
- Provides local match to federal/state funding
- Provides both BRT capital & operating funding
- Moving people, not cars
- Managed lanes improves efficiency of highway system
- HOV/BRT travel time benefits
- Provides incentive for ridesharing and taking transit
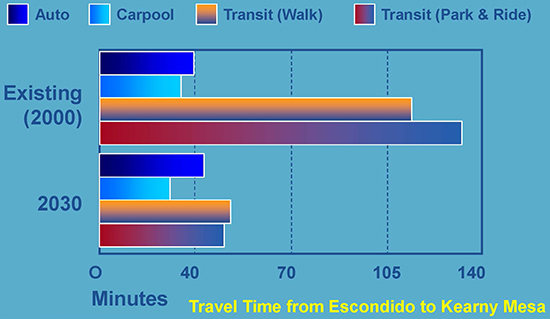
I-15 Managed Lanes/BRT - Travel Times
I-15 Managed Lanes/BRT - Lessons Learned
- HOV Users:
- Represent 80% of demand
- HOV use increased with FasTrak program
- 4-lane facility enables 2+ person occupancy plus BRT and FasTrak
- Future demand shows need for 3+ person occupancy by 2035 - will need to look at possible peak/off-peak occupancies
- FasTrak Program
- Expands travel choices
- Ensures free-flow conditions for BRT
- Resolves equity issue by helping fund BRT operations
- Future Managed Lanes
- Likely to be buffer-separated, fewer DARs due to high costs and ROW impacts
Managed Lanes: Why Tolling and Transit Work
- Success of BRT premised on fast travel times and schedule reliability
- Managed Lanes provide a multi-modal guideway for BRT and carpooling
- Problem: how to guarantee that Managed Lanes don't become congested?
- Solution: Tolling
- Tolling works only if Managed Lanes operate in free-flow conditions
- Win-win for BRT, carpooling, and tolling
Future Opportunities and Challenges
- 2050 Plan - expand Managed Lanes/BRT/ tolling to other corridors
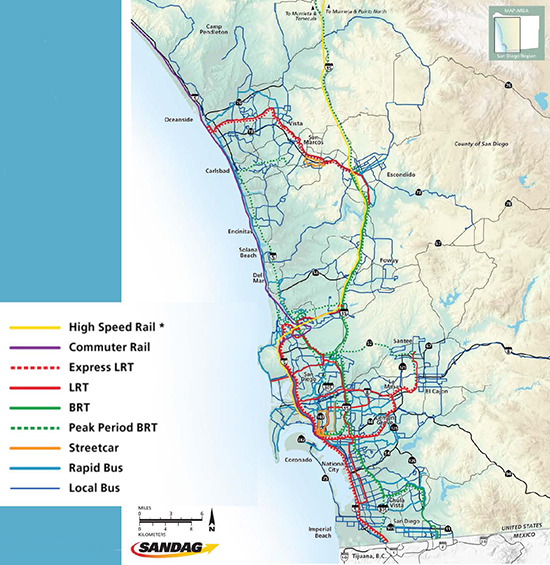
2050 Regional Transportation Plan - Highway Network
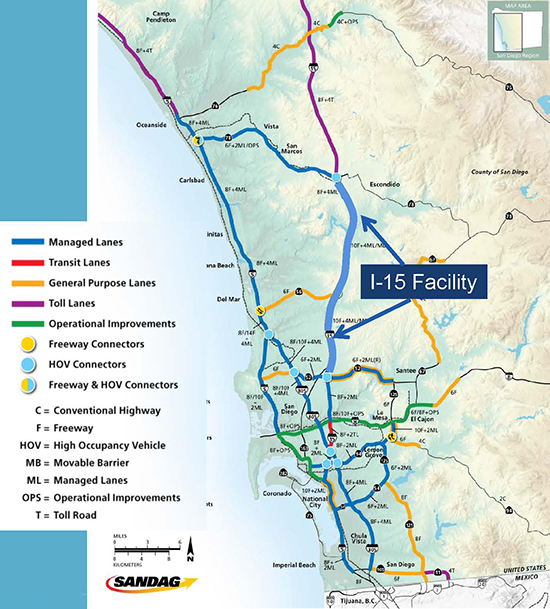
Future Opportunities and Challenges
- 2050 Plan - expand Managed Lanes/BRT/ tolling to other corridors
- Priority remains to BRT and ridesharing; FasTrak fills excess capacity
- With growth, maintaining free flow conditions is key challenge
- Carpool occupancy increase to 3+ persons?
- FasTrak toll costs?
- Need for dedicated BRT/LRT lanes?
- Future Managed Lanes
- Likely to be buffer-separated, fewer DARs due to high costs and ROW impacts
- Some initially will be one lane facilities
- FasTrak Program
- Can it work with one lane HOT lane? Winners and losers - carpools or FasTrak users?
Automated Highways
2050 Regional Transportation Plan - Transit Network
San Diego I-15 Managed Lanes and FasTrak: Lessons Learned for Transit

Dave Schumacher
Dave.Schumacher@sandag.org
www.sandag.org
Part 6: Transit Perspective
Congestion Pricing Impacts on Carpools & Transit
September 17, 2013
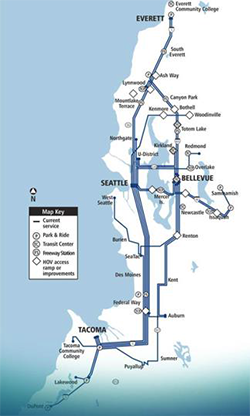
Sound Transit District
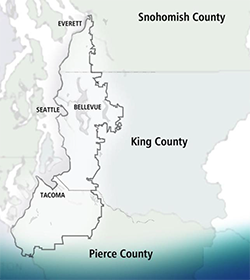
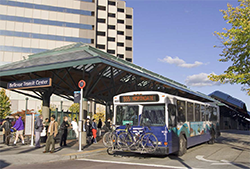
ST Express Regional Bus and transit projects
Gaining and Maintaining Acceptance
- Transit agencies are key stakeholders in dealing with congestion;
- Should be a partner in early planning, design and dealing with operational issues of congestion pricing;
- Transit can help address equity issues.
Congestion Pricing beneficial and supported by transit agencies due to these potentials depending on pricing method
- Reduce Peak Hours SOV demand;
- Raise revenue for system and transit improvements;
- Maximize system through-put;
- Maintain HOV system at higher performance levels.
Congestion Pricing does impact transit services and facilities
- Increases ridership demand on already congested facilities, like park and ride facilities and transit centers;
- Increases peak hour ridership demands on transit. Difficult and expensive to add peak hour bus service;
- HOV/HOT lanes need to be well managed; performance measures need to be established up front;
- Transit speed & reliability critical to ridership.
Congestion Pricing programs and revenues need to consider public transportation impacts
- Legislation can restrict use of revenues only to corridor and only to highway purposes;
- Public transit should not be tolled;
- Toll objectives should be clear;
- Peak hour tolls should be higher than transit fares.
Any questions?
CONTACT INFORMATION:
Jim Edwards, P.E.
Deputy Executive Director, Design & Engineering
(206) 398.5432 / jim.edwards@soundtransit.org


 Eric N. Schreffler