Patrick DeCorla-Souza, Tolling and Pricing Program Manager, FHWA
Lee Munnich, Humphrey Institute, University of Minnesota
Kenneth Buckeye, Minnesota Department of Transportation
John Doan, SRF Consulting
Center for Innovative Finance Support
Federal Highway Administration
Eighth Part of a Webinar Series on Overcoming the Challenges of Congestion Pricing.
Session 8: Economics of Congestion Pricing and Impacts on
Business - Presentations
Audio:
- Via Computer - No action needed
- Via Telephone - Mute computer speakers, call 1-866-863-9293 passcode 57922142
Presentations by:
Audience Q&A: addressed after each presentation, please type your questions into the chat area on the right side of the screen
Closed captioning was available at: http://www.fedrcc.us//Enter.aspx?EventID=1811816&CustomerID=321
Upcoming Webinars:
Visit https://ops.fhwa.dot.gov/congestionpricing/webinars/index.htm
Recordings and Materials from Previous Webinars: https://www.fhwa.dot.gov/ipd/tolling_and_pricing/resources/webinars/congestion_pricing_2011.aspx
Upcoming Webinars:
October 27, 2011 - Integrating Transit with Congestion Pricing and Increasing Congestion Pricing Acceptance
November 17, 2011 - Best Practices in Parking Pricing
December 15, 2011 - Results of the Urban Partnership and Congestion Reduction Demonstration Programs
Part 1: Mobility, Access & Pricing Study
Evaluating Congestion Pricing as a Demand Management Strategy for improving San
Francisco mobility
 presented by Zabe Bent
Principal Transportation Planner
San Francisco County Transportation Authority
Federal Highway Administration Congestion Pricing Webinars | September 2011
www.sfmobility.org | twitter.com/SanFranciscoTA | www.facebook.com/sfmobility
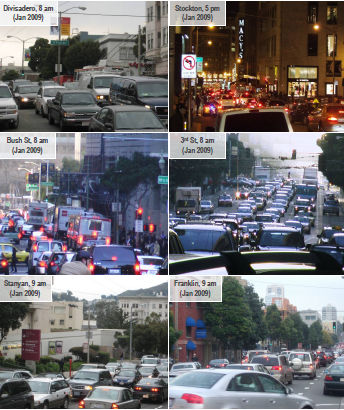
Why study congestion pricing?
- Bay Area among top 5 most congested regions in the US (Texas Transportation
Institute)
- Average regional peak period trip to Downtown SF is twice as long as
off-peak trip
- Focus on congestion impacts not just for motorists, but also transit
performance, etc
- San Francisco sacrificed over $2 billion to congestion in 2005 (over $3B/yr
by 2030)
- Transportation responsible for about half of greenhouse gas emissions in SF
- 2004 SF Countywide Transportation Plan
- 2004 SF Climate Action Plan
- 2011 SF Climate Action Strategy
Key characteristics in scenario analysis
| Fee Analyzed |
| |
Weekdays |
Weekends |
| 6am - 9am |
$3 |
NO FEE |
| 9am - 3pm |
NO FEE |
NO FEE |
| 3pm - 7pm |
$3 |
NO FEE |
| evenings |
NO FEE |
NO FEE |
| Discounts Analyzed: |
Disabled Drivers
Zone Residents
Low-income Drivers |
(50%) |
$6 daily cap
$1 rebate on bridge tolls
Fleet program
for businesses |
Potential Scenarios for SF

Reinvestment of funds - program could generate $60-80M/yr
Up-front/Day One:
San Francisco
- BRT in key corridors (Van Ness, Geary)
- Signal priority and peak bus-only lanes on Fulton, Mission, California
- Bike lanes citywide
- Real-time signage and wayfinding
Regional improvements
- BART station wayfinding, capacity, access improvements
- 101 corridor management / HOV lane
- Caltrain access improvements
Ongoing/Annual:
San Francisco
- More frequent rapid/express service
- Street paving/pothole repair
- Traffic calming
- Streetscape improvements
- Parking management & enforcement
Regional/programmatic improvements
- More frequent regional/express service
- School, worksite TDM programs
- Power-washing sidewalks
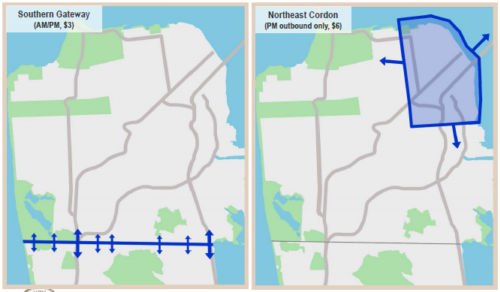
Scenario Comparison - by the numbers
| |
NE Cordon (AM/PM) |
NE Cordon (PM, outbound) |
Southern Gateway (AM/PM) |
| Fee analyzed |
$3 am/pm both directions |
$6 pm outbound only |
$3 am/pm both directions |
| Net Operating Revenue* |
$60 - 80M |
| Peak Auto Trips to/from NE Cordon (avg) |
-12% |
-10% |
-5% |
| Peak Auto Trips to/from S. Corridor (avg) |
-4% |
-4% |
-20% |
| Improvement in Transit Speeds |
up to 20% |
up to 20% |
up to 15% |
| Daily Person Trips (NE Cordon) |
negligible (less than 0.5% change) |
| Daily Vehicle Hours of Delay (NE Cordon) |
-21% |
-10% |
-4% |
| Daily Vehicle Miles Traveled (San Francisco) |
-5% |
-3% |
-4% |
| Change in PM2.5 Emissions (NE Cordon) |
-17% |
-11% |
-8% |
| Change in Collisions (NE Cordon) |
-12% |
-5% |
-3% |
*Values in 2009$ for single representative year
How might trip patterns change?
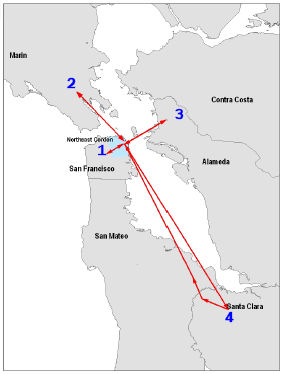
| Origin |
Mode |
Round trip Travel Time |
Cost |
Peak vs. Off-Peak |
| 1. Haight/Ashbury, SF |
Drive Alone |
54 mins |
$2 |
AM/PM peak |
| Switches from drive alone to transit and saves 15 mins/day |
| 2. Mill Valley, Marin |
Drive Alone |
91 mins |
$9 |
Mid-day/PM peak |
| Switches time of day and saves 13 mins/day |
| 3. Rockridge, Alameda |
Transit |
147 mins |
$7 |
AM/PM peak |
| Keeps taking transit and saves 20 mins/day |
| 4. San Jose, Santa Clara |
Carpool |
206 mins |
$62 |
AM/PM peak |
| Keeps carpooling and saves 53 mins/day |
Estimated Economic/Social Benefits
| User Benefits/Costs |
Congestion Charges Paid |
-$145 M |
| Travel Time Savings |
+$370 M |
| Vehicle Operating Cost Savings |
+$30 M |
| Social Benefits/Costs |
Safety, Health, & Environmental Benefits |
+$30 M |
| Congestion Charges Received |
+$145 M |
| Program Costs |
-$65 M |
| Total Benefits/Costs |
Annual Costs |
-$260 M |
| Annual Benefits |
+$620 M |
| Overall Annual Social benefit |
+$360 M |
SF CHAMP 3.1.9, p2007
Values in 2008$ for single representative year
Estimated Travel Time Benefits
| Travel Time Benefits |
Drivers |
+$300 M |
| Transit Riders |
+$70 M |
| Travel Time Benefits |
San Francisco Travelers |
+$115 M |
| Other Regional Travelers |
+$255 M |
SF CHAMP 3.1.9, p2007
Values in 2008$ for single representative year
Economic/business impacts broadly neutral
- Neutral to positive retail impacts expected considering multiple factors:
- retail survey shows comparable to greater spending by transit/ped than
drivers
- 60,000 more transit and walk/bike trips per day in the cordon area
(conservative estimate)
- fleet program to reduce administrative costs to businesses
Average Spending & Frequency by Mode
| Mode |
Drive |
Transit |
Walk |
| Average Spend per Visit |
$56 |
$39 |
$42 |
| Average # Trips per Month |
4 |
7 |
7 |
| Average Spend per Month |
$224 |
$273 |
$294 |
Survey of 1390 travelers in San Francisco's downtown retail areas, December 2007
and April 2008
Distribution of AM Peak Period Travelers by Income & Mode
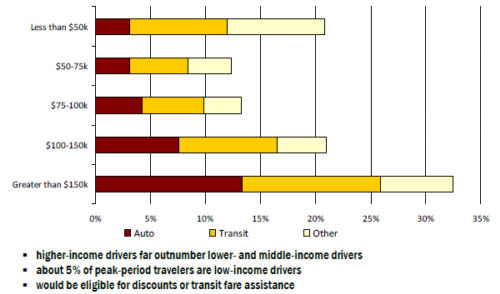
- higher-income drivers far outnumber lower- and middle-income drivers
- about 5% of peak-period travelers are low-income drivers
- would be eligible for discounts or transit fare assistance
Base Year (2005)
Source: SFCTA, SF-CHAMP 3.1.9, p2007
Distribution of Daily Travelers by Trip Purpose
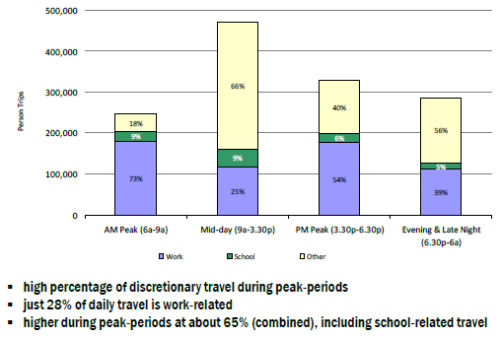
- high percentage of discretionary travel during peak-periods
- just 28% of daily travel is work-related
- higher during peak-periods at about 65% (combined), including school-related
travel
Base Year (2005)
Source: SFCTA, SF-CHAMP 3.1.9, p2007
Distribution of trips, motorists in downtown areas
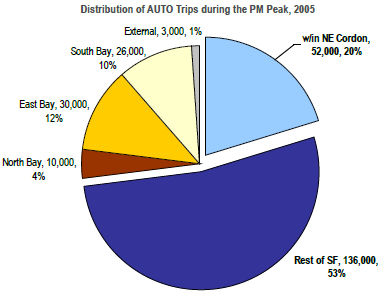
- 2.3M person-trips in the Northeast Cordon daily
- nearly half are auto trips
- over 40% of trips are made during peak periods (17% AM; 25% PM)
- More than half of the 260,000 auto person-trips during the PM peak in the
Northeast Cordon are made by San Francisco residents
Source: SFCTA, SF-CHAMP 3.1.9, p2007
WHAT WE'VE LEARNED FROM TRAVELERS
- 60% of travelers visit downtown SF in off-peak hours
- Vast majority (about 80%) of travelers have transit options
- Top benefits expected: improved environment and traffic reduction
- Top concerns: business impacts, affordability, and skepticism
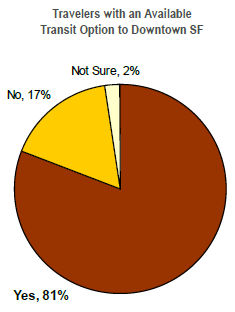
Source: SFCTA Poll of Bay Area Travelers, August 2007
n=~600
Opinions on a potential congestion pricing project for San Francisco (in the
next 3-5 years)
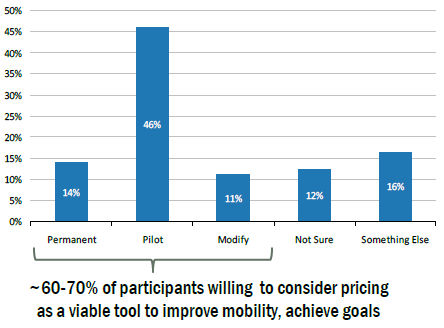
- ~60-70% of participants willing to consider pricing as a viable tool to improve
mobility, achieve goals
Source: SFCTA, summary of local and regional workshops, Fall 2010
n=~400
Status & Next Steps
- Board action December 2010
- congestion pricing is technically feasible
- an appropriately designed program could contribute to goals for mobility
improvement, sustainable growth and reduced impacts on climate change
- identified key areas for consideration moving forward
- Staff pursuing funds for environmental analysis focused on:
- more detailed economic evaluation
- expenditure plan for investments
- implementation plan for improvements
- modeling tools for parking alternatives (& strong coordination w/SFpark)
QUESTIONS/FEEDBACK:
https://www.sfcta.org/projects/downtown-congestion-pricing
www.facebook.com/sfmobility
mobility@sfcta.org
twitter/SanFranciscoTA
415.522.4800
A measured approach - candidate pilot scenarios
Overall study outreach
| Major public events |
4 series of workshops
2 series of webinars
1 series of regional e-townhalls |
| Meetings w/community group & merchant groups |
over 60, 1 - 3 times each |
| Focus groups |
7: drivers, non-drivers, business interests |
| Ongoing Advisory Committee meetings |
4: business, stakeholders/advocates, partner agencies (exec & staff) |
| Number of individuals through direct outreach |
1,000+ |
| Project mailing list |
500+ |
| YouTube video (www.youtube.com/sfcta) |
870+ hits |
| Social Media (Facebook, Twitter, etc.) |
~350 total friends/followers |
| Press hits |
more than 300 |
Potential Timeline
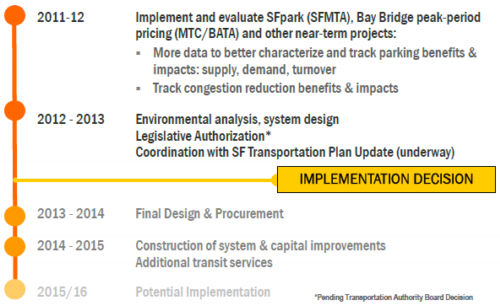
2011-12
- Implement and evaluate SFpark (SFMTA), Bay Bridge peak-period pricing
(MTC/BATA) and other near-term projects:
- More data to better characterize and track parking benefits & impacts:
supply, demand, turnover
- Track congestion reduction benefits & impacts
2012 - 2013
- Environmental analysis, system design
- Legislative Authorization*
- Coordination with SF Transportation Plan Update (underway)
IMPLEMENTATION DECISION
2013 - 2014
- Final Design & Procurement
2014 - 2015
- Construction of system & capital improvements
- Additional transit services
2015/16
*Pending Transportation Authority Board Decision
Institutional considerations & milestones
- Obtain Legislative Authority to toll
- Local ordinance (BoS)
- State authority (legislature, governor)
- Environmental analysis (local/federal approval)
- Designate/create toll authority/agency, functions to include:
- Set toll and discount policy
- Bonding to deliver improvements up front
- Concession with a program operator
- Directly produce or contract for services/capital improvements
- Monitor performance, change fee level/investment program as appropriate
- Governance
- MOAs with MTC/BATA, transit operators
- Joint Powers Authority, e.g. ACCMA/VTA Express lanes
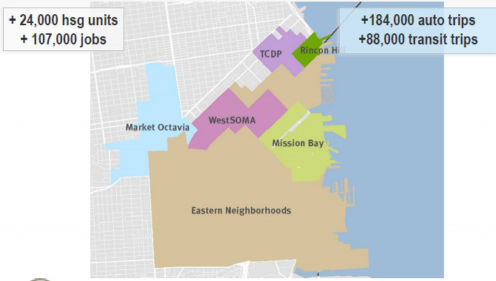
Downtown Growth Planned
- + 24,000 hsg units
- + 107,000 jobs
- +184,000 auto trips
- +88,000 transit trips
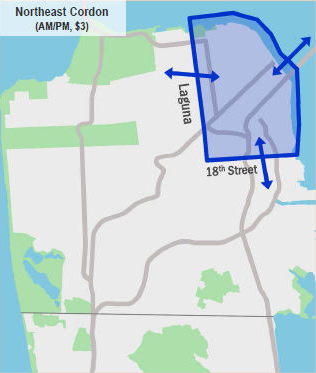
AM/PM Northeast Cordon performs best
- $3 fee on crossings in AM & PM peak
- 12% fewer peak period auto trips
- 21% reduction in vehicle hours of delay
- 16% reduction in Northeast Cordon GHGs (5% citywide GHG reduction)
- $60-80M annual net revenue
- 20-25% transit speed improvement
- 12% reduction in pedestrian incidents
Opinions on next steps broadly consistent among participants throughout region...
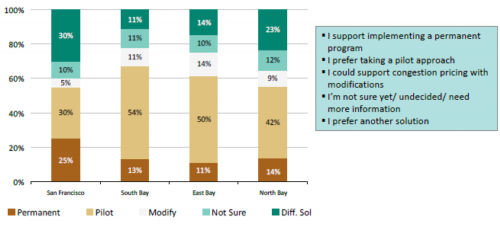
Source: SFCTA, Summary of Feedback, Fall 2010
Opinions change with information...
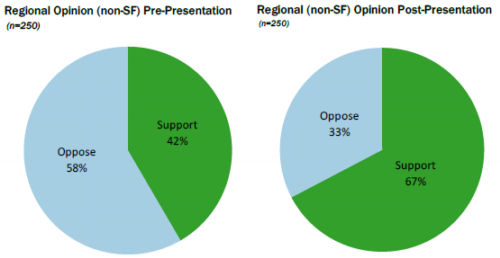
Source: SFCTA, Summary of Feedback, Fall 2010
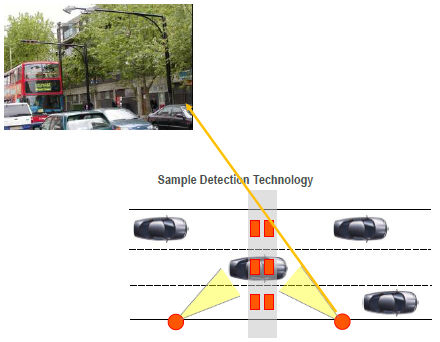
How congestion pricing would work
- Technology would leverage existing systems, e.g. FasTrak accounts
- Design considerations support camera-based equipment
- Multiple payment methods possible
- Phone, web, text, retail, etc.
Support for Studying Congestion Pricing by Income
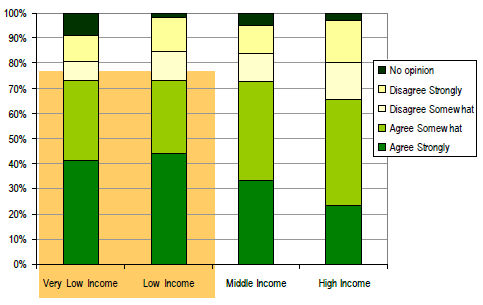
SFCTA, Poll of Bay Area Travelers, August 2007
n=~600
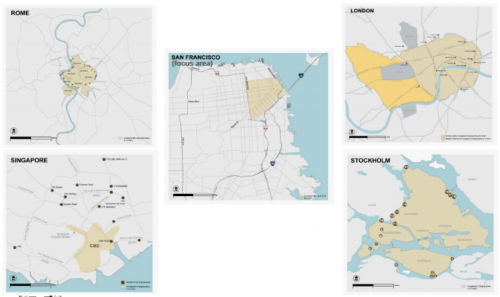
GEOGRAPHY of EXISTING SCHEMES
Part 2: Measuring Economic Costs of Congestion in the New York City Region
Overview of Approach
Ewa Tomaszewska, HDR Corporation
September 22, 2011
HDR - ONE COMPANY | Many Solutions ™
Outline
- Study Background and Purpose
- General Approach
- Implementation
- Sample Study Results
Study Background and Purpose
- In 2006, New York City was assessing hypothetical scenarios of congestion
charges for CBD and their effects on traffic patterns, average speed, and
congestion across the NYC Region
- Certain business groups were expressing concerns over above plans and their
costs to individual businesses that would result under congestion pricing
- To provide a broader perspective on congestion, HDR was retained by
Partnership for New York City to assess the economic costs and impacts of
congestion in the Region
General Approach
- Study focused on the effects of excess congestion above the
economically efficient level
- Maintaining free-flow at all times would under-utilize/waste road capacity
- For given road capacity, there is an economically efficient level of traffic
congestion
- Some level of congestion is beneficial
- Traffic above this level is excess; reduced speeds increase travel time and
create various costs across the economy
- The efficient level of congestion is the traffic volume that would result if
people would altruistically take into account in their travel decisions the
externalities that they create, or delays they cause to all other travelers on
the road
- The actual level of congestion is above this level because people do not
behave in this way
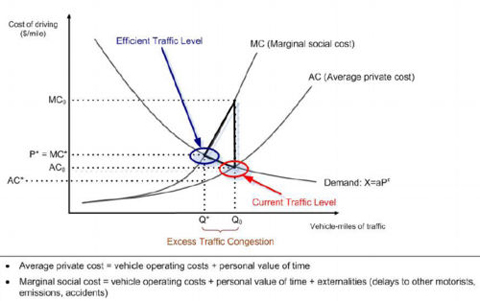
- The difference between the actual traffic and the efficient traffic is the excess congestion
- Technically, the efficient level of congestion is determined by the point
where the travel demand curve intersects the social marginal costs of driving
curve (rather than the average private costs of driving curve)
- Actual versus efficient traffic - typical graphical illustration
- Excess travel and reduced average travel speeds due to excess congestion
generate various costs throughout the economy
- Study assessed the following manifestations of congestion costs
- Time lost to travel (for commuting and other general purposes)
- Excess travel time for commuting and other personal travel (compared to
actual travel time) can be converted into monetary values using value of time
assumptions; represents loss to travelers, less time for leisure and personal
pursuits
- Lower average speeds increase vehicle operating costs (reduced fuel economy)
- Time lost in work travel
- Excess travel time for work purposes can be converted into monetary values
using value of time assumptions; represents loss to employer, loss in productive
work time, or lost productivity
- Other economic costs
- Labor demand impacts: high congestion leads to an increase in labor costs
and reduction in demand for labor
- Employers compensate partially employees for higher commuting costs/longer
commutes in an effort to continue to attract suitable employees but this reduces
overall demand for labour
- Industry-level effects on revenues, operating costs, and employment: lower
average speeds increase total private cost of travel and affect people's
decisions for travel such as trips for shopping or entertainment, make travel
longer, more unreliable, including commercial deliveries of merchandise/supplies
and business service trips
- Higher cost of travel reduces the number of some trips and thus business
revenues of businesses that rely on these trips
- Long and unreliable commercial delivery times inhibit cost-saving strategies
in inventory and logistics management and increase operating cost
- Long travel times reduce productivity of business services
- Industries particularly sensitive to above issues include retail trade,
restaurants, arts and entertainment, construction, manufacturing, taxi cabs,
services and repair
Implementation
- Logic models were built from "bottom-up" that track the underlying
cause-and-effect relationships
- Spreadsheet-based economic model was developed and coded and populated with
data/assumptions for theoretical variables:
- Value of time ($/hour)
- Costs of travel ($/mile)
- Average vehicle speeds (miles/h) in NYC Region
- Elasticity of demand for travel
- Speed-traffic volume relationship
- Current volume of traffic, trips in NYC Region
- Current industry sales and employment in NYC Region
- Elasticity of logistics costs wrt travel times; share of logistics in total
costs and sales
- Major sources of data :
- Previous study by other consultants on traffic in NYC Region and potential
impact of congestion charges
- US population and economic Census
- New York Metropolitan Transportation Council publications
- Freight-Benefit Cost Study (2002 study for FHWA by HLB and other
consultants) on the benefits of freight transportation improvements
- Related economics literature on congestion issues and impacts
- Related trade/association publications
- All costs and impact estimated by NYC sub-area/county and summed across
- Due to data limitations some impacts (industry impacts) estimated for one or
two areas and extended/prorated to entire NYC Region
Sample Study Results
Summary of impacts, by type of effects
| Type of Effect |
Estimated Impact ($ Millions) |
| Travel costs |
|
| Travel costs, total |
$4,972 |
| Car-commuting costs |
$2,170 |
| Car travel for business |
$615 |
| Total, car travel for work and business |
$2,785 |
| Industry logistic costs |
$1,911 |
| Vehicle operating costs |
$200-$2,000 |
| Economic Activity Indicator |
|
| Gross Regional Product |
-$4,022 |
| Employment (number of jobs) |
-51,515 |
Impacts of excess congestion on industry revenue, operating costs,
and employment, total and selected industries
| Category of Impact |
Total |
Retail |
Restaurants |
Construction |
Manufacturing |
Wholesale |
| Reduction in Revenue, $Millions/Year |
$4,578 |
$260 |
$214 |
$156 |
$247 |
$1,279 |
| Increase in Operating Costs, $Millions/Year |
$1,911 |
$221 |
$9 |
$1,282 |
$2,035 |
NA |
| Reduction in Employment, FTE/Year |
$22,285 |
$1,079 |
$2,043 |
$5,218 |
$8,674 |
NA |
Impacts of excess congestion relative to industry size
| Industry |
Revenue Impacts in Region in % of Total Revenue |
Operating Cost Impact in Region in % of Total Revenue |
| Construction |
1.33% |
0.16% |
| Manufacturing |
1.28% |
0.16% |
| Wholesale |
|
0.23% |
| Retail |
0.11% |
0.09% |
| Health Care & Social Services |
0.33% |
|
| Arts & Entertainment |
0.76% |
|
| Restaurants |
0.81% |
0.03% |
| Business Repair & Maintenance |
3.60% |
|
Geographic distribution of impact (employment)
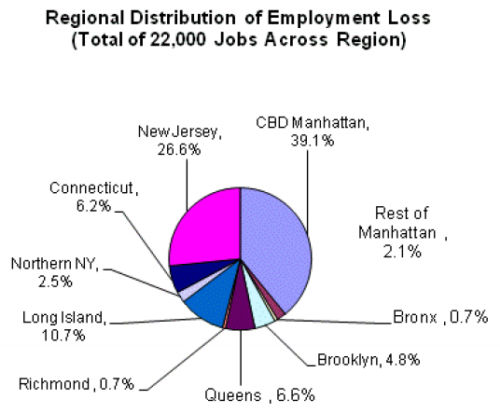
Regional Distribution of Employment Loss (Total of 22,000 Jobs Across Region)
- New Jersey, 26.6%
- Connecticut, 6.2%
- Norther NY, 2.5%
- Long Island, 10.7%
- Richmond, 0.7%
- Queens, 6.6%
- Brooklyn, 4.8%
- Bronx, 0.7%
- CBD Manhattan, 39.1%
- Rest of Manhattan, 2.1%
Part 3: The Impacts of Freight Road Pricing on Businesses: Empirical Evidence
José Holguín-Veras,
William H. Hart Professor,
Director of the Center for Infrastructure, Transportation, and the Environment
Rensselaer Polytechnic Institute
jhv@rpi.edu

Empirical evidence of impacts of freight pricing
- Extremely limited
- The experience of toll roads, not always analyzed
- Implementations that have been studied:
- Intercity:
- Ohio Turnpike (ex-post analysis)
- Urban:
- New York City (2001)
- London (2003) (though not discussed here, results are similar to the ones for NYC)
Part I: Empirical Evidence
- The Intercity Case -
Swan, P. and M. Belzer (2010). "Empirical Evidence of Toll Road Traffic Diversion and Implications for Highway Infrastructure Privatization." Public Works Management Policy 14(4): 351-373. 10.1177/1087724X09360806
Case study: The Ohio Turnpike
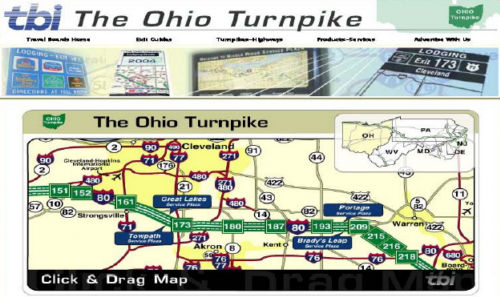
- The case analyzed
- Truck tolls increased in the 1990s to finance construction
- Trucks shifted routes and began using local routes
- Communities complained about surge in truck traffic
- Truck tolls were lowered to attract truck traffic
- Tolls
- Before 1983: $21.50
- 1983 - 1994: $23.25
- 1995 - 2005: Gradually increased to $42.45
- After 2005: $31.00 (due a subsidy from the state)
Approach
- Swan and Belzer:
- Estimated the Truck VMT for the Ohio Turnpike
- Estimated regression models linking truck VMT (at the turnpike) to independent variables:
- US Truck VMT
- Tolls at the Ohio Turnpike (nominal and real)
- Speeds
Table 3: OLS Results
| Independent Variables |
Model 1 Coefficients |
Model 2 Coefficients |
| U.S. Truck (billions) |
5.1328*** |
5.2659*** |
| Nominal_Rate x US Truck |
-0.029099*** |
|
| Real_Rate x US Truck |
|
-0.04642*** |
| Speed x US Truck |
0.038145* |
0.02946 |
| Constant |
|
|
| F |
4,215*** |
3,817*** |
| N |
16 |
16 |
| Adjusted R-squared |
0.9987 |
0.9986 |
Key findings
- Some intercity trucks could shift routes
- Implication:
They could not pass toll costs, and tried to avoid the toll
- Nothing is known about the carriers that remained:
- How many passed the toll costs?
- How many had to absorb the tolls?
- How many reacted in other ways in response to the toll?
Part II: Empirical Evidence
- Urban Deliveries -
Port Authority of New York and New Jersey's Time of Day Pricing Initiative
Holguín-Veras, J., Q. Wang, N. Xu, K. Ozbay, M. Cetin and J. Polimeni (2006). "The Impacts of Time of Day Pricing on the Behavior of Freight Carriers in a Congested Urban Area: Implications to Road Pricing." Transportation Research Part A: Policy and Practice 40 (9): 744-766.
This presentation is based on:
- A significant amount of outreach/data collection:
- Revealed Preference data post pricing implementation
- Dozens of in depth interviews with industry
- Four focus groups with industry representatives
- The first project that collected behavioral data
The PANYNJ 2001 time of day pricing initiative
- Implemented a time of day pricing policy
- Provided an opportunity to assess behavioral impacts
- Rensselaer conducted the evaluation for FHWA, and collected behavioral data before/post pricing
Table 3: OLS Results
| Type of vehicle |
Passenger cars |
Trucks |
| |
Before |
After |
Before |
After |
| Cash peak |
$4.00 / car |
$6.00 / car |
$4.00 / axle |
$6.00 / axle |
| Cash off-peak |
$4.00 / car |
$6.00 / car |
$4.00 / axle |
$6.00 / axle |
| E-ZPass peak |
$3.60 / car |
$5.00 / car |
$3.60 / axle |
$6.00 / axle |
| E-ZPass off-peak |
$3.60 / car |
$4.00 / car |
$3.60 / axle |
$5.00 / axle |
| E-ZPass overnight |
$3.60 / axle |
$3.50 / axle |
Note: (1) Tolls are collected in the Eastbound (New York bound) direction only; (2) the peak hours are 6-9 AM and 4-7 PM on weekdays and 12 noon-8 PM on weekends; (3) the overnight period (trucks) is from midnight to 6 AM on weekdays; (4) the remaining hours are classified as off-peak hours (PANYNJ, 2005e).
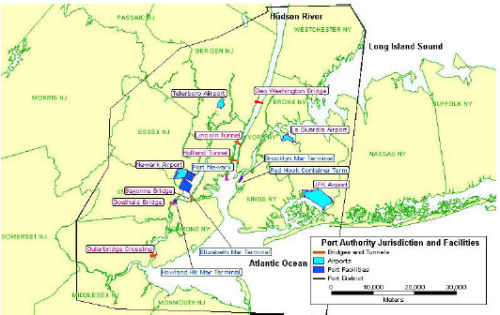
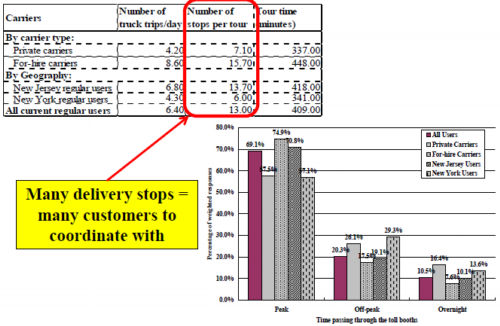
The PANYNJ Facilities
Operational Patterns
- Many delivery stops = many customers to coordinate with
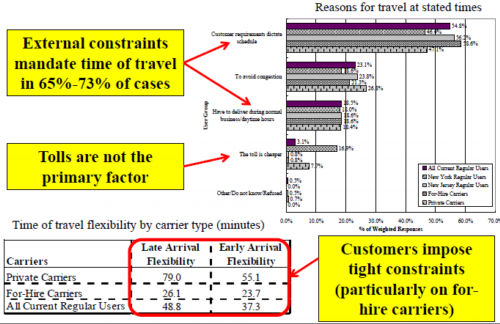
Reasons for travel at stated times
- External constraints mandate time of travel in 65%-73% of cases
- Tolls are not the primary factor
- Customers impose tight constraints (particularly on for-hire carriers)
The PANYNJ 2001 time of day pricing initiative
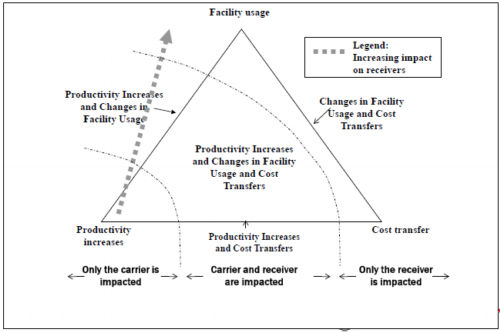
Behavioral Changes Reported by Carriers
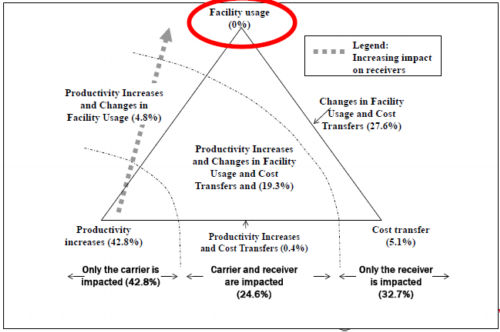
Empirical evidence: Summary
- 20.2% of the sample changed behavior (implementing productivity increases, changes in facility use, and cost transfers)
- 69.8% of the carriers that did not change behavior indicated it was due to "customer requirements"
- Only 9.0% of the sample increased rates
- cost transfers were relatively small, about 15%
Reasons for not changing behavior
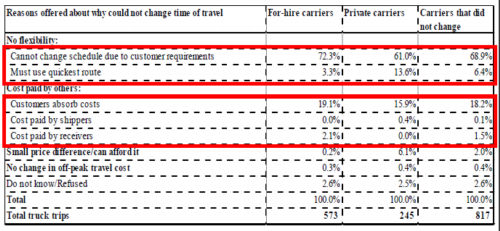
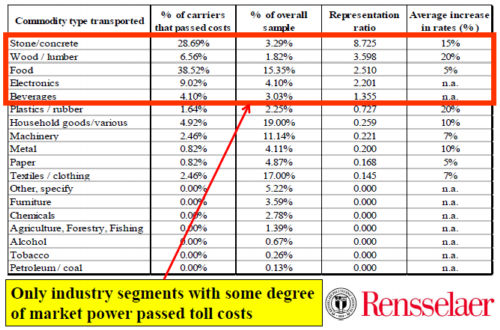
Breakdown of carriers that passed toll costs
- Only industry segments with some degree of market power passed toll costs
What is the difference between intercity and urban?
Intercity case
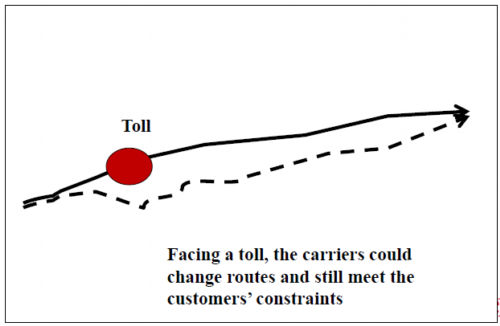
- Facing a toll, the carriers could change routes and still meet the customers' constraints
Urban deliveries
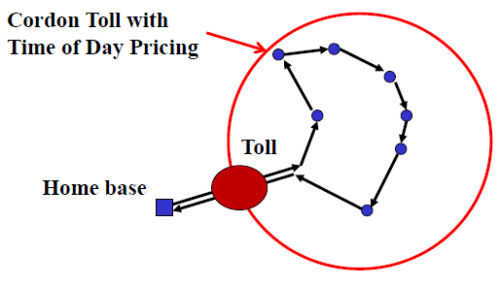
- The only way to avoid a toll is to change time of travel
- Will impact delivery times
- Will not be accepted by the receivers
Impacts on businesses
Impacts are mixed...
- Two sets of agents are involved:
- Carriers are the weakest element of the supply chain
- After years of deregulation, there is over supply
- This limits their market power
- In essence, which agent is impacted depends on:
- Who has more clout (market power)
- Availability of alternatives to the carriers
Key cases
- There are alternatives to the carriers (e.g. intercity):
- If tolls are "small" carriers would use tolled alternative
- If tolls are "large" carriers would use alternative routes
- Leading to increase traffic in alternative routes
- Those with market power will pass toll costs to others
- Those without market power will swallow the tolls
- There are no alternatives (e.g., urban):
- Those with market power will pass toll costs to others (11% in NYC)
- Those without market power will swallow the tolls (89% in NYC)
In summary
- The very limited empirical evidence available indicates that:
- The bulk of the impacts of tolls fall on the carriers
- Other agents (e.g., shippers, receivers) impacted much less
- This implies that:
- No major impacts reach end consumers
- Carriers' profitability suffer
- The constraints imposed by receivers limit the effectiveness of freight pricing for demand management purposes
- Careful consideration of these factors is needed to ensure that the impacts of pricing are equitable shared among all participants in the supply chains
Thanks!
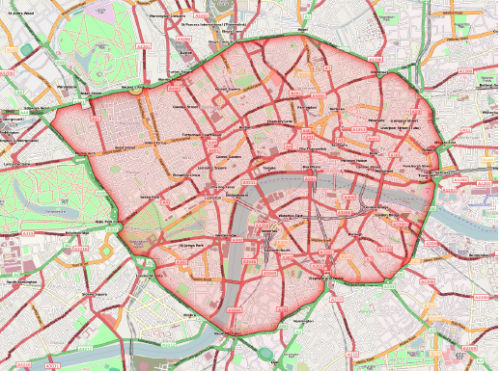
London's Congestion Charge
Leape, J. (2006). "The London Congestion Charge." Journal of Economic Perspectives 20(4): 157-176.
Transport for London (2010) "Travel in London Report 2" http://www.tfl.gov.uk/assets/downloads/corporate/Travel_in_London_Report_2.pdf
Background
- Introduced in Central London on February 2003
- Extended into parts of West London on February '07
- West London extension reduced in May 2010
- Toll
- Originally GB5, then GB8, and now GB10
London's Congestion Charge Zone
http://upload.wikimedia.org/wikipedia/commons/1/15/London_congestion_charge_zone.png
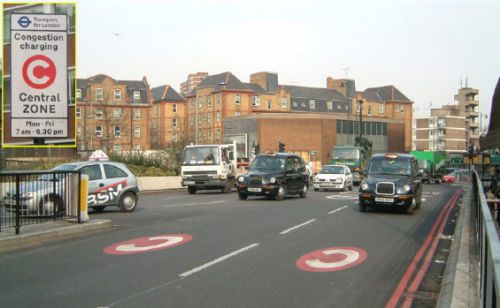
http://en.wikipedia.org/wiki/File:London_Congestion_Charge,_Old_Street,_England.jpg
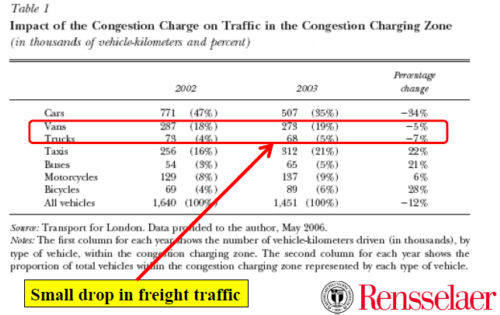
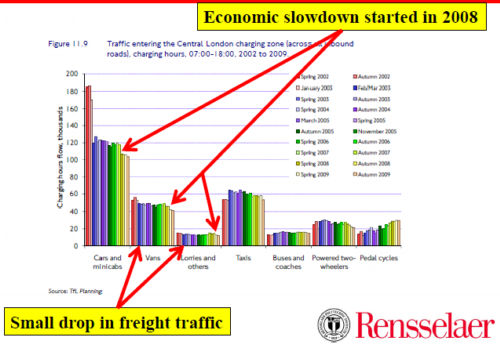
Key finding
- Congestion pricing did produce a small impact on freight traffic
- Not sure what was the actual behavioral response, it cannot be elicited from traffic data


