Patrick DeCorla-Souza, Tolling and Pricing Program Manager, FHWA
Lee Munnich, Humphrey Institute, University of Minnesota
Kenneth Buckeye, Minnesota Department of Transportation
John Doan, SRF Consulting
Center for Innovative Finance Support
Federal Highway Administration
Ninth Part of a Webinar Series on Overcoming the Challenges of Congestion Pricing.
Session 9: Integrating Transit with Congestion Pricing and Increasing Congestion
Pricing Acceptance - Presentations
Audio:
- Via Computer - No action needed
- Via Telephone - Mute computer speakers, call 1-866-863-9293 passcode 57922142
Presentations by:
- Brian Pessaro, Senior Research Associate, University of South Florida Center
for Urban Transportation, pessaro@cutr.usf.edu
- Adam Harrington, Assistant Director of Route and System Planning, Metro Transit
(Minneapolis, MN), adam.harrington@metc.state.mn.us
- Chris Burke, I-15 Program Manager, San Diego Association of Governments, cbur@sandag.org
Audience Q&A: addressed after each presentation, please type
your questions into the chat area on the right side of the screen
Closed captioning was available at: http://www.fedrcc.us//Enter.aspx?EventID=1811816&CustomerID=321
Upcoming Webinars:
Visit https://ops.fhwa.dot.gov/congestionpricing/webinars/index.htm
Recordings and Materials from Previous Webinars: https://www.fhwa.dot.gov/ipd/tolling_and_pricing/resources/webinars/congestion_pricing_2011.aspx
Upcoming Webinars:
November 17, 2011 - Best Practices in Parking Pricing
December 15, 2011 - Results of the Urban Partnership and Congestion Reduction Demonstration
Programs
Part 1: Integrating Transit with Congestion Pricing: A Review of the Miami and Minneapolis
UPAs: A Review of the Miami and Minneapolis UPAs
FHWA Webinar Series
October 27, 2011
URBAN PARTNERSHIP AGREEMENT PROGRAM
- $1 Billion congestion relief program
- Additional $300 Million for the Congestion Reduction Demonstration Program
- USDOT sought applications that used the 4T's:
- Tolling
- Transit
- Telecommuting
- Technology
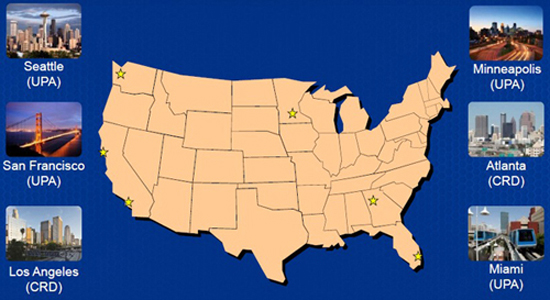
- Awards made to...
- Seattle (UPA)
- San Francisco (UPA)
- Los Angeles (CRD)
- Minneapolis (UPA)
- Atlanta (CRD)
- Miami (UPA)
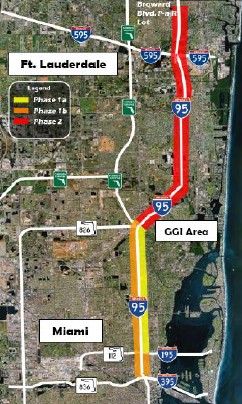
Miami UPA (I-95)
- HOV to HOT conversion
- 3 Phases
- Phase 1A - Dec. 2008
- Phase 1B - Jan. 2010
- Phase 2 - mid 2014
- 2 HOT lanes per direction
- Separated by plastic poles
- Dynamic pricing
- Registered 3+ carpools free
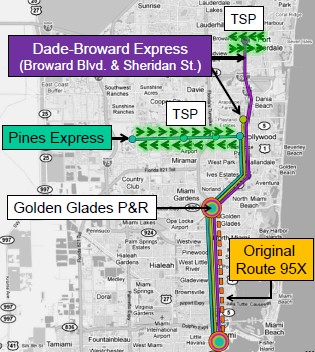
Phase 1 Transit Improvements
- 2 new routes
- Pines Blvd. Express
- Dade-Broward Express Golden Glades P&R
- 500 new spaces Transit Signal Priority
- Pines Blvd.
- Broward Blvd.
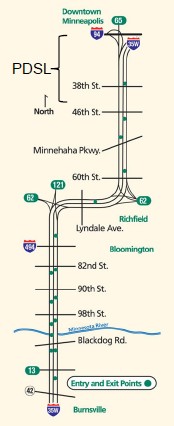
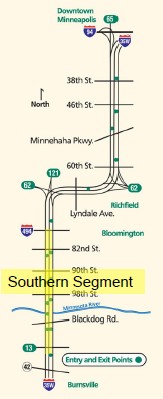
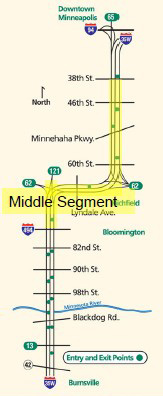
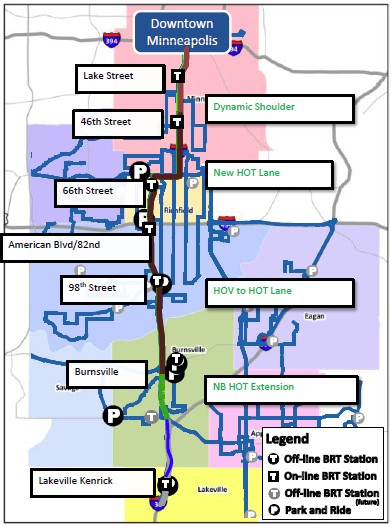
Minnesota UPA (I-35W)
- HOV to HOT + new HOT lanes
- Fully opened Nov. 2010
- 1 HOT lane per direction (except PDSL segment)
- Stripe separation
- Dynamic pricing
- Multiple entry/exit points
- 2+ carpools free
- Open to all traffic in off-peak (except PDSL segment)
Minnesota UPA (I-35W) Transit Improvements
- Added bus service
- 6 new or expanded park-n-rides
- 1 transit bypass lane
- Contra-flow bus only lanes
- ITS technology
Transit Hypotheses & Question
- The UPA project will enhance transit performance on the UPA corridors
- The UPA project will increase ridership and facilitate a mode shift to transit
- Transit mode shift/increased ridership will contribute to congestion mitigation
- What was the contribution of each UPA project element to increased ridership
and/or mode shift to transit?
Miami UPA Transit Results (2008 - 2010 Data)
- Proven
- Average travel times in Express Lanes improved from 25 to 8 minutes.
- Average travel speeds went from 18 to 57 mph.
- Scheduled travel times reduced by 10 minutes (northbound) and 7 minutes (southbound).
- On-time performance improved from 76% to 81%.
- A.M. bus travel times on Pines Blvd. reduced by 12% because of TSP.
- Average weekday ridership increased 57%.
- Not Proven
- Boardings per revenue mile dropped 14%.
- Average vehicle occupancy
- dropped from 2.20 to 1.36 (a.m.)
- dropped from 1.95 to 1.46. (p.m.)
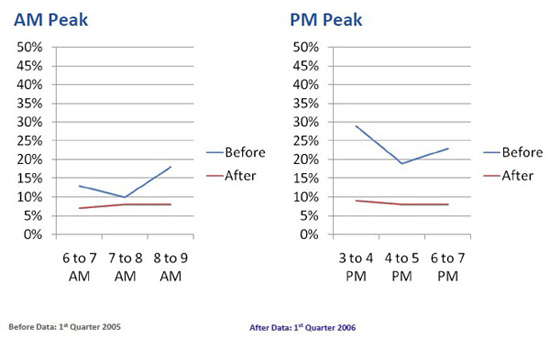
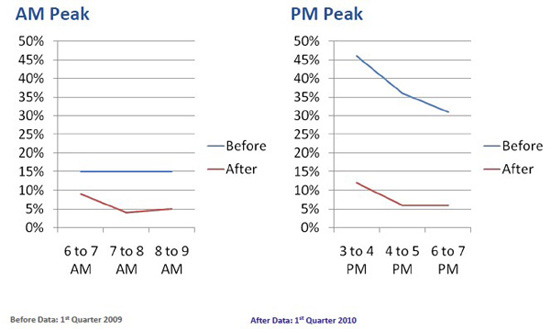
- Transit mode share
- dropped from 19% to 16% (a.m.)
- dropped from 15% to 14% (p.m.)
Unemployment Rate in Miami-Dade
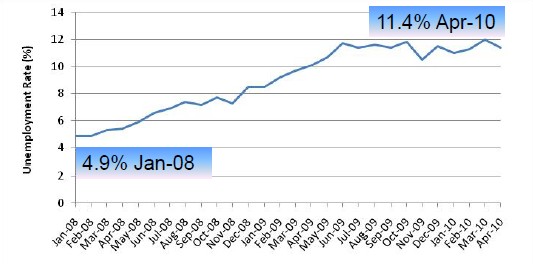
Unemployment Rate in Miami-Dade County
Source: U.S. Department of Labor
Unemployment v. MDT Ridership
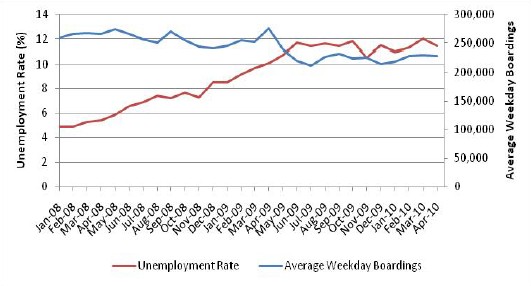
Ridership is for all MDT MetroBus
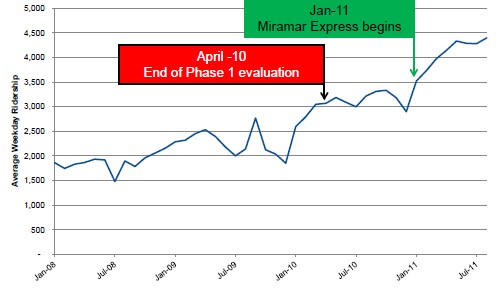
Unemployment v. 95 Express Bus
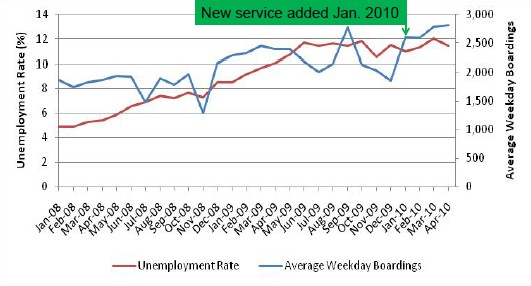
Ridership for all 95 Express Bus routes
Ridership Continues Upward
Miami UPA Hypothesis 3 Results
- Proven
- Total person throughput for the Express Lanes increased 42%.
- Person throughput from transit increased while person throughput from HOVs decreased.
Miami UPA Hypothesis 4 Results
- Proven
- 53% of new 95 Express Bus riders said the Express Lanes influenced their decision
to use transit.
- 38% of new 95 Express Bus riders used to drive alone.
- 34% switched from Tri-Rail and/or MetroRail.
- 86% have access to vehicle always or most of the time.
Minnesota UPA Transit Results (2009 - 2011 Data)
Minnesota UPA Hypothesis 1 Results
| Average Speeds (mph) |
| |
2008 |
2011 |
Percent Change 08-11 |
| Marquette Ave. AM |
5.1 |
6.7 |
31% |
| Marquette Ave. PM |
3.9 |
5.7 |
48% |
| 2nd Ave. AM |
4.3 |
7.4 |
74% |
| 2nd Ave. PM |
4.0 |
6.4 |
57% |
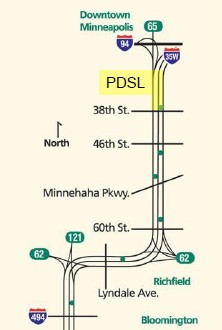
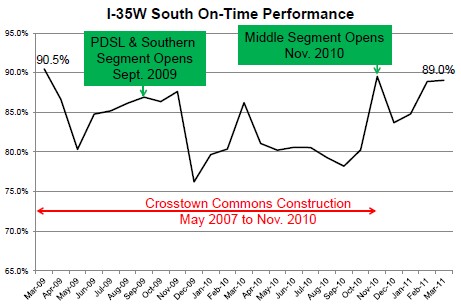
- Priced Dynamic Shoulder Lanes opened in Sept. 2009
- Note: PDSL is northbound only
| Travel Speeds (mph) |
| Apr. 2009 |
Apr. 2011 |
| 41 mph |
35 mph |
- HOT Lanes Southern Segment opened in Sept. 2009
| Travel Speeds (mph) |
| |
Apr. 2009 |
Apr. 2011 |
| Northbound |
61 mph |
52 mph |
| Southbound |
52 mph |
52 mph |
- HOT Lanes Middle Segment opened in Nov. 2010
| Travel Speeds (mph) |
| |
Apr. 2009 |
Apr. 2011 |
| Northbound |
28 mph |
57 mph |
| Southbound |
47 mph |
57 mph |
Minnesota UPA Hypothesis 2 Results
| Average Weekday Ridership by Corridor |
| I-35W North |
7.0% |
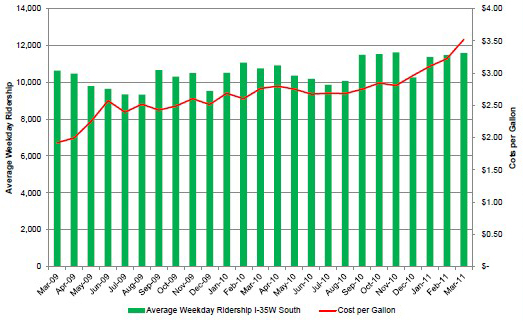
| I-35W South |
9.0% |
| I-394 |
2.4% |
| I-94N |
4.5% |
Percentages are between March 2009 and March 2011
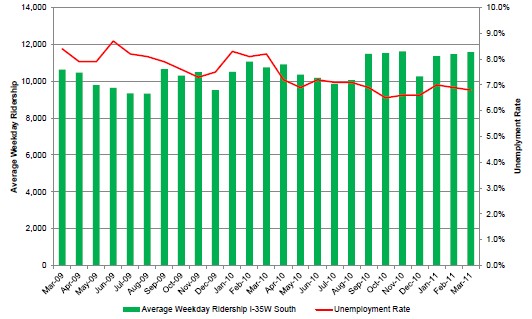
I-35W South Ridership vs. Unemployment
I-35W South Ridership vs. Cost per Gallon
Minnesota UPA Transit Rider Survey
- June 2010 survey of all I-35W routes.
- Post deployment for PDSL, Southern Segment, and MARQ2 lanes.
- Transit has attracted new choice commuters.
- 95% of all riders were riding to work
- 32% are new riders (1 year or less)
- 26% of new riders used to drive alone
- Riders happy with bus reliability and travel times.
- 91% rated bus reliability very good or good
- 85% rated bus travel time very good or good
- Overall HOT lanes haven't changed these perceptions.
- 57% rated reliability the same; 22% said it was now better
- 48% rated travel times the same; 26% said they were now better
- Bus Arrival Time Signs
- 86% have seen them
- 8% were influenced by them
- Impact of MARQ2 lanes
- 55% said service speed better
- 46% said service reliability better
I-35W Express Bus Rider Demographics
| Category |
I-35W Riders |
All Metro Riders |
| Aged 35 to 64 |
66% |
48% |
| Caucasian |
86% |
2.4% |
| African-American |
4% |
4.5% |
| Gender |
Male |
Female |
Male |
Female |
| 38% |
62% |
59% |
41% |
| Household income > $60K |
69% |
27% |
| Household income < $20K |
3% |
32% |
| Access to at least 1 car |
94% |
56% |
Comments / Questions?
Contact: Brian Pessaro, AICP
Senior Research Associate
Center for Urban Transportation Research
University of South Florida
(813) 974-5113
pessaro@cutr.usf.edu

Part 2: Twin Cities Managed Lanes and the Transit Advantage
Metro Transit: a Service of the Metropolitan Council
- Urban Local
- 70 routes
- 5,500 weekday bus trips
- 185,151 average daily rides
- Hiawatha Line Light Rail
- 245 weekday train trips
- 31,000 average daily rides
- Northstar Commuter Rail
- 12 weekday train trips
- 2,200 average daily rides
- Suburban Local
- 48 routes
- 1,350 weekday bus trips
- 13,600 average daily rides
- Express Service & Park & Rides
- 100 routes
- 2,200 weekday bus trips
- 45,500 average daily rides
- 111 park & rides
- 28,860 park & ride spaces
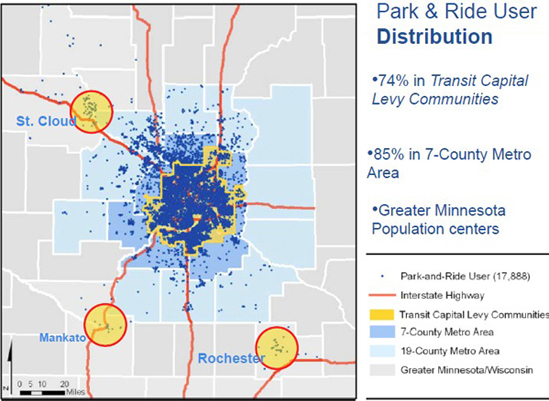
Park & Ride User Distribution
- 74% in Transit Capital Levy Communities
- 85% in 7-County Metro Area
- Greater Minnesota Population centers
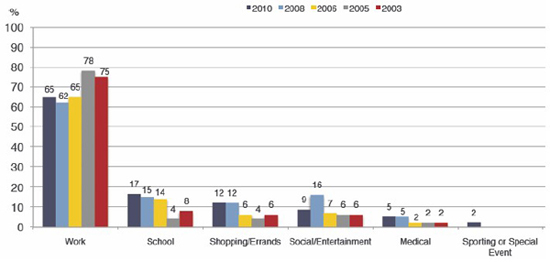
Trip Purpose
Transit Market Factors
- Auto ownership
- Employment Density
- Fuel cost
- Parking availability and cost
- Compete with auto travel time and reliability
- Congestion on streets and highways
- Transit advantages
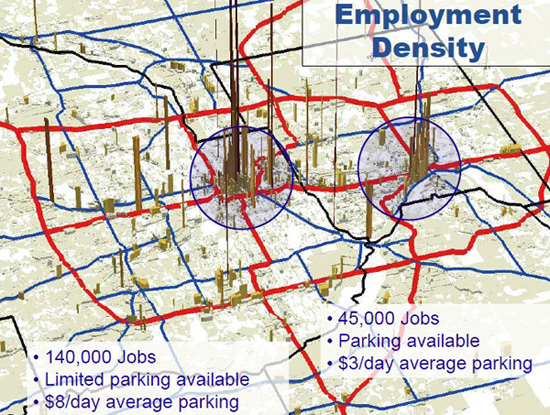
Employment Density
- Map Zone 1 (right side)
- 140,000 Jobs
- Limited parking available
- $8/day average parking
- Map Zone 2 (left side)
- 45,000 Jobs
- Parking available
- $3/day average parking
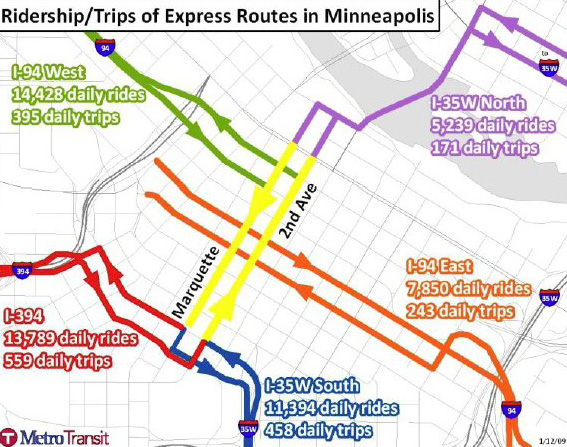
Express Service to Downtown Minneapolis
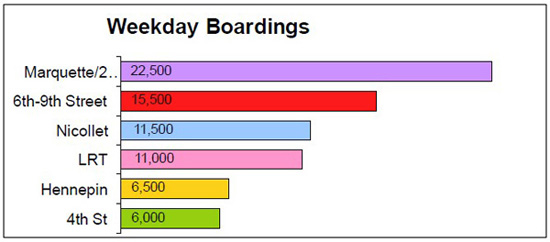
Downtown Minneapolis Transit
Transit vs. SOV
- Time and Speed
- Reliability
- Convenience
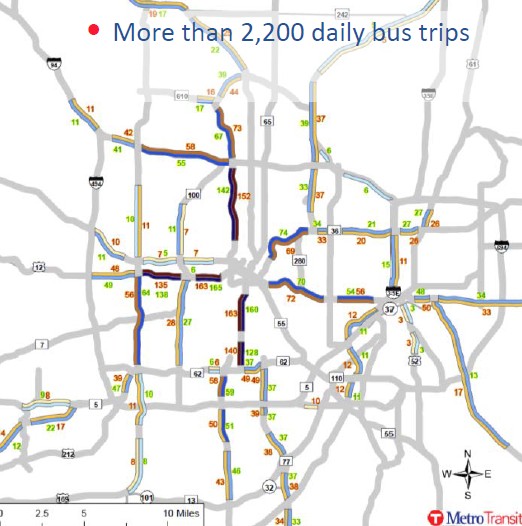
More than 2,200 daily bus trips
Managed Lanes: The Next Generation - Can We Improve Performance
- Urban Partnership Agreement
- Tolling, Transit, Telecommuting
& Technology
Transit Benefits of Managed Lanes
- Speed
- Reliability
- Revenue sharing
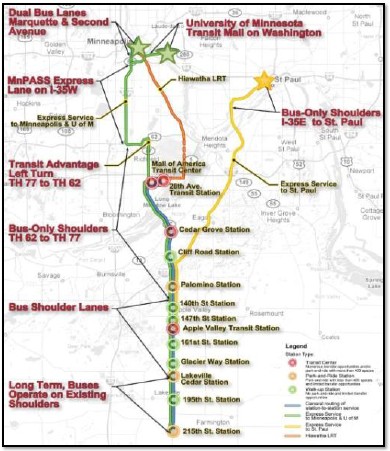
I-35W BRT Overview
- Express service
- Fast, direct to downtown
- Park & ride facilities
- MnPass Express Lanes
- High quality stations
- "Station-to-Station" service
- Fast, frequent, all stops, both directions, all day
- Unique vehicles
- Integrated Network
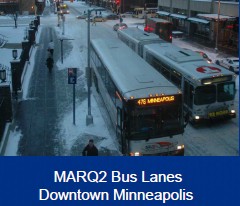
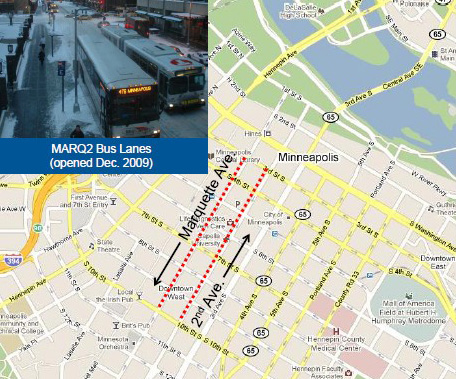
Downtown Minneapolis MARQ2 Bus operations
- Standard Operating Procedure
- 2 Stop Groups per Block
- 180 buses/hour (3x a single lane)
I-35W and 46th Street Online Station
- Opened December 6, 2010
- New service plan offers increased frequency to additional destinations; early
ridership growth observed
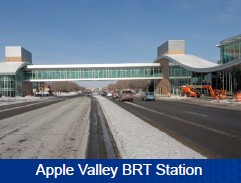
UPA investment for Cedar Avenue BRT 2012
- Minneapolis MARQ2
- Transit bypass lane Hwy 62
- Apple Valley Transit Station
- Cedar Grove Park & Ride
- Lakeville Cedar Park & Ride
Two MnPASS Corridors The Same and Very Different
I-394 & 35W MnPASS Corridors
Similarities
- Brand
- Pricing Algorithms
- Toll Infrastructure
- Hours of Tolling
- Carpools and Buses Free
- Customer Geography
- Customer Utilization
- Performance
Differences
- Road Design
- Access Design
- I-394: 75% Closed Access
- I-35W: 75% Open Access
- Active Traffic Management
- Signing
- Start-up Staging
- Performance
Changes in Violation Rates Before and After MnPASS Implementation
Changes in Violation Rates: Before and After MnPASS Implementation
MnPASS Users Satisfied with Congestion Pricing
- 91% overall satisfaction
- 95% satisfaction with all electronic tolling
- 85% satisfaction with traffic speed in lane
- 76% satisfaction with dynamic pricing
- 66% satisfaction with safety of merging
Data from Survey of 500 MnPASS account holders in 2009
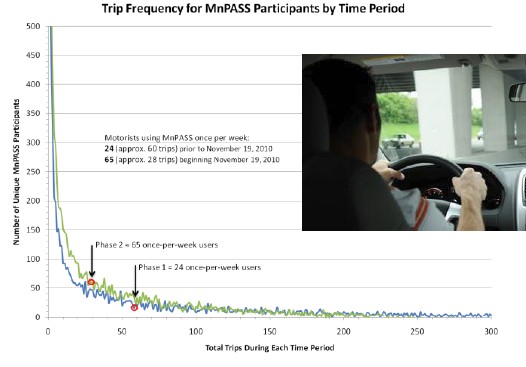
MnPASS Customers Distribution Trips per Account
MNPASS Revenue from I-35W
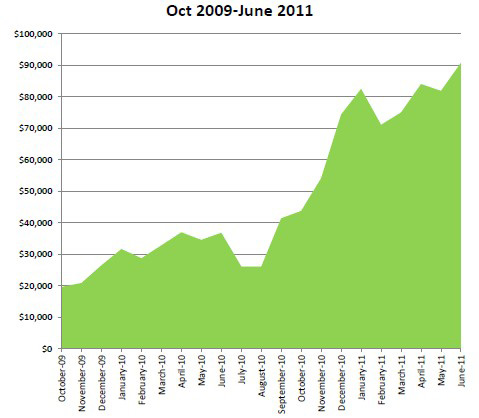
Comparison of Two Managed Facilities
35W
- 4,800 Active Transponders
- 190,000 Trips
- $161,000 in Gross Toll Revenue
- Average of 40 Trips per Transponder
- Average Toll of $0.85
394
- 9,000 Active Transponders
- 400,000 Trips
- $291,000 in Gross Revenue
- Average of 44 Trips per Transponder
- Average Toll of $0.73
Bottom line: similar patterns for users on frequency of use, revenue per user, trip
lengths, and market areas in the two start-up periods ...but slower growth in customer
base/revenue on 35W due to phased implementation
First Six Full Months for each MnPASS Facility
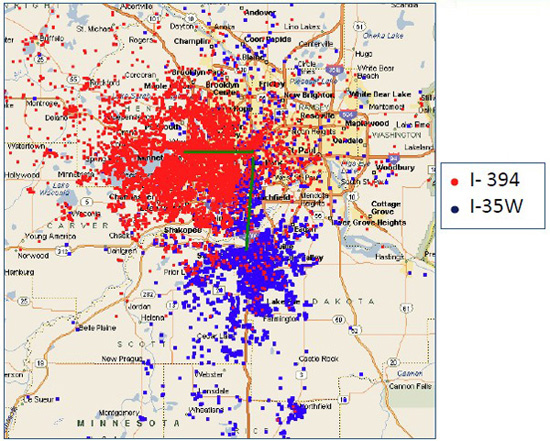
MNPASS Customer Origins
35W South Transit Results
- 750 new parking spaces
- Operating speeds improved
- I-35W at posted speeds in congested conditions
- Downtown Minneapolis from 4 mph to 6mph
- On-time performance improved
- Lake Street Impact: operational change Sept 2011
- I-35W South bus ridership up 15% over past year
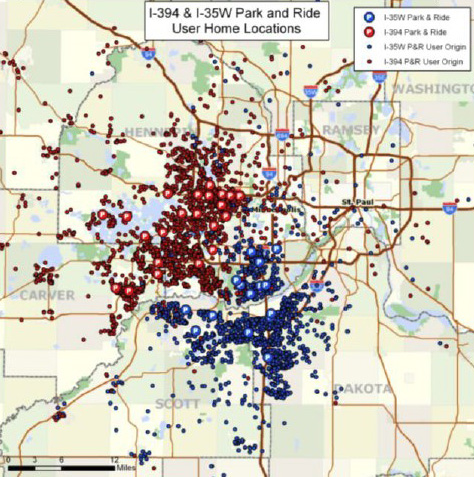
Transit Customer Origins
5 Years of MnPASS
- Congestion Pricing Works...in providing congestion free choices to users
- Customers like MnPASS
- MnPASS enables transit service improvements, transit ridership increases
- Technology can be used to substantially reduce roadway capital costs
- Revenue (in the Minnesota design):
- Policies on who pays and who is free (carpools free?)
- Pricing objective: congestion vs. revenue (different revenue outcomes for each)
- Congestion levels - the more congestion a user can avoid the more they will
pay to avoid it
- Minimum prices - pricing for congestion may result in the price being set below
what users are willing to pay
- Marketing /Customers Service levels - the system must be treated like a product.
On-going investment in customer service and marketing are required to recruit /retain
customers and grow revenue
- Network effects: revenue increases faster than operating costs as the system
expands
NEXT!
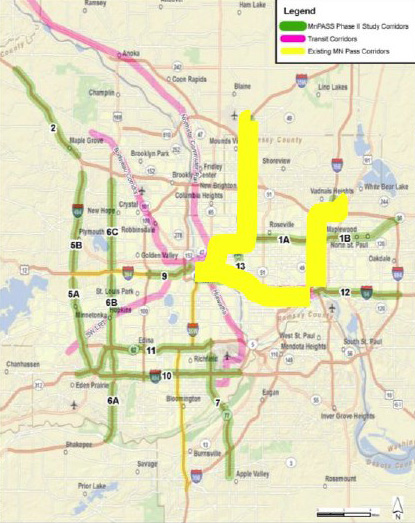
- TH 36: I-35W to I-694
- I-94: TH 101 to I-494
- I-35E: I-94 to CR E (highlighted yellow)
- I-35W: Minneapolis to Blaine (highlighted yellow)
- I-494: TH 212 to I-94
- TH 169: TH 101 to I-94
- TH 77: 141st Street to TH 62
- I-94: Downtown Minneapolis to Downtown Saint Paul (highlighted yellow)
- I-394: TH 100 to I-94
- I-494: TH 212 to MSP Airport
- TH 212/TH 62: TH 5 to TH 77
- I-94: Downtown Saint Paul to I-694
- TH 280: I-94 to I-35W
More Information:
Visit
http://www.dot.state.mn.us/mnpass/
www.metrotransit.org
Part 3: San Diego's Managed Lanes and Bus Rapid Transit Integrating Transit with
Congestion Pricing and Increasing Congestion Pricing Acceptance

Overview I-15 Express Lanes Project
In the Beginning - I-15 Express Lanes
- Enabling Legislation states:
"... remaining revenue shall be used in the I-15 corridor exclusively for (A) the
improvement of transit service, including, but not limited to, support for transit
operations ... "
I-15 Express Lanes Successes
- Increased use of HOV Lanes
- Up to 20,000 Avg. Daily Vehicles (~75% HOV, 25% FasTrak users)
- Provides travel choices
- Transit, carpooling, FasTrak
- FasTrak revenue used to fund I-15 transit service
- Generated over $7 million for transit in first decade
Managed Lanes: A Regional Framework Goals:
- Increase operating efficiency of freeway system versus new freeways
- Increase travel choices - ridesharing, transit, value pricing
- Provide time competitive travel times for car/vanpools and transit
- Extend FasTrak, including funding for BRT services
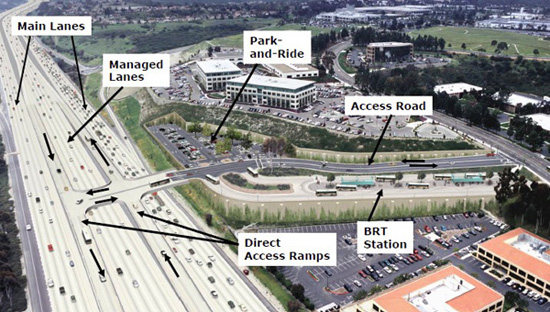
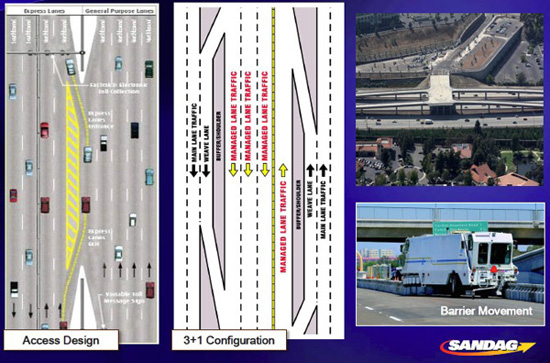
I-15 Express Lanes Design
I-15 Express Bus Ridership (Peak Period)
| Route # |
FY11 |
FY10 |
FY09 |
All Metro Riders |
| Route 810 |
146,763 |
128,714 |
114,387 |
97,869 |
| Route 820 |
46,892 |
50,864 |
51,200 |
45,274 |
| Route 850 |
46,224 |
47,025 |
62,866 |
65,362 |
| Route 860 |
38,699 |
43,164 |
61,844 |
59,643 |
| Route 880 (March-June, FY09) |
17,504 |
29,936 |
2,209 |
N/A |
| PREMIUM EXPRESS TOTAL |
296,082 |
299,703 |
292,506 |
268,148 |
| Route 210 |
74,866 |
85,834 |
88,121 |
75,947 |
| CORRIDOR TOTAL |
370,948 |
385,537 |
380,627 |
344,095 |
What is BRT?
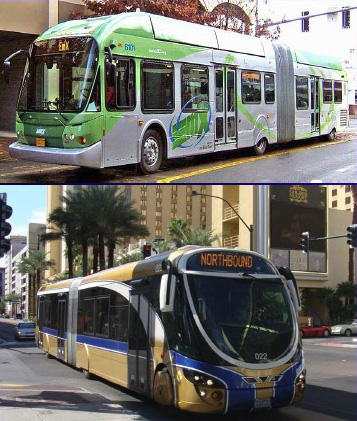 Premium
service
Premium
service- Trolley/Coaster like experience
- Serves:
- Commuters
- Visitors/Tourists
- Residents
- Shoppers
- High frequency
- All day service
- Premium Fares
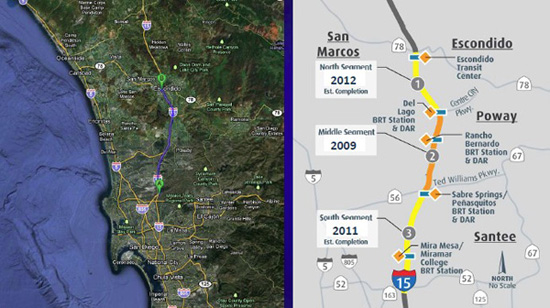
BRT Route and Station Plan
- Expected to start 2013
- 35 mile long corridor
- 5 freeway BRT stations with DARs
- Service includes:
- All-stop, all day trunk
- Peak period limited stop commuter expresses
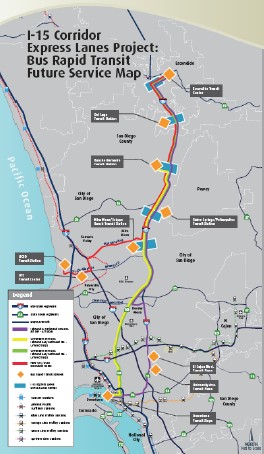
Link to I-15 Corridor Express Lanes Project: Bus Rapid Transit Future Service Map: http://www.keepsandiegomoving.com/Libraries/I15-Corridor-doc/I-15_BRT.sflb.ashx
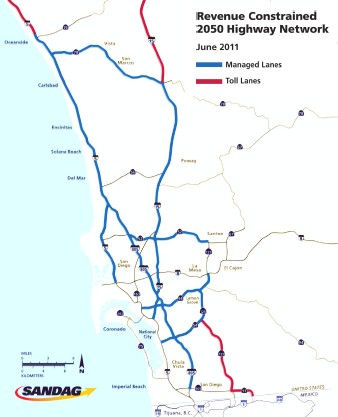
Region's Future
- Expanding the Express Lanes concept:
- Improve mobility, move more people
- Relieve congestion
- Enhance transit service
Annual Funding for Transit
Current = $2 million
2020 = $80 million
2050 = $530 million
(Year of Expenditure $$)
Questions
- I-15 Value Pricing Program:
Chris Burke - Program Manager
(619) 699-1934
cbur@sandag.org
- I-15 Bus Rapid Transit:
Barrow Emerson - Senior Regional Planner
(619) 699-1961
bem@sandag.org


