Patrick DeCorla-Souza, Tolling and Pricing Program
Manager, FHWA
Lee Munnich, Humphrey Institute, University of
Minnesota
Kenneth Buckeye, Minnesota Department of Transportation
John Doan, SRF Consulting
Center for Innovative Finance Support
Federal Highway Administration
Sixteenth Part of a Webinar Series on Overcoming the Challenges
of Congestion Pricing.
Session 16: Managed Lane Access Issues Webinar - Presentations
Audio:
Via computer - No action needed
Via telephone - Mute computer speakers, call 1-866-863-9293, passcode 19772740
Presentations by:
Audience Q&A - addressed after each presentation, please type your questions into the chat area on the right side of the screen
Closed captioning is available at:
http://www.fedrcc.us/Enter.aspx?EventID=2277487&CustomerID=321
Recordings and Materials from Previous Webinars:
https://www.fhwa.dot.gov/ipd/tolling_and_pricing/resources/webinars/congestion_pricing_2011.aspx
Part A: Evaluation of the effect the MnPASS lane design has on mobility and safety
John Hourdos, Minnesota Traffic Observatory, U of Minnesota
Brian Kary, MnDOT
Overview
- Background on MnPASS Access (Brian Kary, MnDOT)
- Project Objectives
- Evaluation of Mobility and Safety of current conditions
- Shockwave length estimation tool
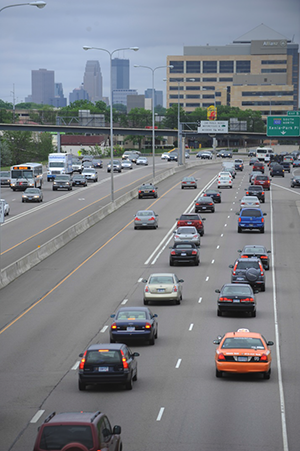
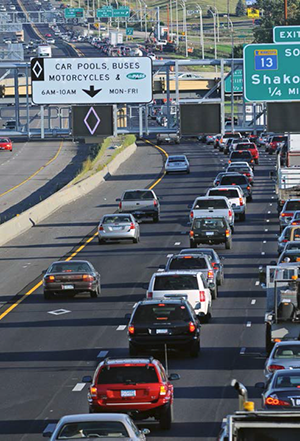
Background on MnPASS Access
I-394
I-35W
Project Objectives
- Evaluate and compare the two design philosophies of Restricted and Open access design in terms of Safety and Mobility.
- Define metrics for assessing mobility and safety
- Test the hypothesis that the open access design of I-35W produces significantly more "near misses" than the restricted access design of I-394.
- Produce a methodology and tools for the best design of access on shared lane HOT facilities.
- Methodology and tool to evaluate hypothetical conditions on Open Access facilities
- Methodology and tool to determine optimal lane changing regions on Restricted Access facilities.
Research Methodology
- Observation!
- Collect video from all open access sections.
- Focus on areas were GP lanes are congested.
- Count all lane changes to/from HOT over time.
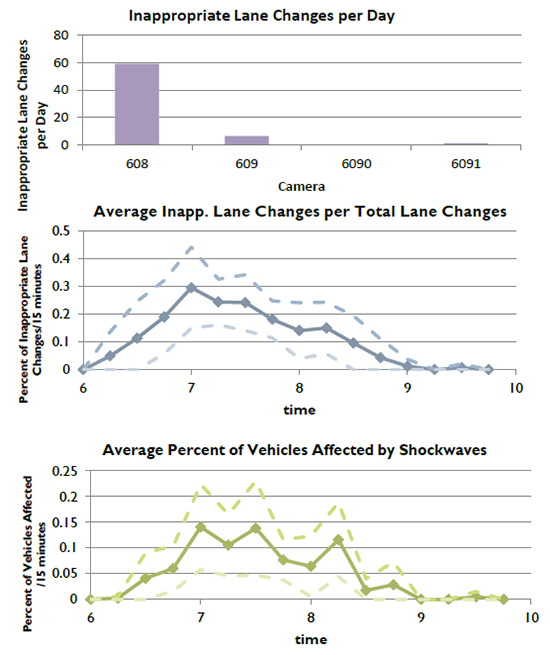
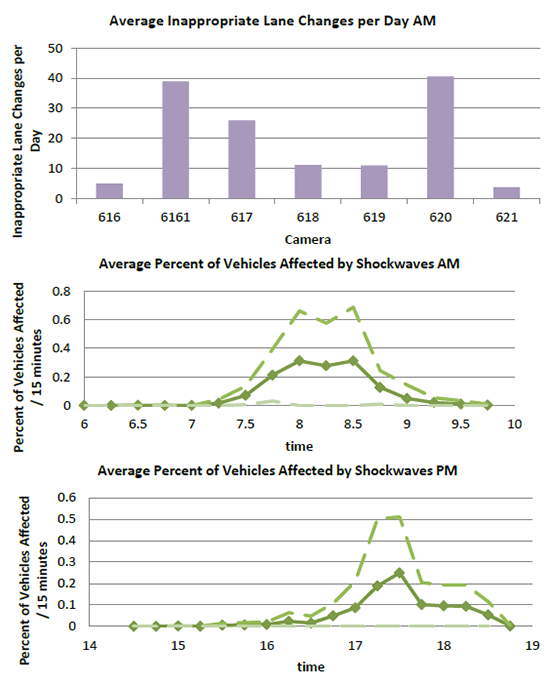
- Identify and measure shockwaves.
- Shockwave frequency used as a surrogate for mobility.
- Shockwave length used as a surrogate for safety.
Examples of Inappropriate Lane Changes
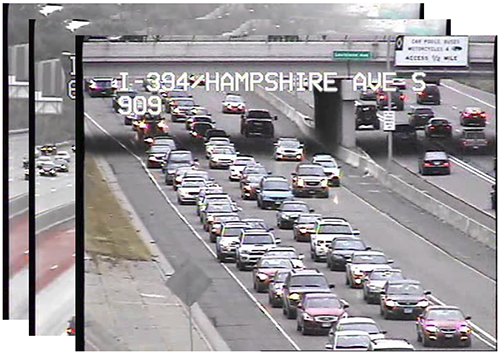
Observation Locations
I-35W

View full sized image
I-394

View full sized image
Zone 1: I-35W between TH-13 and Cliff Road
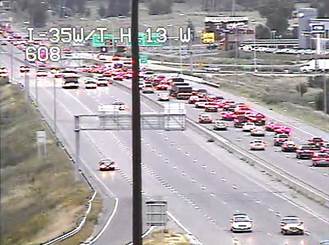
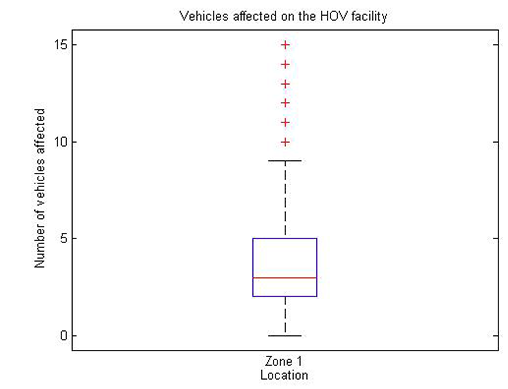
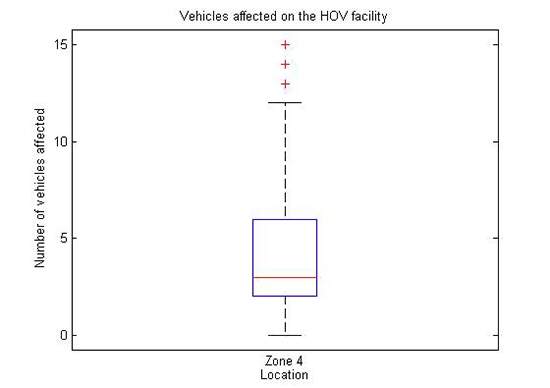
 Zone 4: Northbound Highway 62 to 38th street
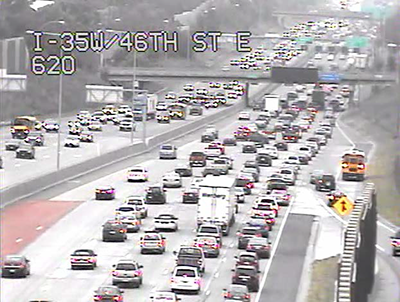
 Observed flow breakdowns on the I-35W HOT
View full-sized image
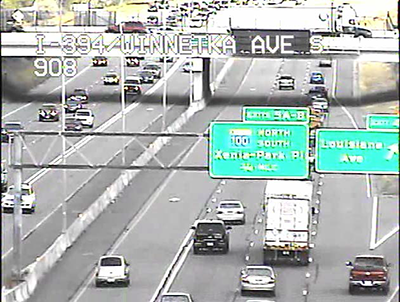
I-394 EB at Louisiana Avenue
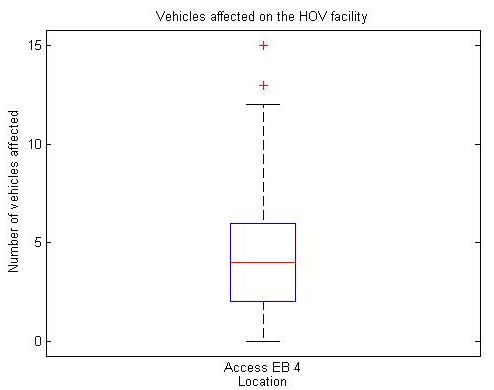
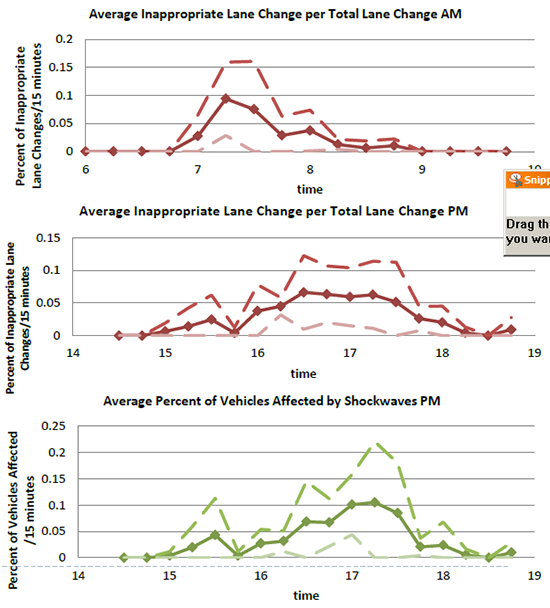
Comparison between facilities on I-394 and I-35W

Restricted Access Design vs. Open Access
- Today each works well on its respective freeway.
- Shockwave activity similar between sites.
- "Gates" attract more lane changes.
- Works well on I-394 since 90% of demand comes from three distinct interchanges.
- Open Access on I-35W shows similar shockwaves
- Interchanges on I-35W are more and more frequent.
- Shockwave activity is concentrating on 2-3 zones.
- In the future MnDOT may have to restrict access in high congestion areas (or raise the price).
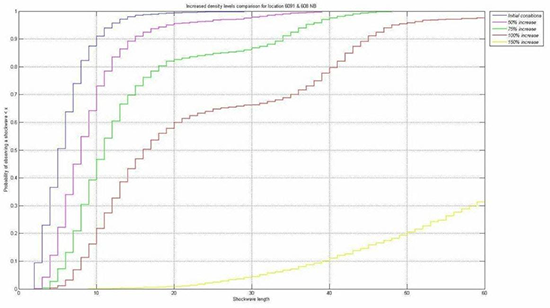
Emulating Shockwave Propagation on MnPASS lanes Under Present and Increased Demand Levels
Segments of interest

View full sized image
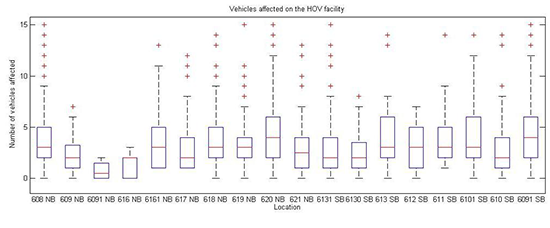
- The locations for which data will be presented correspond to the segments of the HOT lane between:
- TH 13 and Black Dog NB (608 & 6091).
- 86th street and 90th street SB (6130).
- 98th street and 106th street SB (6101).

Methodology
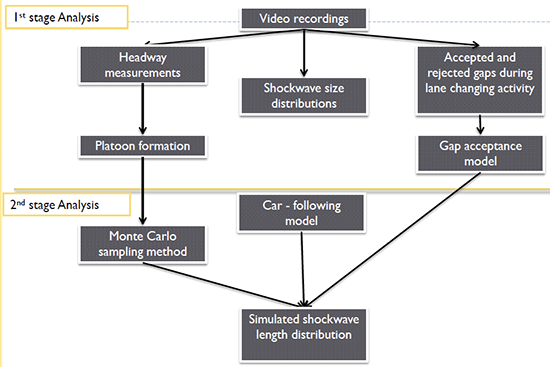
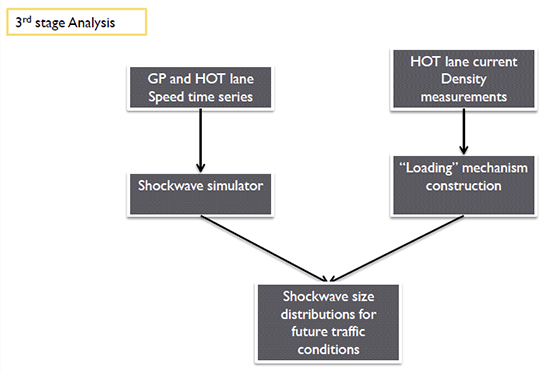
Text of flow chart
- 1st stage Analysis
- Video recordings
- Headway measurements
- Shockwave size distributions
- Accepted and rejected gaps during lane changing activity
- 2nd stage Analysis
- Monte Carlo sampling method
- Car - following model
- Simulated shockwave length distribution
- 3rd stage Analysis
- GP and HOT lane Speed time series
- HOT lane current Density measurements
- "Loading" mechanism construction
- Shockwave size distributions for future traffic conditions
Experiment Description
- A sequence of vehicles is generated given a density time series.
- For the first 5 seconds all vehicles move without any change in speed.
- After selecting a gap, the following vehicle is forced to execute a sampled speed drop followed by an immediate recovery with the given
acceleration.
- After the disturbance is introduced vehicles experience the shockwave based on the rules underlined by the shockwave propagation model.
- Repeat
Validation
TH 13 and Cliff Rd NB
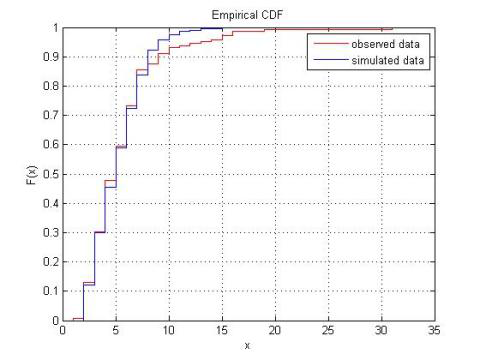
86th St and 90th St SB
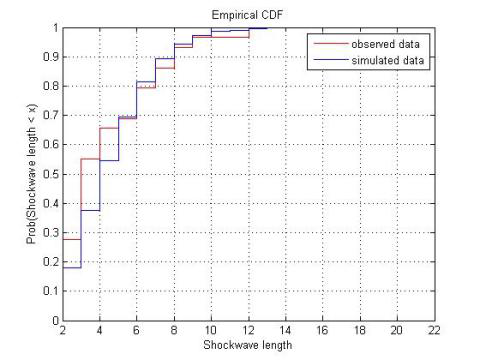
98th St and 106th St SB
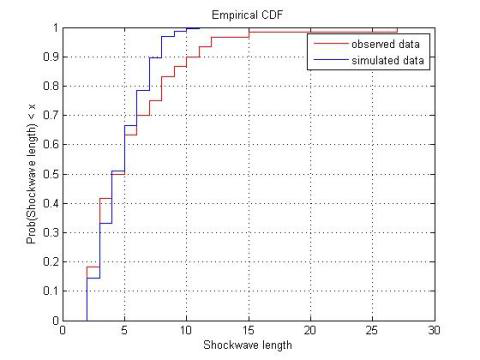
86th St and 90th St SB
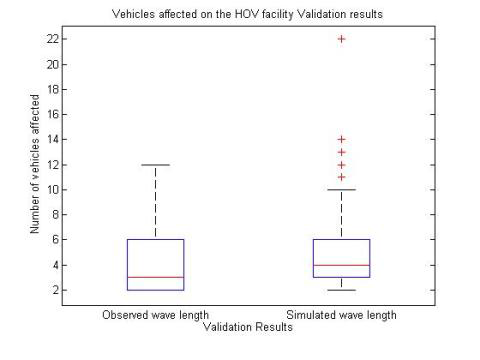
TH13 and Cliff Road Northbound
Density increased by 50%
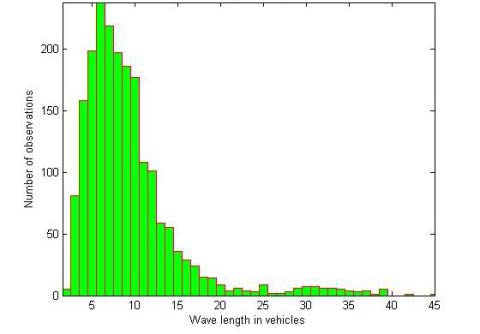
Density increased by 75%
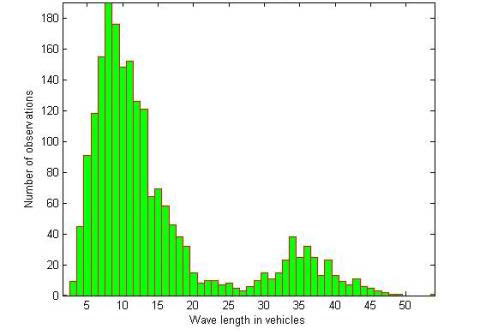
Density increased by 100%
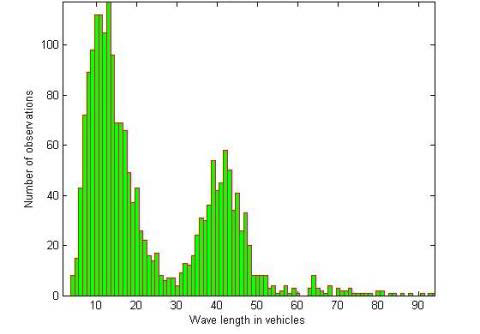
Density increased by 150%
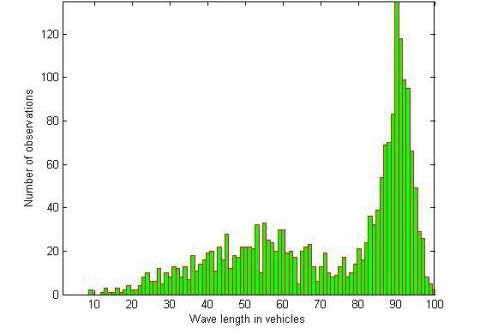
TH13 and Cliff Road Northbound
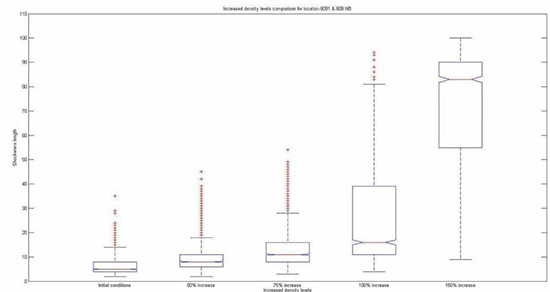
TH13 and Cliff Road Northbound
View full sized image
Questions?
Part B: Silicon Valley Express Lanes - VTA's Approach to Providing Express Lanes Access Points
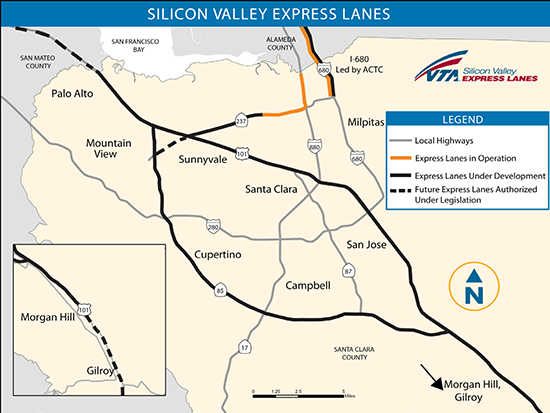
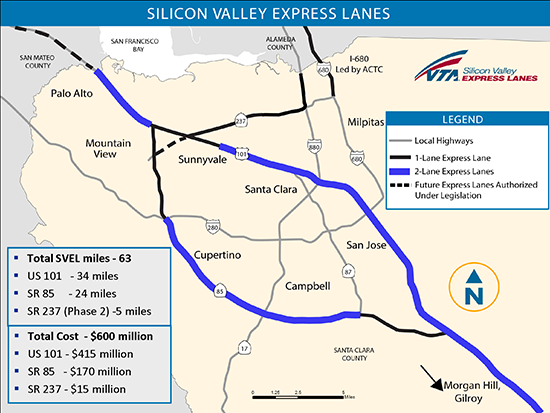
Background
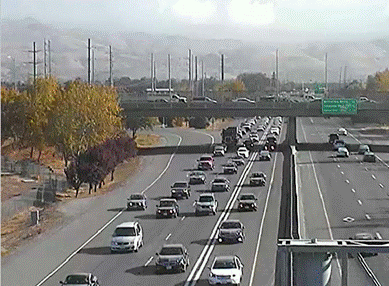
Two access arrangement approach was considered for SR 237 Express Lanes
- MnPass Express Lanes & Southern California HOV
- I-680 Express Lanes
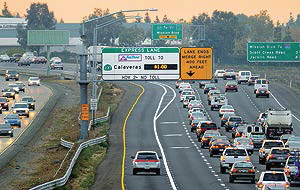
Source: I-680 Express Lanes, Alameda County Transportation Commission, CA
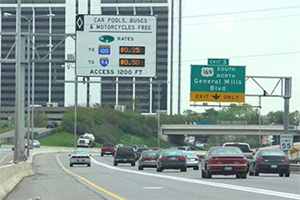
Source: MnPass Express Lanes, MN
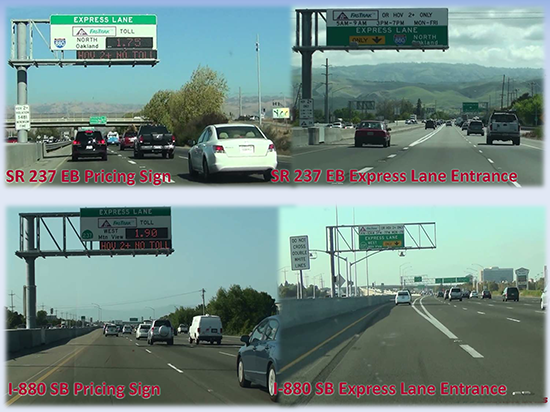
Four Traffic Photos
(top row); SR 237 EB Pricing Sign and SR 237 EB Express Lane Entrance
(second row) I-880 SB Pricing Sign and I-880 SB Express Lane Entrance
Access Types Arrangement
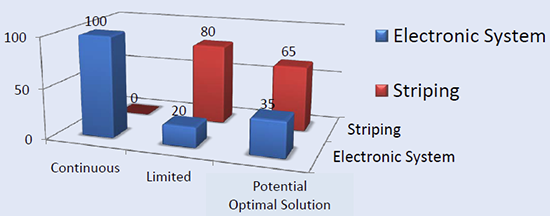
Two types of access arrangement under consideration in the Bay Area
- Limited Access
- Double white lines separating General Purpose Lane (GP) and Express Lane (EL)
- Designated openings for weaving of traffic into/out of EL
- Continuous Access
- Dashed lines separating GP and EL
- Toll using multiple electronic readers with scaled spacing
Limited Access
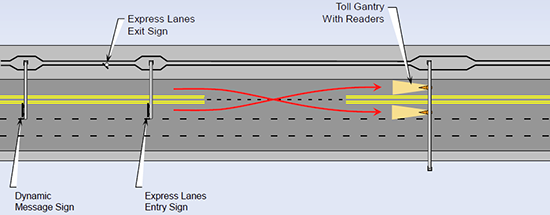
Limited Access Striping
- One lane to utilize unused capacity
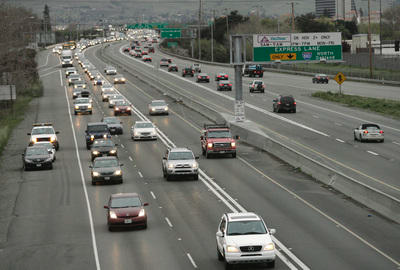
- Two lanes to minimize bottlenecks and increase capacity
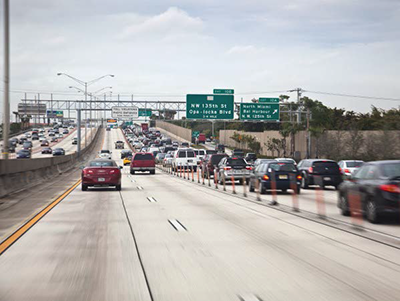
- Source: I-95 Express Lanes, Miami, FL
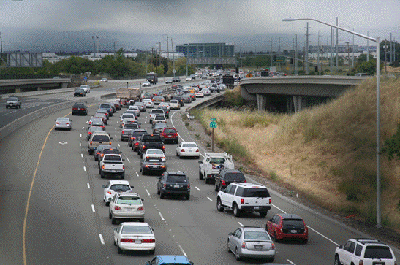
Continuous Access
- Minimal or no change to striping
- Greater amount of electronic toll system equipment throughout Express Lanes facility
VTA Approach to Provide EL Access
Points
- Evaluate location of major bottlenecks in the EL corridor
- Implement double white lines at these locations to ensure smooth traffic flow and travel time reliability
- Provide extended openings to weave (non-bottleneck locations)
VTA Approach to Provide EL Access
Points
- Willingness to extend access point to be as long as possible to allow for smoother weaving
- Adopting access point that could be over one mile
How EL Access Points are Selected?
Prioritize access locations using a hierarchy approach:
- Access to System Interchanges (highway to highway)
- Access to Expressway system (major arterials with overcrossing and underpasses)
- Access to key arterials serving major regional attractors; airports, universities, hospitals, major employers, commerce centers
 Fine Tune Selected Location
Use an iterative approach to fine tune final location:
- Use design standards to identify minimum distance to locate access point
- Verify if there is sufficient geometric width to accommodate access point
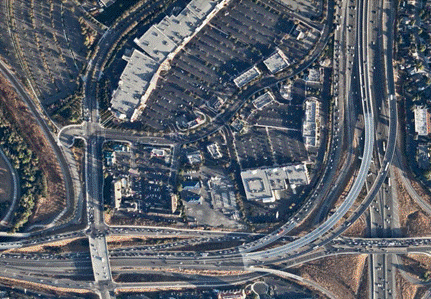
- Ensure access point location is not next to GP lane with traffic queuing (do not create new bottlenecks due to new weaving!)
- Shift access point if necessary until the location is optimal (minimal traffic operation or geometric constraints)
Challenging task in a highly urbanized areas with closely spaced interchanges.
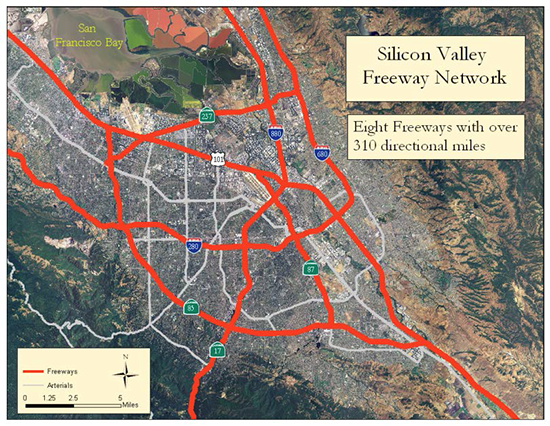
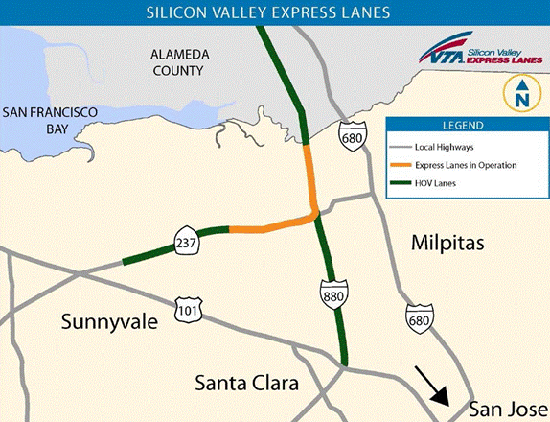
SR 237 Express Lanes
- Key gateway to the golden triangle area with major employers
- Can do congestion pricing in the middle of existing HOV lane corridors
Key Lessons to Share
- Its about identifying and providing travel time reliability at key bottleneck locations
- Double white lines separating GP and EL at these congestion locations help ensure travel time savings can be realized
SR 237 Express Lanes Deliver Travel Time Savings
- If you deliver travel time savings, most other issues become less significant
| Lane Utilization |
AM Peak Period |
PM Peak Period |
| Express Lanes (EL) |
 17% (55%)* 17% (55%)* |
 24% (17%)* 24% (17%)* |
| General Purpose Lanes (GP) |
 6% 6% |
 2% 2% |
| Person Throughput |
|
|
| EL |
 20% (38%)* 20% (38%)* |
 6% (3%)* 6% (3%)* |
| GP |
 10% 10% |
 2% 2% |
| Travel Time Savings |
|
|
| EL vs. GP |
 3 -14 minutes 3 -14 minutes |
 5 - 8 minutes 5 - 8 minutes |
| EL |
 2 - 7 minutes 2 - 7 minutes |
 2 - 4 minutes 2 - 4 minutes |
| GP |
 6 - 8 minutes 6 - 8 minutes |
 6 - 8 minutes 6 - 8 minutes |
* - Indicates peak hour only
SR 237 Express Lanes
Access Design Based on Operational Conditions
Extended EL opening for 3 miles (similar to continuous access)
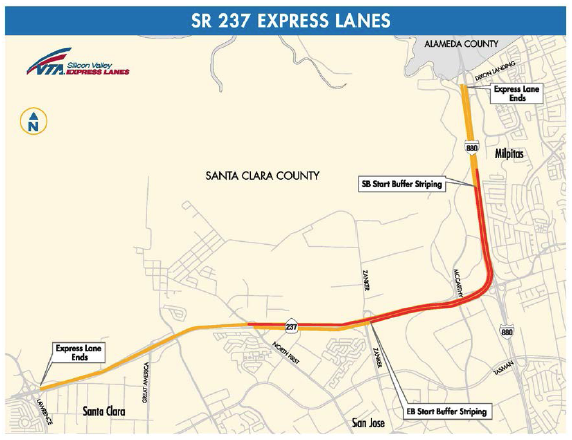
SR 237 Express Lanes (Phase 2)
- $1.6M of FHWA Value Pricing Pilot Program funds to study continuous access for SR 237 Express Lanes (Phase 2)
- Potential to have two types of access arrangements side by side
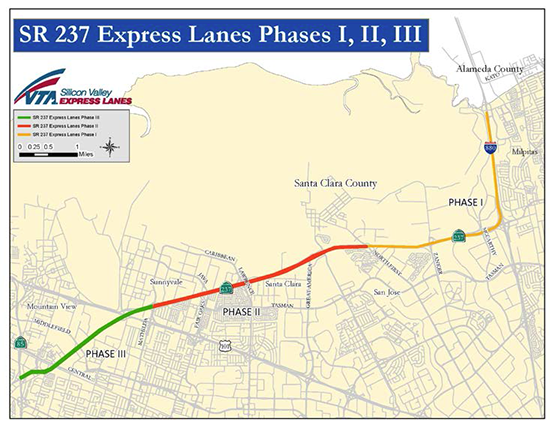 Design Access Points Based on Operational Conditions
Can different access point configurations confuse drivers?
Thank you!

https://www.vta.org/programs/silicon-valley-express-lanes
Part C: SR 167 Express Toll Lanes Continuous Access Demonstration Project
Jennifer Charlebois
Toll Systems Project Engineer
Washington State Department of Transportation
Federal Highway Administration
Managed Lane Access Issues Webinar
December 17, 2013
Washington's HOV system
- 310 lane-mile HOV system
- Right-of-way for regional bus service while providing incentive to vanpool and carpool and avoid congestion
- Fully open (non-designated) access between the HOV lane and the adjacent general purpose lane.
- HOV lanes in the Seattle area are well-used and many fail to meet state and federal performance goals, particularly during peak periods.
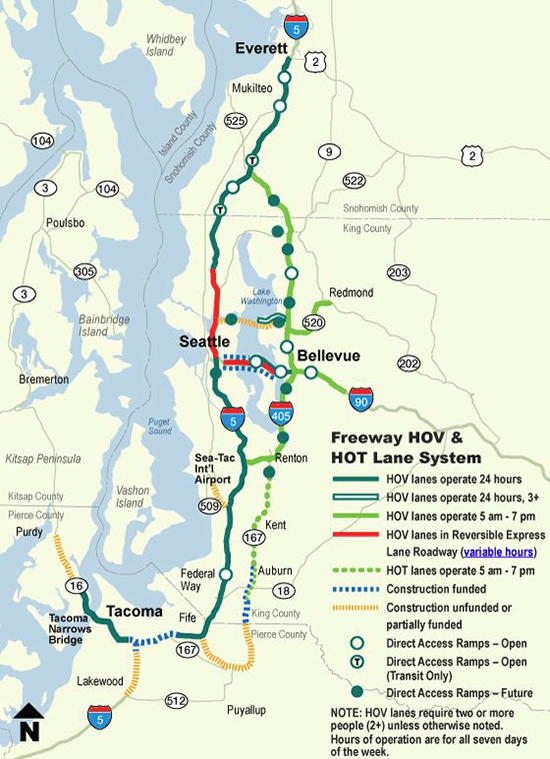
HOV lanes designed to manage demand
Currently experiencing breakdowns
- HOV asset: Over $2 billion has been invested since the 1970s to build out a 300-mile HOV system in Central Puget Sound.
- HOV congestion: Lanes should operate at 45 mph 90 percent of the time during peak periods. Many HOV lanes currently don't meet this performance standard, as the 2+ HOV lanes are over-utilized.
- HOV management: Some HOV lanes are congested, some are underused.
- Congested lanes mean inability to guarantee transit trips: Bus service costs increase and require more coaches when trips are slow or unreliable.
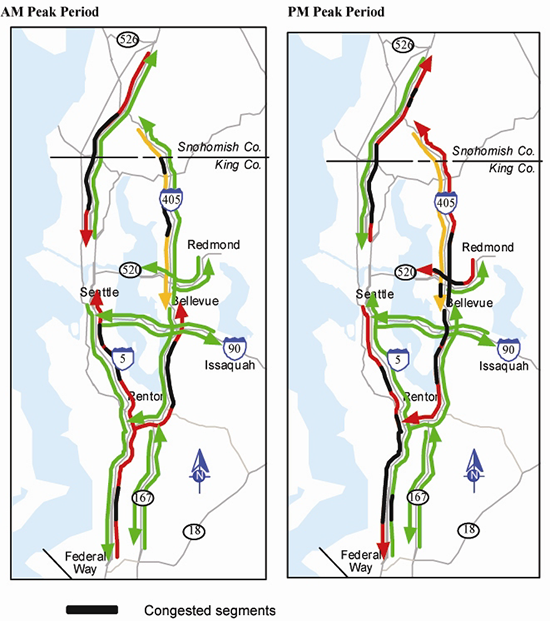
Express toll lanes and HOV policy
-
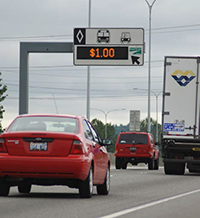 Express toll lanes were originally proposed as a means to achieve HOV speed and reliability standards needed to serve as an effective transit right-of-way and carpooling incentive
- Provides an opportunity to meet HOV objectives, while improving utilization and adding value for other users
- Express toll lanes provide tools to manage both vehicle and person throughput
- Dynamic pricing manages vehicle flow and throughput
- But HOV objectives focus on person-throughput, not just vehicles
- Transit and carpool exemptions provide incentive to fill empty seats to maximize person throughput overall
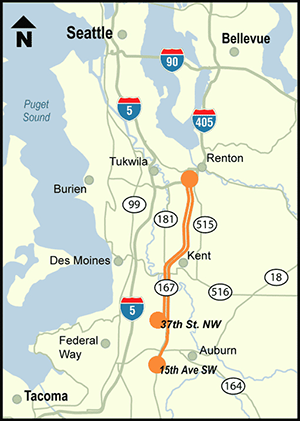 SR 167 express toll lanes
- Opened May 3, 2008
- Use toll rates that adjust automatically according to traffic volumes to keep express toll lane traffic flowing at 45 mph or faster
Why express toll lanes on SR 167?
- Highly congested route
- Underutilized HOV lanes
- Opportunity to pilot express toll lanes in Washington
- Ability to provide drivers a new choice
SR 167 express toll lane current features
- Free to buses, 2+ carpools and motorcycles
- Solo drivers pay a single toll to travel any distance on 10-mile route
- Single express toll lane in each direction
- Designated access - Express toll lane separated from general purpose lanes by double-white line, which is illegal to cross
- Electronic signs indicate the toll rate before each entry point
- 10 access points
- Transponder requirement, no photo enforcement
Pre-express toll lanes:
SR 167 had two general purpose lanes and one HOV lane. 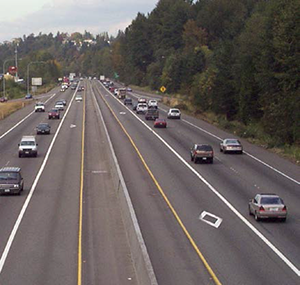
Post express toll lanes:
HOV lanes were converted to a single express toll lane in each direction.
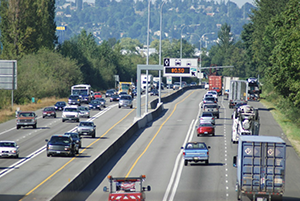
Why continuous access on SR 167 express toll lanes?
- Designated access on SR167 has proven to be one of the most controversial elements of the pilot project.
- In the 2012 survey of SR167 users, 40 percent of the responders were unsatisfied with the current access restrictions.
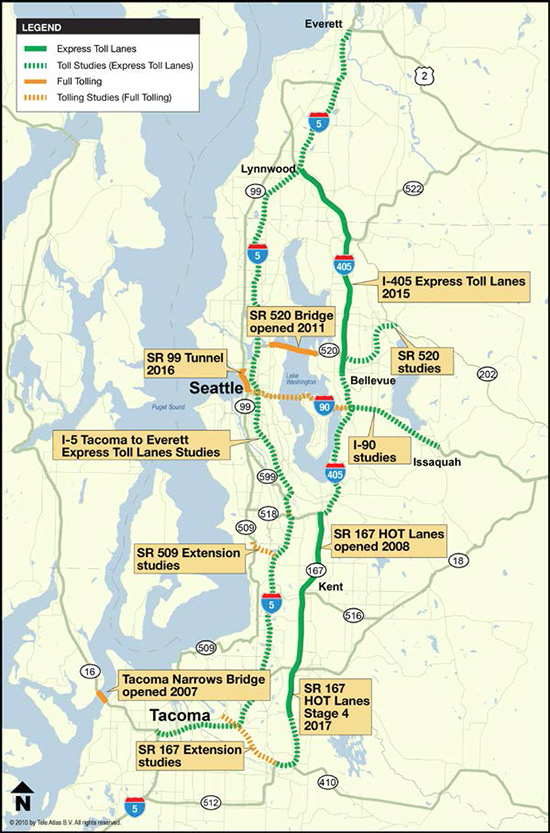
- Designated access will be difficult or impossible to implement on some planned express toll lane systems, such as on I-5 and I-90, due to right-of-way constraints.

Text of quotes:
"Our members have indicated that the number one complaint they have received for the SR 167 HOT Lane Pilot Program is the access control restrictions." - PSRC
"We have seen already that dedicated access points can make it difficult for transit to use if not located appropriately...a continuous access treatment would remove this uncertainty for transit." - Sound Transit
"Too many drivers violating the double white line crossing restrictions without any apparent penalties. Creates a real safety hazard." - survey respondent
SR167 near-continuous access demonstration project
- 2012 - Applied for and received a Federal Value Pricing Program (VPP) grant to demonstrate more-open access on the SR167 corridor.
Project Goals
- Validate the revenue and toll evasion effects of more open access to express toll lanes
- Understand customer responses, attitudes and concerns about near-continuous access treatments in a tolled system, including the ability to communicate a dynamic toll point that is not displayed at the exact point of entry
- Prove (or disprove) the feasibility of potential innovative express toll lane treatments that will require more continuous access
Project Elements
- Public information and outreach
- Restriping and related facility changes
- Before and after evaluation
Project element #1 - Public information and outreach
- Heavy earned media campaign to raise awareness about the changes coming to the corridor as well as direct outreach to our existing Good To Go! customers.

KEY MESSAGING:
- In response to driver feedback, we are making it easier to enter and exit the SR 167 HOT lanes. Drivers will be able to enter and exit the HOT lane at any point.
- SR 167 HOT lane drivers will see the single white line separating the HOT lane from the general purpose lanes (just like in the Region's HOV lanes) that will let them know that drivers can enter and exit the lane anytime it is safe to change lanes.
- We've learned a lot from the SR 167 HOT Lanes Pilot Project the past five years and this is our latest effort to improve the HOT lane experience. We want to learn more about how continuous or open access to the HOT lane affects HOT lane usage, toll revenue and safety.
- This project will help inform WSDOT and the Legislature as we plan and develop the next evolution of express toll and HOT lanes in our state.
Project element #2 - Restriping and related facility changes
- Accomplished via a design-bid-build project
- Project duration expected to be about two weeks
Work Activities
- Grinding second gore stripe to create one continuous solid stripe separating the express toll and general purpose lanes.


Project element #2 - Restriping and related facility changes
Work Activities
- Signing removals and changes
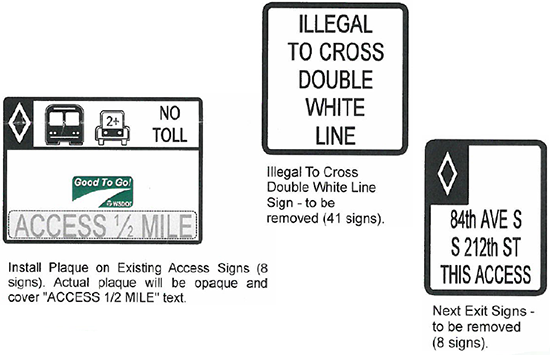
- Install Plaque on Existing Access Signs (8 signs). Actual plaque will be opaque and cover "ACCESS 1/2 MILE" text.
- Illegal to Cross Double White Line Sign - to be removed (41 signs).
- Next Exit Signs - to be removed (8 signs).
"Near" Continuous Access
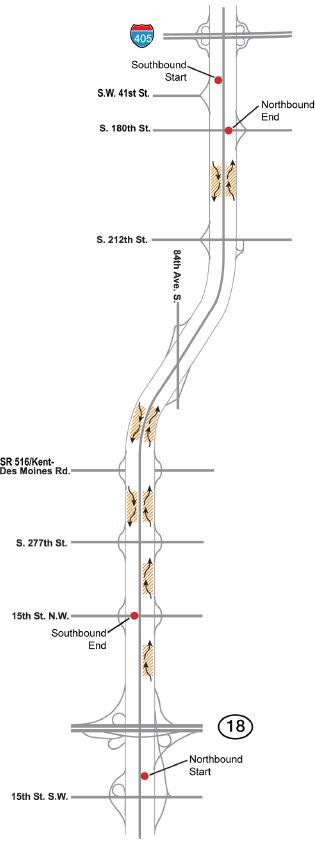
- The majority of the corridor will be striped to allow fully open access.
- WSDOT did evaluate the need for restricted access in select locations including:
- Areas with heavy weaving
- Ends of the system in each direction
- No close-out transponder readers
Project Elements #3 - Before and After Evaluation
- WSDOT will contract with the Washington State Transportation Center (TRAC) at the University of Washington to conduct a thorough before and after evaluation.
- Data will be collected and analyzed for a period of six months prior to the operational change and compared against the same six months of data from the following year. 13
- The evaluation will focus on evaluating the operations of the express toll lane system in the areas of:
- safety
- revenue collections
- toll evasion
- reliability and speed of the express toll facility
- reliability and speed of the general purpose lanes
- customer attitudes
- transit operations
What's next?
Next steps
- Advertised to bidders in early 2014
- Operational change will occur in summer 2014
- Data collection complete in mid-2015
- Report publication in fall 2015
Looking toward the future
- This project will help inform WSDOT as we plan and develop the next evolution of express toll lanes in our state.
- Continuous access would allow express toll lanes on Puget Sound roadways where roadway width is restricted - no width for a two- to four- foot buffer
- Future project elements could include a dynamic second lane assignment
Questions?
For more information, please contact:
Jennifer Charlebois
Toll Systems Project Engineer
206-716-1106 or charlej@wsdot.wa.gov


 Zone 4: Northbound Highway 62 to 38th street

 Observed flow breakdowns on the I-35W HOT


![]()


 17% (55%)*
  24% (17%)*
  6%
6%  2%
2%  20% (38%)*
  6% (3%)*
  10%
10%  2%
2%  3 -14 minutes
  5 - 8 minutes
  2 - 7 minutes
  2 - 4 minutes
  6 - 8 minutes
  6 - 8 minutes
 Design Access Points Based on Operational Conditions


 Express toll lanes were originally proposed as a means to achieve HOV speed and reliability standards needed to serve as an effective transit right-of-way and carpooling incentive
 SR 167 express toll lanes


