Understand Value Capture Tools and Federal Resources
https://collaboration.fhwa.dot.gov/dot/fhwa/WC/SitePages/Register.aspx?WCID=2027
June 20, 2019
1:00 pm - 2:30 pm ET
Value Capture: Developer Contributions Techniques and Case Studies https://collaboration.fhwa.dot.gov/dot/fhwa/WC/SitePages/Register.aspx?WCID=2036
June 27, 2019
1:00 pm - 2:30 pm ET
Value Capture: Capital Improvement Plan https://collaboration.fhwa.dot.gov/dot/fhwa/WC/SitePages/Register.aspx?WCID=2037
July 18, 2019
1:00 pm - 2:30 pm ET
Value Capture: Special Assessment Techniques and Case Studies https://collaboration.fhwa.dot.gov/dot/fhwa/WC/SitePages/Register.aspx?WCID=2038
July 24, 2019
1:00 pm - 2:30 pm ET
Value Capture: Incremental Growth Techniques and Case Studies https://collaboration.fhwa.dot.gov/dot/fhwa/WC/SitePages/Register.aspx?WCID=2039
Aug. 22, 2019
1:00 pm - 2:30 pm ET
Value Capture: Joint Development, Use ROW Agreement, and Case
Studies https://collaboration.fhwa.dot.gov/dot/fhwa/WC/SitePages/Register.aspx?WCID=2040
Sept. 19, 2019
1:00 pm - 2:30 pm ET
Value Capture: Capture Value from Existing Assets to Fund
Previously Unfunded
Infrastructure Projects and Case Studies https://collaboration.fhwa.dot.gov/dot/fhwa/WC/SitePages/Register.aspx?WCID=2041
Oct. 24, 2019
1:00 pm - 2:30 pm ET
Value Capture: Advertising, Naming Rights, and Case Studies https://collaboration.fhwa.dot.gov/dot/fhwa/WC/SitePages/Register.aspx?WCID=2042
Nov. 21, 2019
1:00 pm - 2:30 pm ET
Presentation 1 -
Value Capture: Developer Contributions
One-time charges collected by local governments from developers to offset the cost of infrastructure and services necessitated by new development.
An additional fee or tax assessed on businesses or residents in specified geographic areas benefiting proximity to a highway or other transportation facility or corridor.
Similar to a utility fee, transportation fees are assessed based on how individual businesses and households use transportation facilities.
A mechanism allocating back to infrastructure from some specified portion of increased property tax revenues fostered by new infrastructure - often for a specified period of time.
Sale or lease of land or air rights on or adjacent to transportation facilities. This can include donations of land or other in-kind resources from the private sector in ongoing commercial operations.
Sale or lease of government owned assets - such as toll roads or bridges - to private-sector investors/operators.
Sale of advertising space or naming rights on a transportation facility. Note: Commercial uses within Interstate Highway System right of way, including rest areas, is prohibited by law; however, they may be allowed on toll facilities and in transit stations.
Value Capture Techniques
Category
Technique
Purpose
Fund or Finance
Developer Contributions
Impact fees
Capital Expenses
Fund
Negotiated Exactions
Capital Expenses
Fund
Special Assessments
Special Assessment Districts
Capital Expenses
Fund or Finance
Business Improvement Districts
Capital or Maintenance
Fund or Finance
Sales Tax Districts
Capital or Maintenance
Fund or Finance
Land Value Taxes
Capital or Maintenance
Fund or Finance
Fees
Transportation Utility Fees
Operations and Maintenance
Fund
Incremental Growth
Tax Incremental Finance
Capital Expenses
Fund or Finance
Transportation Reinvestment Zones
Fund or Finance
Tax Allocation District
Fund or Finance
Joint Development
At Grade
Capital Expenses
Fund or Finance
Below Grade
Capital Expenses
Fund or Finance
Above Grade (Air Rights)
Capital Expenses
Fund or Finance
Concessions
Asset Recycling
Capital Expenses
Fund or Finance
Advertising & Naming Rights
Advertising
Capital or Maintenance
Fund
Naming Rights
Capital or Maintenance
Fund
Introduction to Developer Contributions
Developer Contribution Overview
Development Exactions & Impact Fees Overview
Key Distinction: Fee vs. Tax
Why is the need for Developer Contributions
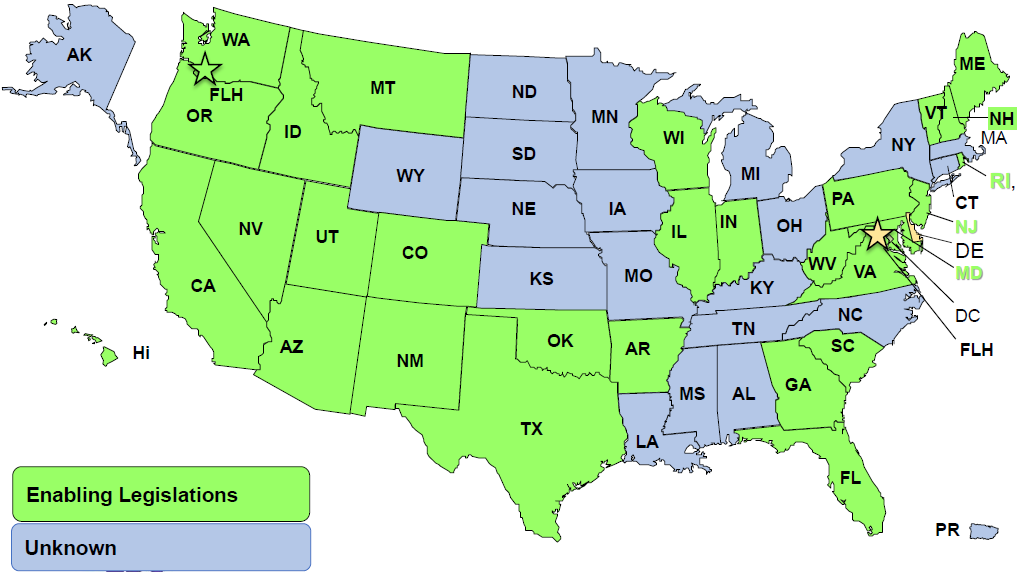
Legal Environment
Establish Transportation Impact Fees
Accounting & Administration
Q&A
Developer Contributions
Form of fees or payments or the provision of the improvements
Require "nexus" or a reasonable relationship established
between the development & payment
May be negotiated or voluntary basis
Types of Developer Contributions
Negotiated Exactions
Development Impact Fees
Negotiated Exactions (Agreements)
A requirement imposed on an ad hoc basis during the processing
of a discretionary land use application as a condition of approval
of the application
Can take many forms including:
A conveyance or dedication of property for public purpose
A requirement to construct public improvements such as a new
traffic signal, or
A requirement to pay money to finance acquisition or construction
of public facilities
No voting requirements
Impact Fee By Any Other Name ....
Impact Fees
Development Impact Fees
System Development Fees
System Development Charges
Traffic Impact Fees
Transportation Impact Fees
Road Impact Fees
Capital Facility Charges
Mobility Fees
Impact Fees Overview
Impact Fees
One time upfront fee to fund capital improvements necessitated
by new commercial and residential development
No voting requirements
Meet the "Rational Nexus"
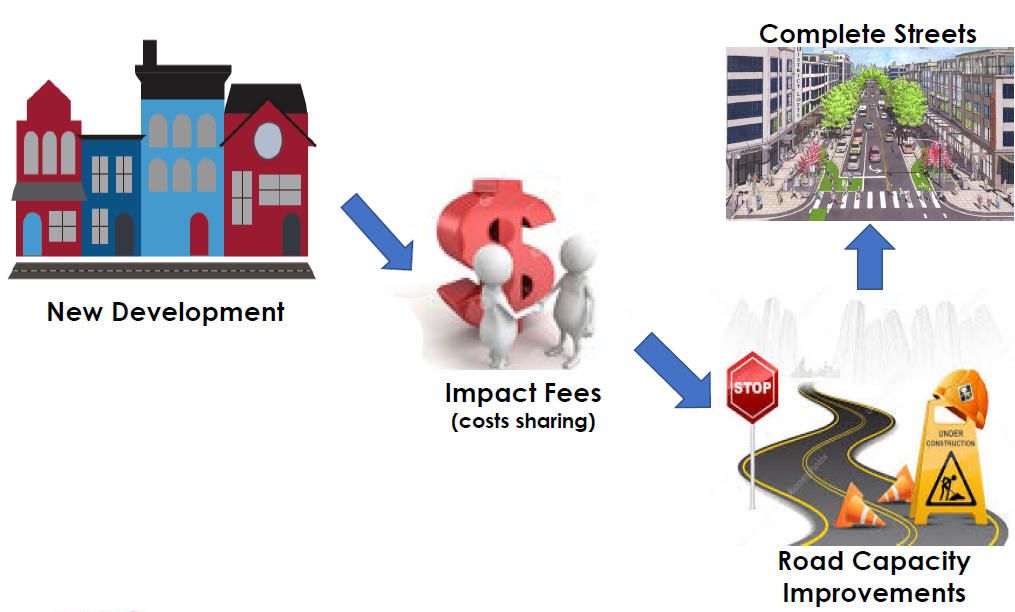
Complete Streets
Fee vs. Tax
Taxes
Primarily revenue-raising
Authority must be express
Proportionality not required
Impact Fees
Land use regulations that mitigate off-site impacts - POLICE POWER
Authority may be implied
"Reasonableness" required
Strict accounting procedures
Benefits of Impact Fees
Ensure new development is paying its own way (growth paying
for growth).
Alleviates burden of new facilities on existing tax base
Beneficial to smaller or rapidly growing communities to finance
the infrastructure needed to support additional population, employment,
and development in a community
Help to manage growth in developing communities as well as in
older revitalizing communities
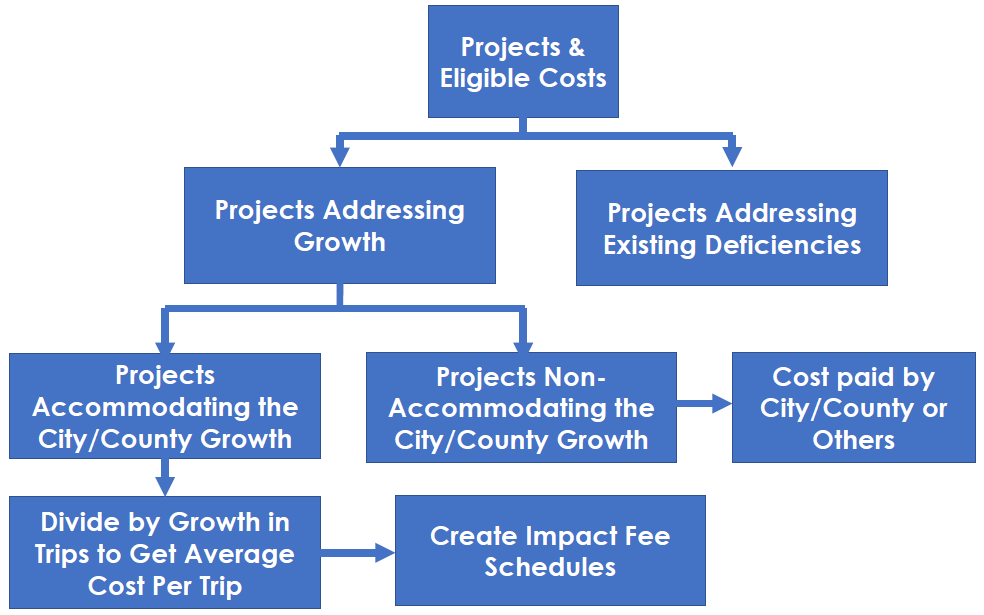
Divide by Growth in Trips to Get Average Cost Per Trip
Create Impact Fee Schedules
Projects Non-Accommodating the City/County Growth
Cost paid by City/County or Others
Projects Addressing Existing Deficiencies
Evaluate Need for Credits
Site specific
Developer constructs a capital facility included in fee
calculations
Debt service
Avoid double payment due to existing or future bonds
Dedicated revenues
Local option sales tax, gas tax
State and Federal Grants for Capacity
Some grey areas:
Dedicated sources that can be used for either rehabilitation
or capacity expansion
Non-dedicated funding historically used for capacity improvements
Model Development Impact Fee Ordinance
A development impact fee ordinance enacts the rules and requirements
formally adopted by local government for establishing and updating
the development impact fee system
Highlights:
Supporting Documentation
Jurisdiction (Service Zones)
Application & Exemptions
Determination of Fees
Credits & Reimbursements
Appeal Process
Refunds
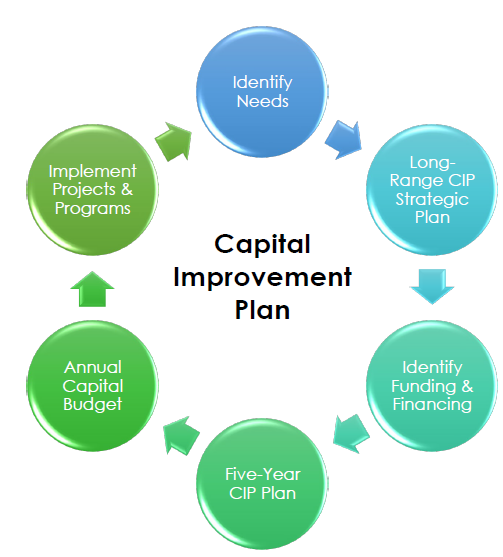
Summary of Impact Fee General Process
Establish transportation/roadway impact fee service area &
10-year (or 25-year) new growth projection
Establish Service Unit for impact fee calculations
Roadway capacity plan, evaluate the existing roadway network
capacity
Develop fee structure & evaluate need for credits
Develop policy & ordinance
Public participation (Liaison committee)
Decisions by elected officials(Percentage of maximum supportable
fee)
Adopt Transportation Impact Fee Ordinance
Accounting & Administration of Transportation Impact Fees
Accounting of Impact Fees
Impact fees generally must be paid before construction begins
(prior to issuance of building permit)
Money earmarked and retained in special interest- bearing accounts
Subject to the GASB Statement 33, Accounting and Financial Reporting
for Nonexchange Transactions
Deadline for Expending Impact Fees (vary from 5-10 years)
Refund the impact fees, plus earned interest, to the developer
if fund not spend within the deadline
Expenditure should be made only for the category of system improvements
within the service area for which the development impact fee was
assessed and collected
May retain a portion of the Impact Fees to pay the County's
costs of collection and administration relating to the Impact Fees
Must be periodically evaluated and updated to reflect recent
data and cost factors
Provide an annual financial report reflecting the collection
and expenditures of the transportation Impact Fees during the previous
year
Comprehensive review & update every 5 years
Issues/Challenges
General opposition to fee increases
Revenues are economically driven
Does not provide for a stable stream of revenue
Fee schedule is proportional to the development's impact
Require Impact Fees Study
Educate users regarding the costs and benefits
Every jurisdiction is different
Securing political support
Myths about Impact Fees
Add to the cost of housing
The market sets the price
Make the city less competitive
Better infrastructure tends to attract development
Unfair and difficult to navigate
Impact fees level the playing field (new growth pays its equitable
share)
Meet the Rational Nexus Test: Need, Benefit, & Fair Share
(proportionality)
Abuse System
State Legislation & Ordinance clearly define exemption, efficient
process, and accountability
Select Project Examples
San Joaquin Hills Transportation Corridors
I-5 Fern Valley Interchange, Phoenix, Oregon
Osceola County Roadway and Bridge Bundling Program
Poplar Road Safety Improvements (phase I), Stafford County,
Virginia
Thay Bishop, FHWA Office of Innovative Program Delivery
Stefan Natzke, FHWA Office of Planning, Environment, and Realty
Members
Jennifer Ahlin, Virginia Department of Transportation
Janine Ashe, FHWA District of Columbia Division
David Cohen, FHWA Office of Project Development & Env. Review
John Duel, FHWA Office of Planning, Environment, and Realty
Kathleen Hulbert, FHWA Infrastructure Office
Chip Millard, FHWA Freight Management & Operation
Diane Mobley, FHWA Chief Counsel Office
Kevin Moody, FHWA Resource Center
Ben Orsbon, South Dakota Department of Transportation
Jill Stark, FHWA Office of Planning, Environment, and Realty
Lindsey Svendsen, FHWA Office of Planning, Environment, and
Realty
Jim Thorne, FHWA Office of Planning, Environment, and Realty
Bingxin Yu, FHWA Transportation Policy Studies
VCIT Focus Areas
Communication - Developing the tools to help
FHWA staff and others promote Value Capture to local public agencies
(Value Capture Implementation Manual)
Technical Assistance - Providing technical
assistance to agencies interested in pursuing Value Capture (Peer
Program)
Clearing House (website)
- Identification of best practices and lessons learned and promoting
further discussion on innovative funding options for local public
agencies, lessons learned from past and current efforts, etc.
Value Capture Webinar | June 27, 2019
Austin Transportation Department
Overview
Impact Fees in Texas
Why Street Impact Fees?
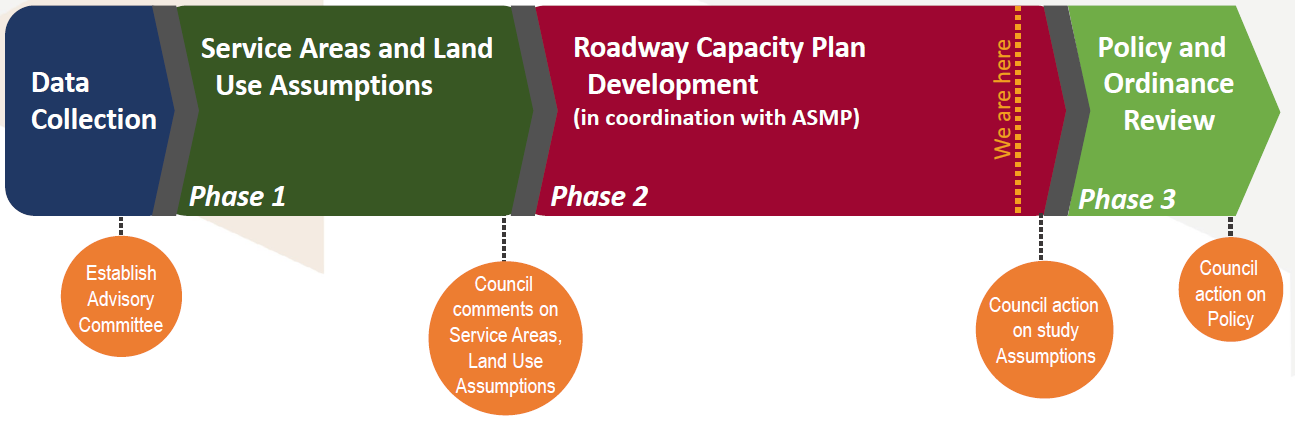
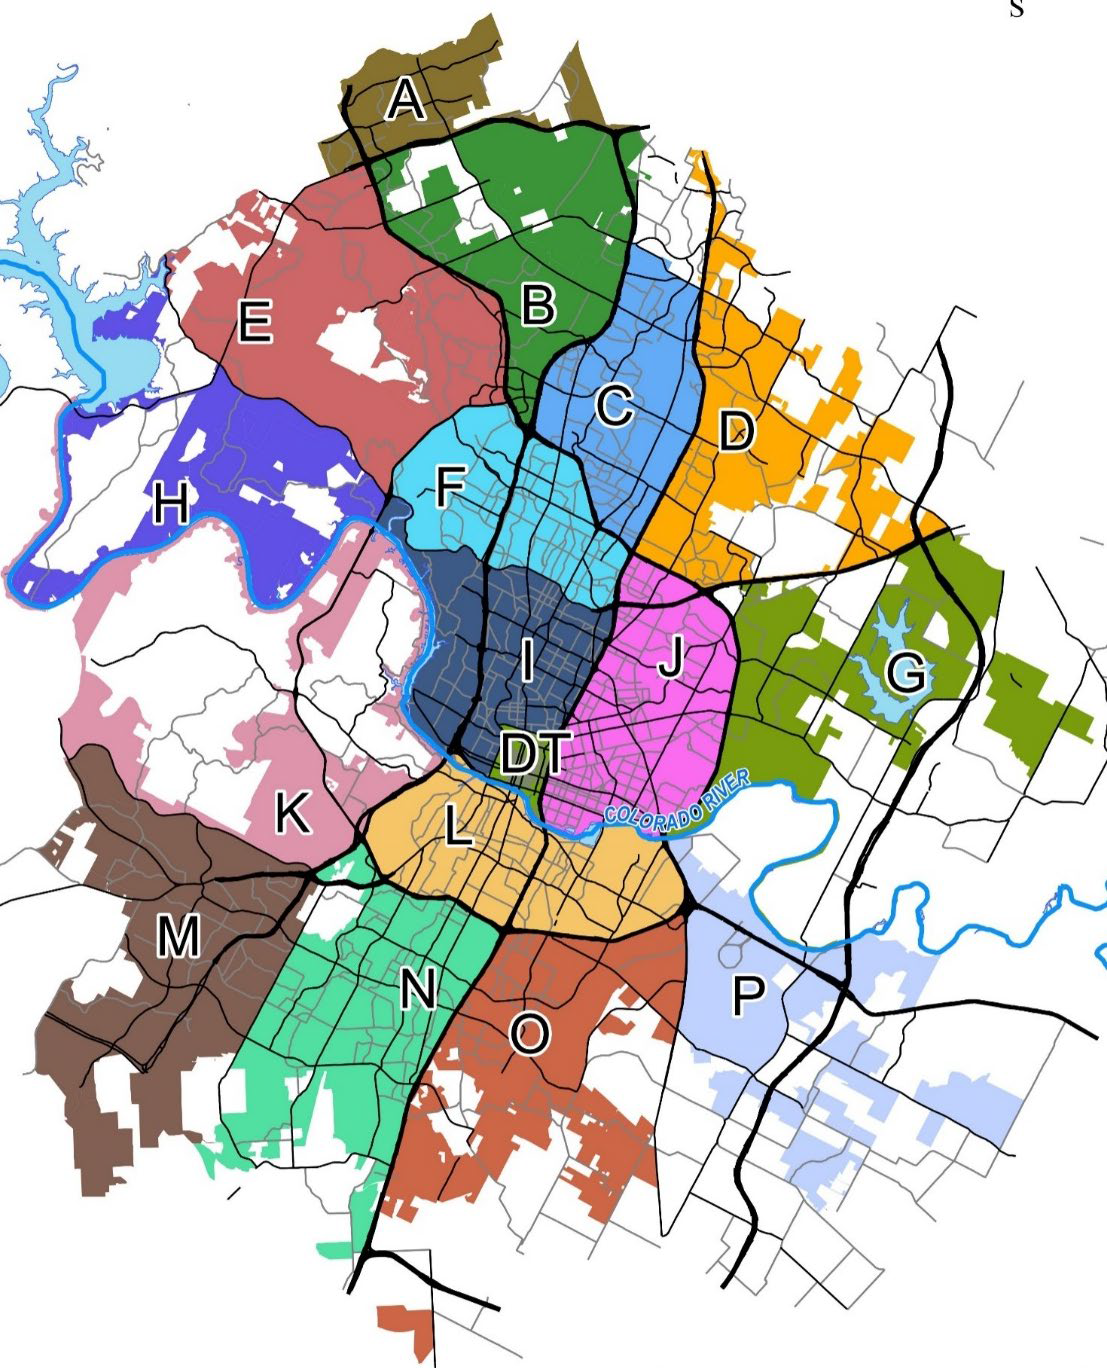
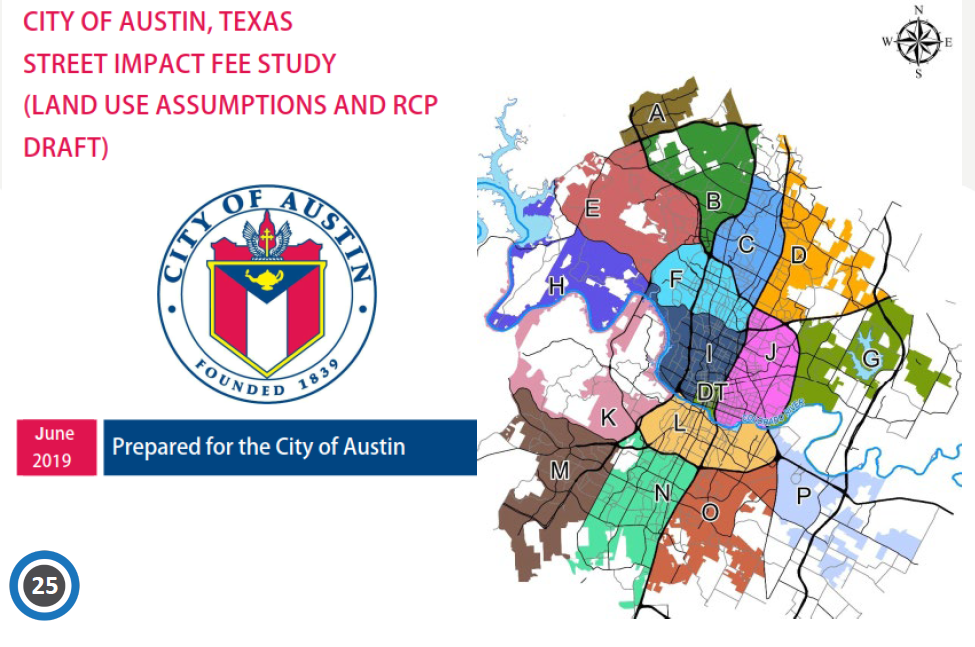
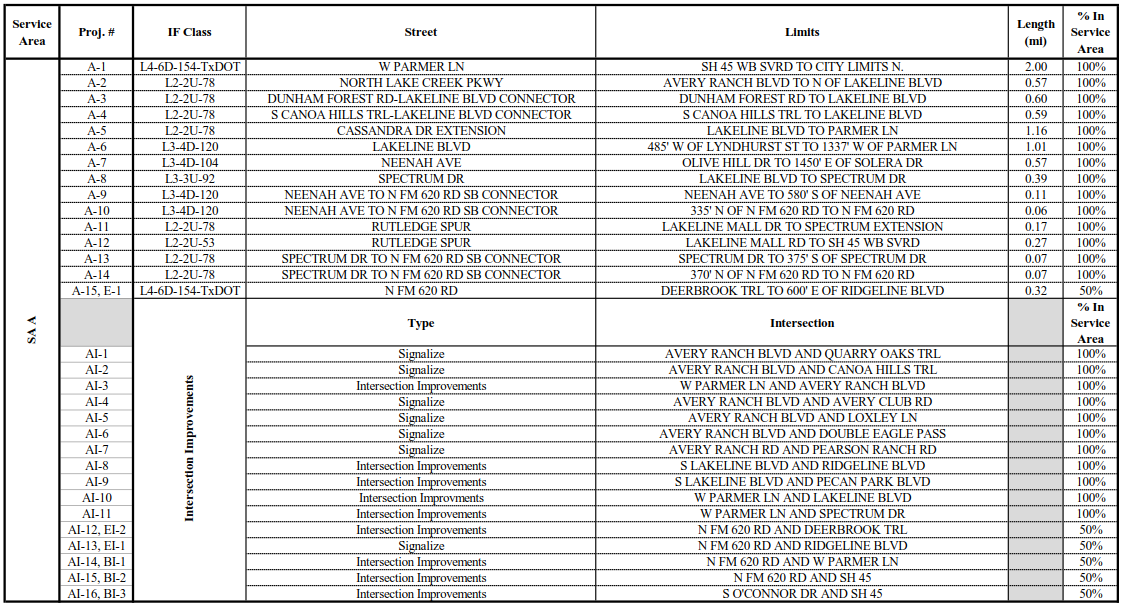
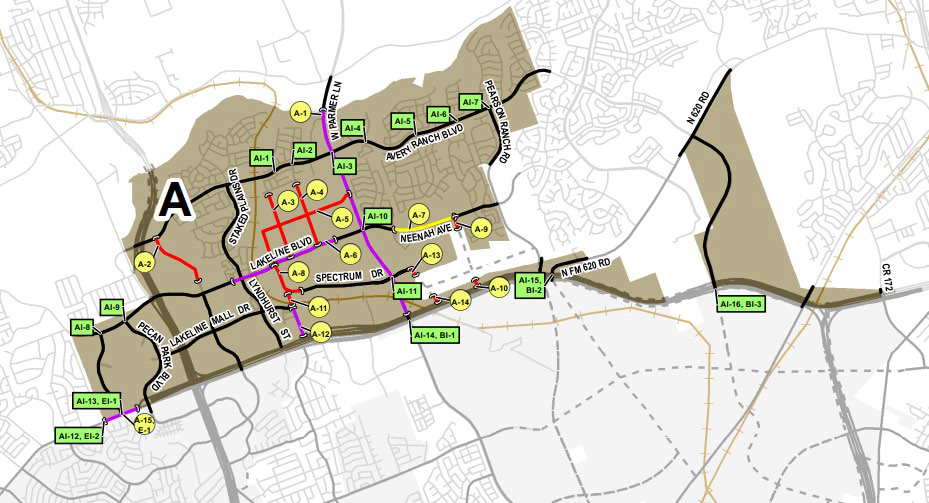
Study Overview
Service Areas and Land Use Assumptions
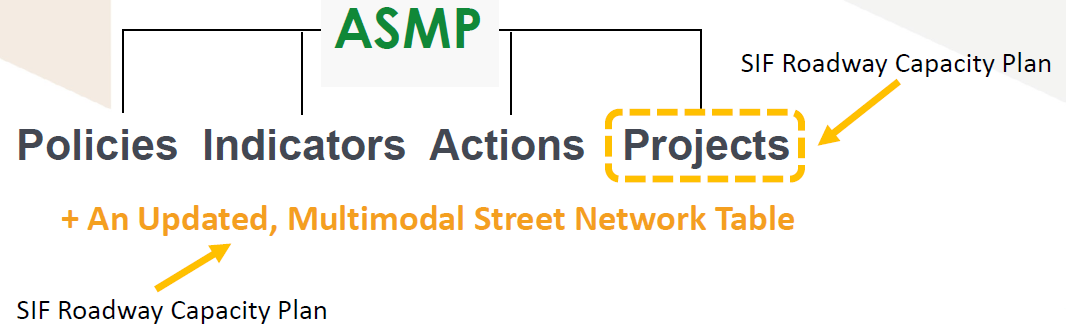
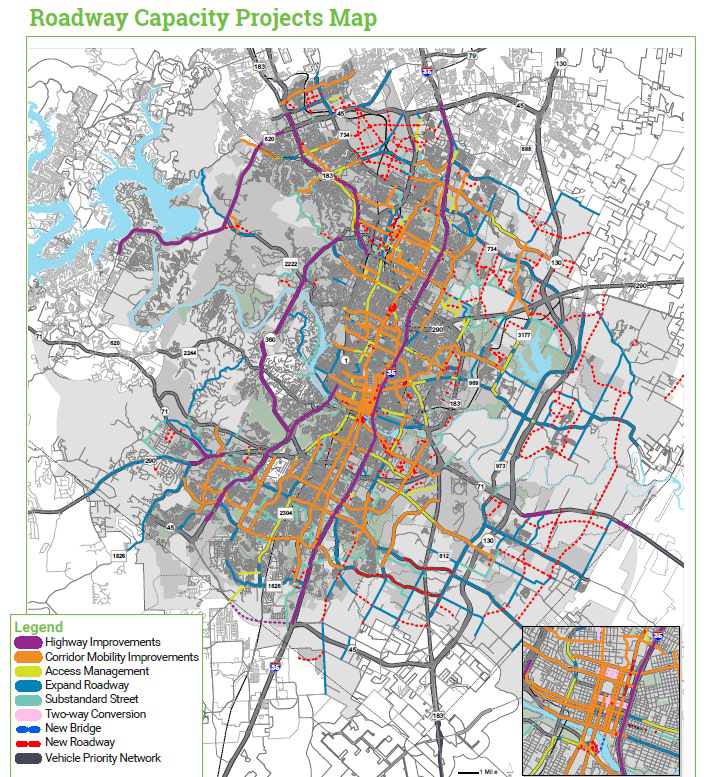
Roadway Capacity Plan
Fee Calculation
Policy Development
Next Steps
Questions
Texas Local Government Code Chapter 395
"Impact fee" means a charge or assessment imposed
by a political subdivision against new development in order to generate
revenue for funding or recouping the costs of capital improvements
or facility expansions necessitated by and attributable to the new
development.
Water, Wastewater, Stormwater, Roadways
Project Purpose: Why Street Impact Fees?
Council direction to conduct impact fee study
Determining a method for growth to pay for growth that is:
Equitable
Predictable
Transparent
Ultimate purpose is to develop a fair and reasonable fee that
development should pay for auto capacity improvements
What do Impact Fees do?
Impact Fees encourage a system that:
Funds transportation improvements: Continues
to fund transportation improvements through the development
process
Is fair among future developments: Fee
is consistent and independent of when developers build (first
or last)
Encourages building infrastructure: Allows
flexibility to require infrastructure to be built up front
Is equitable in that all new development can contribute:
All developments can contribute relative to their impact regardless
of meeting a TIA threshold
What are Street Impact Fees?
One-time fee for New Development
Calculation to determine the cost of growth for street infrastructure
How do we calculate the "cost of growth for street infrastructure"?
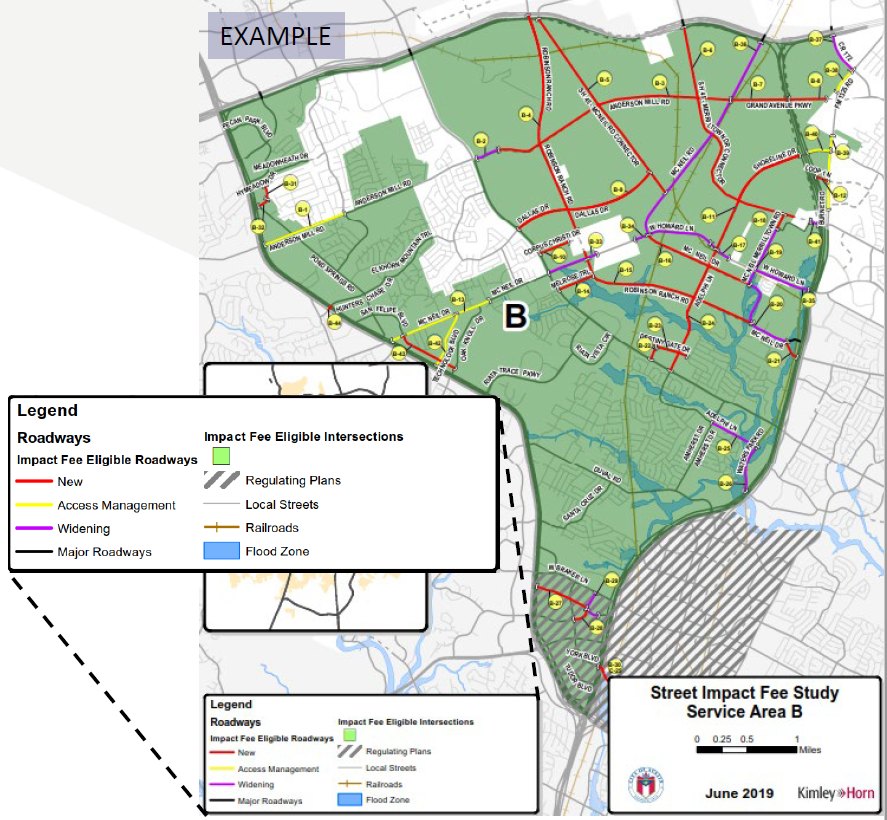
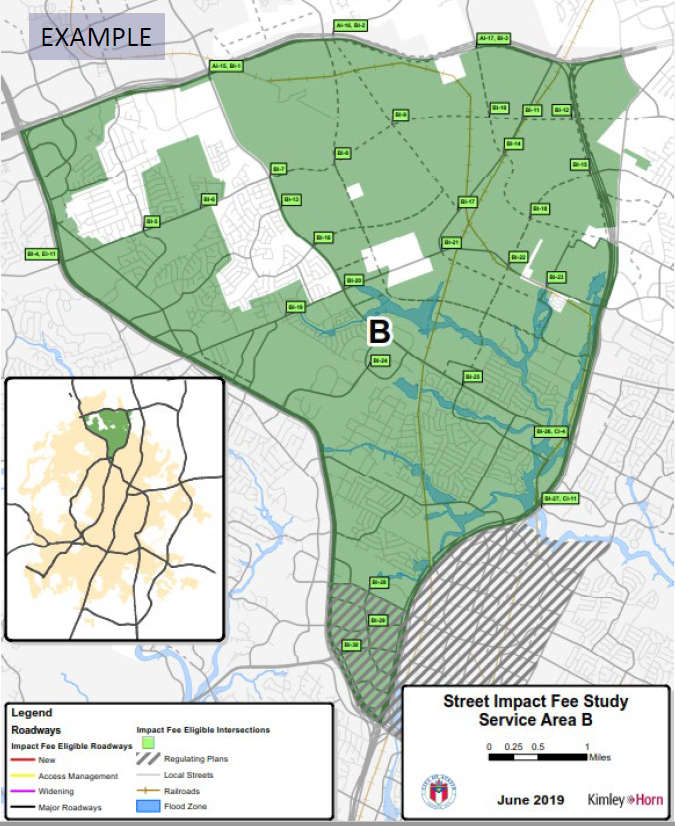
Project new growth for the next 10 years
Establish Service Areas within which a
maximum impact fee is determined
Develop Land Use Assumptions and corresponding
growth within each Service Area
Project corresponding roadway capacity needs (Roadway
Capacity Plan) to accommodate that growth within each
Service Area
Standardized measure of consumption attributable to an individual
unit of development calculated in accordance with generally accepted
engineering or planning standards and based on historical data and
trends applicable to the political subdivision in which the individual
unit of development is located during the previous 10 years
Roadway utilizes vehicle-miles: one vehicle
to travel one mile
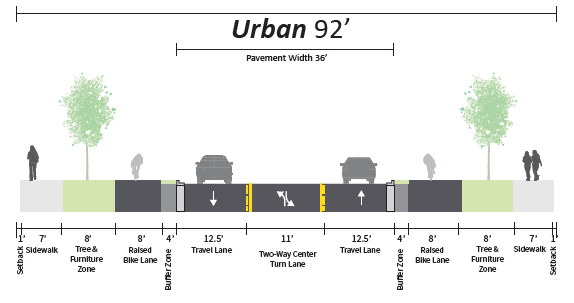
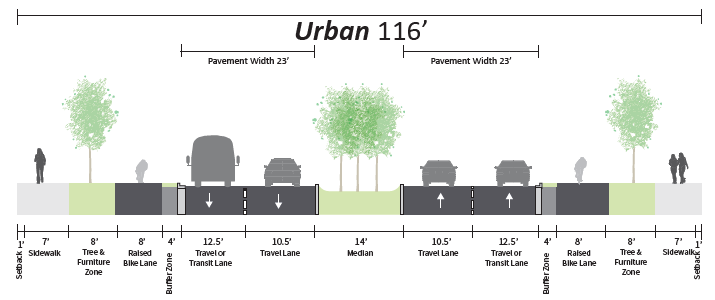
Roadway (Street) facilities means arterial or collector streets
or roads that have been designated on an officially adopted roadway
plan of the political subdivision, together with all necessary appurtenances.
The term includes the political subdivision share of cost for roadways
and associated improvements designated on the federal or Texas highway
system, including local matching funds and costs related to utility
line relocation and establishments of curbs, gutters, sidewalks,
drainage appurtenances, and rights-of-way.
Connection to Austin Strategic Mobility Plan
Council Action
- April 11, 2019
Adopted by City Council, amending Imagine Austin
A coordinated transportation strategy for all modes that supports
the growth concept of Imagine Austin