


What is Value Capture?
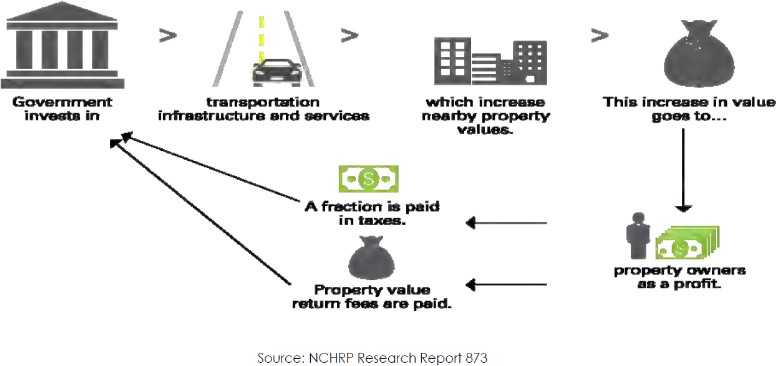
- Value Capture refers to a toolbox of strategies used by public agencies to recover a portion of the increased property value created as a result of public infrastructure investment
- Promotes the use of value capture mechanisms as part of a mixed funding and innovative finance strategy to accelerate project delivery and provide equitable funding for sustainable transportation investments
- Part of a mixed funding stream
- Accelerates project delivery
- Equitable
- Untapped funding source/s
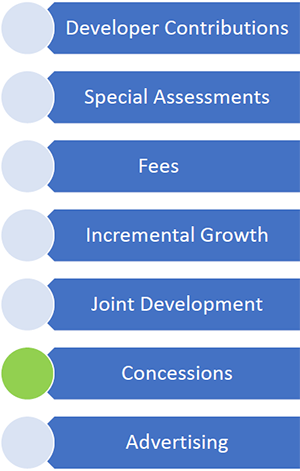
Developer Contributions
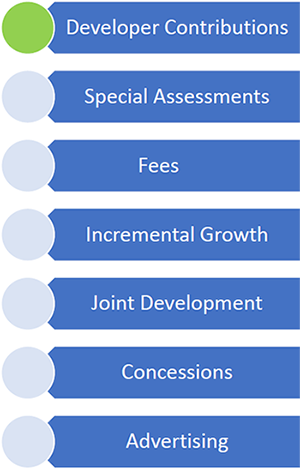
- A one-time fee assessed on new development
- Used for roadways, less frequently
- Used in transit
Hamilton Core Fund Hamilton, OH
- Public-private partnership of the City of Hamilton, the Hamilton Community Foundation, and local lending institutions
- Provides financial resources for real estate projects within the city’s urban core.
Source: www.revitalization.org Today, Hamilton’s CORE Fund engages in three different activities:- Provides gap financing
- Purchases and repurposes underutilized properties
- Acquires historic residential properties
Special Assessments
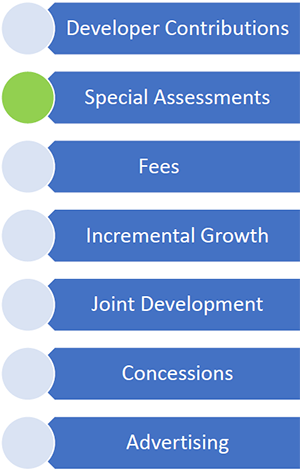
- A special fee levied on property owners to pay for infrastructure development
- Specific geographical area
- Assessed against those properties receiving benefit from the improvement
- The tax represents a portion of the estimated benefit to properties in close proximity
Lake Shannon Road Improvement Tyrone Township, MI
- Petition for repaving roads in exchange for a 10- year tax assessment
- Assessment will be paid in 10 annual installments starting in 2018
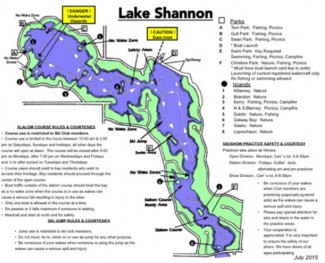 Total cost $1,310,000 in special assessment bonds
Fees
- Applies to all residents and businesses
- Payed by property occupants rather than property owners
- Based on the estimated number of roadway trips generated by a property
- Fees are typically added to city utility bill
Mission, KS
- Calculated by estimating the average number and intensity (type/size) of use
- Single-family homes pay a flat fee of $72 per year
- Other property types pay by land use type
- 91% of all multi-residential or tenant spaces pay less than $100 per year
- 60% of all commercial spaces pay less than $1000 per year
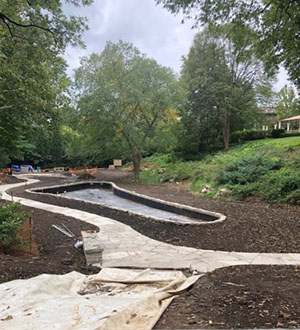
Source: https://www.facebook.com/Sunken
GardenRestorationStreets- Oakwood Rd
- Overhill Rd
- Parks and facilities
- Sunken Garden Park
- Spot curb replacement program
- Assessment of curbs, gutters, and sidewalks throughout
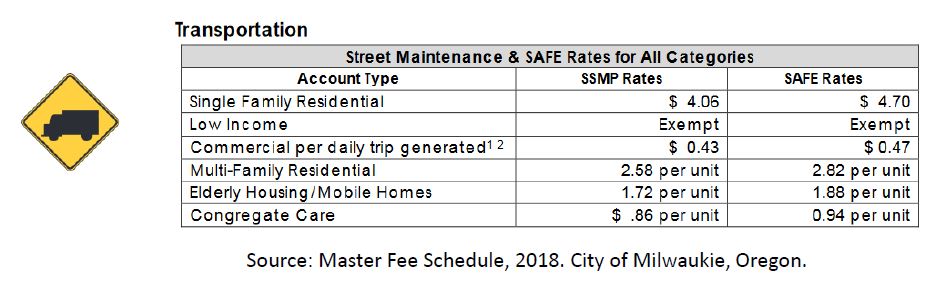
Milwaukee, WI
- Fees assessed on properties based on transportation demand created
- Applied annually to specific users
- Typically levied on a area-wide basis
- Most commonly applied to roads
- Generally for maintenance rather than capital projects
Incremental Growth
- Within a defined geographic area or zone
- Authorized by 49 state statutes and the District of Columbia
- Offers a source of long-term revenues and generates significant “gap financing”
- Flexible, powerful tool to foster high quality development and redevelopment
State of Ohio
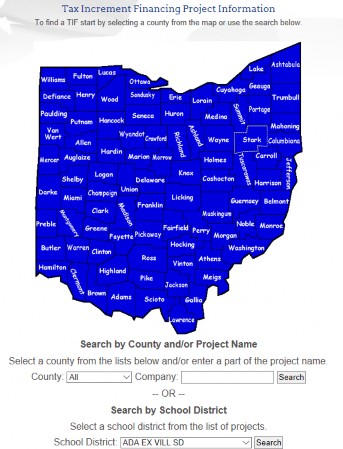
Source: www.development.ohio.gov
- Implemented at the local level
- Payments derived from the increased assessed value of any improvement
- Implementation steps:
- Designate the parcel
- Declare improvements to serve a public purpose
- Delineate improvements that will directly benefit the parcel
- Specify equivalent funds for redirected monies
Joint Development
- Involves a partnership between a public entity and a private developer to develop certain infrastructure assets
- Sale/lease of development rights over a transit station or highway
- Plays a key role in some urban projects
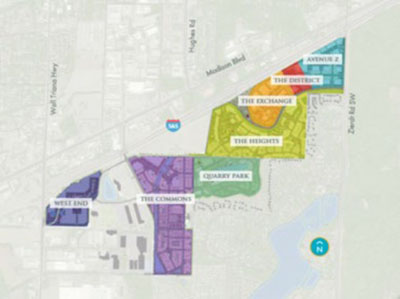
Madison, AL
Source: https://www.al.com/business/2017/05/town_
madison_partners_with_atl.html
Town Madison project: Madison has seen a 45% population growth since 2000
- Town Madison project: Madison has seen a 45% population growth since 2000
- $300 million
- 100-acre mixed land use
- Luxury apartments (280 units)
Concessions
- A long-term lease of existing highway facilities (i.e. toll facility) and use of the lease revenues to pay for other highway improvement needs
- U.S. experience with infrastructure asset recycling is limited
Indiana Toll Road
- $3.8 billion
- 75-year agreement
- Received $3.8 billion upfront
- Funded 10 transportation plans
- Retained all public employees
- Other examples:
https://www.fhwa.dot.gov/ipd/value_capture/project_profiles/
Advertising
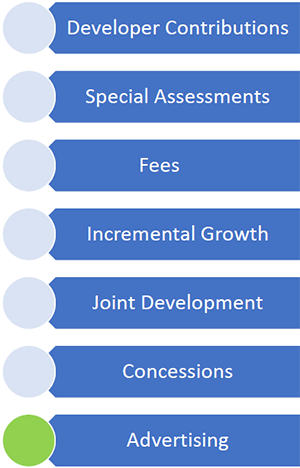
- Can be derived by selling space on transportation facility assets
- Inside transit vehicles
- Transit stations or bus stops
- Roadway billboards
Value Capture Summary
Value Capture is ...
- A set of powerful funding tools that can help address
- funding gaps (USDOT supports Value Capture)
- Can be part of the mix of funding sources for transportation improvement solutions
- Can accelerate project delivery, enhance safety, and save time and money when done properly
Steps to a Successful Value Capture Project
EDC-5 Funding Opportunities
- State Transportation Innovation Council (STIC) Incentive
- Up to $100,000 per STIC per year to standardize an innovation https://www.fhwa.dot.gov/innovation/stic/
- Accelerated Innovation Deployment (AID) Demonstration
- Up to $1million available per year to deploy an innovation not routinely used https://www.fhwa.dot.gov/innovation/grants
EDC-5 Value Capture Implementation Team
Thay Bishop, Senior Program Advisor Center for Innovative Finance Support
E-mail: Thay.Bishop@dot.gov
Tel: 404-562-3695
Stefan Natzke, Team Leader
National Systems & Economic Development
E-mail: Stefan.Natzke@dot.gov
Tel: 202-366-5010
Questions & Answers

Transportation Utility Fee (TUF)
Tina Bailey, PE - Transportation Division Manager
About Hillsboro
- Suburb of Portland, OR
- Population: 101,920
- 25.49 square miles
- “The Silicon Forest”
About our Roadways
- Centerline Miles of Roadway:
- At adoption: 214.08
- Current: 234.91
- Average Network Pavement Condition (PCI)
- At adoption: 79
- Current: 82
- Percent of Roads in Good to Poor Condition:
- At adoption: 10.5%
- Current: 3.1%
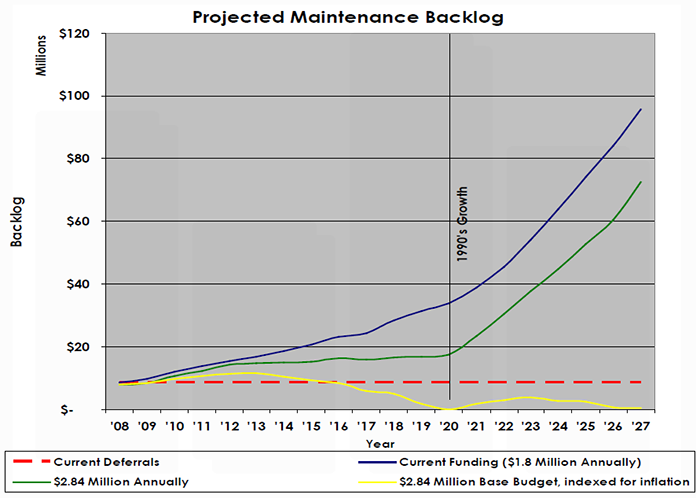
- Deferred Maintenance:
- At adoption: $9.1 Million
- Current: $7.55 Million
What is TUF?
- Treats roadways like other utilities.
- Monthly charge-like storm, sanitary, and water-for maintenance of roadways
- Hillsboro’s also includes an allotment for bicycle and pedestrian improvements
- Assessed in utility bill with storm, sanitary, etc.
- All customers pay based on estimated trip generation
- Other agencies have based on parking stalls, sewer equivalent dwelling units, flat rate per account, number of employees, truck deliveries, building square footage.
History
- Fee Development/Outreach: April 2007 to July 2008
- Program approved by Council: July 2008
- Effective: March 2009
- Reduced Multi Family Rate: July 2009
- First Evaluation: October 2010
- Recalibrated/Base Charge: May 2011
- Shifted cost allocation/Increased Revenue: April 2015 to April 2019
Public Official Support
- Didn’t happen overnight.
- Modeling conditions/needs was critical
- Providing a simplified understanding of pavement management.
- House Analogy
- Updating the council annually on the effects of decisions.
- Deferrals – Historical and projected
- Modeling budget scenarios
- Look for critical message.
Hillsboro’s Critical Message
Public Hearing Testimony
- Residential:
- Generally supported.
- Concerns about low income customers.
- Business Lobby Concerns:
- This is a terrible time to increases taxes.
- This is anti-business.
- More money is government’s only solution.
- We pay more than our fair-share.
- ITE overestimates our trips.
- We don’t benefit from bicycle & pedestrian facilities.
Cost Allocation
Residential/Non-Residential Share – At Adoption
- Based on Metro determination of residential, commercial, and industrial use of collectors and arterials.
- No data for local and neighborhood routes which account for the majority of Hillsboro’s network.
- Doesn’t differentiate between local streets that are residential and local streets that are commercial or industrial.
- Doesn’t account for alleys.
- Resulted in a cost allocation 52% residential/48% non-residential
Classification |
Lane Miles |
Residential |
Commercial |
Industrial |
Public |
Arterials |
17.23 |
45% |
35% |
15% |
5% |
Collectors |
125.16 |
50% |
30% |
15% |
5% |
Local/Neighborhood Routes |
324.38 |
60% |
25% |
10% |
5% |
Fee Determination
Residential
- At Adoption: Committee determined all residential units should pay the same amount.
- Fee = Monthly Revenue Target/# Dwelling Units
- Current: Reduced Multi-family Residential (MFR) to 90% of Single Family Residential(SFR)
- SFR Fee=Monthly Revenue Target/(#SFR + 0.9(#MFR))
- MFR Fee=0.9(SFR Fee)
- Residential customers pay TUF for the Pavement Management Program (PMP) and Bicycle/Pedestrian Improvements (BPCIP)
- Fee is determined for PMP & BPCIP revenue targets
Non-Residential
- Trip generation for every non-residential land use had to be determined.
- Information not readily available.
- Building footprints determined through aerial photography.
- Physically visited sites to determine the land use and number floors.
- Land uses with similar ITE trip generation characteristics grouped (bins)
| 1 Intel |
| 2 School District |
| 3 Target |
| 4 City Hall |
| 5 Wells Fargo |
| 6 McDonalds |
| 7 Regal Cinemas |
- Bin 1: <7 trips/1000 sq.ft.
- Bin 2: 7-21 trips/1000 sq.ft.
- Bin 3: 25-53 trips/1000 sq.ft
- Bin 4: 53-151 trips/1000 sq.ft.
- Bin 5: 151-400 trips/1000 sq.ft
- Bin 1: less than 7 trips/1000 sq.ft
- Bin 6: greater than 400 trips/1000 sq.ft.
- Bin 7: Special for ITE Trip generations not based on sq.ft.
- % of bin trips/total non residential trips equivalent to bins cost share of non residential fee.
- Bin 7: trip generation per business capped at 1500 trips.
- Rates:
- Bins 1-6: Bins cost share/1000 sq.ft. in bin
- Bin 7: Bins cost share/trips in bin
Rates
Category/Bin (ITE Trip Generation) |
Rate Basis |
At Adoption (‘09) |
Current |
Non-Residential |
|||
1 (< 7 trips/1000 sf) |
1000 sf |
$0.22 |
$0.34 |
2 (7-25 trips/1000 sf) |
1000 sf |
$0.53 |
$0.82 |
3 (25-53 trips/1000 sf) |
1000 sf |
$1.78 |
$3.01 |
4 (53-151 trips/1000 sf) |
1000 sf |
$3.73 |
$6.06 |
5 (151-400 trips/1000 sf) |
1000 sf |
$10.18 |
$15.91 |
6 (>400 trips/1000 sf) |
1000 sf |
$18.41 |
$39.86 |
7 (non square footage based) |
Trips (max 1500) |
$0.05 |
$.08 |
Base Charge |
n/a |
$7.91 |
|
Residential |
|||
8 (SFR) |
Dwelling Unit |
$3.10 |
$8.79 |
9 (MFR) |
Dwelling Unit |
$3.10 |
$7.91 |
Non-Residential Customers
Monthly Bills
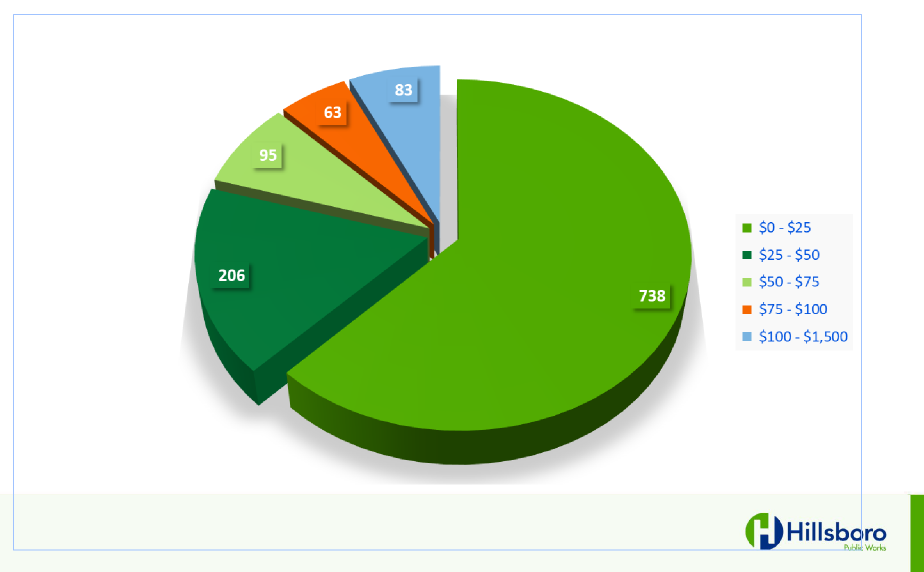
Revenue
Category |
Units |
Monthly |
Annual |
|
MFR |
16688 Units |
PMP |
$92,451 |
$1,109,412 |
BCPIP |
$39,446 |
$473,352 |
||
Total |
$131,897 |
$1,582,764 |
||
SFR |
23497 Units |
PMP |
$144,495 |
$1,733,940 |
BPCIP |
$61,797 |
$741,564 |
||
Total |
$206,292 |
$2,475,504 |
||
Non-Residential |
1430 Accounts |
PMP |
$87,035 |
$1,044,420 |
Total PMP |
$323,982 |
$3,887,784 |
||
Total BPCIP |
$101,243 |
$1,214,916 |
Discounts/Waivers
Single Family Residential
- Motor Vehicle Discount - 30% discount
- No vehicle registered to address.
- Transit Pass Discount - 30% discount
- Tenant has purchased annual transit pass.
- Hardship Waiver - One full year waiver
- Household income <60% of Oregon median
- Unemployment Waiver - 6 Month Waiver
- One party in household laid off within 30 days of application
Non - Residential
- Employer Transit Pass Discount - Up to a 30% discount
- Employer purchases annual transit passes.
- Employer DEQ ECO Program Discount Up to a 30% discount
- Employer programs in place to reduce vehicle trips.
- Employers can combine discounts up to a maximum combined of 30%
Potential Future Changes
- Only the Residential Hardship Waiver is being utilized by customers.
- Different program from all our other utilities hardship programs makes it confusing to customers.
- Fee is not indexed.
- Does require a “rebalance” every five years.
- Additional revenue due to new customers is the starting point for a “revenue neutral” rebalance.
- Some indication from individual councilors of an interest to expand the fee for street tree and/or sidewalk maintenance.
More Information
- City of Hillsboro TUF Website: Hillsboro-Oregon.gov/TUF
- Tina Bailey
tina.bailey@Hillsboro-Oregon.gov