Value Capture Webinar Series

Value Capture: Capture Value from Existing Assets to Fund Previously Unfunded Infrastructure Projects and Case Studies - Webinar

October 24, 2019

View as PDF

Introductory Slide -
Value Capture: Capture Value from Existing Assets to Fund New Infrastructure Projects

Presentation 1 -
Value Capture & Asset Recycling: Advancing Infrastructure Projects in a Time of Funding Crisis

Outline of Presentation

  • Overview of Everyday Counts Fifth Round (EDC-5)
  • Key Distinctions
  • Why is Value Capture Needed?
  • Value Capture & Asset Recycling - Overview & Benefits
  • Federal Roles
  • Case Studies
  • Q&A
Logo -  Value Capture: Every Day Counts Innovations / Federal Highway Administration
What is "Every Day Counts" (EDC)?

State-based model to identify and rapidly deploy proven but underutilized innovations to:

  • Shorten the project delivery process
  • Enhance roadway safety
  • Reduce congestion
  • Improve environmental sustainability
  • EDC Rounds: Two-year cycles
  • Initiating 5th Round (2019-2020) - 10 innovations
  • To date: 4 Rounds, over 40 innovations

For more information: https://www.fhwa.dot.gov/innovation/

FAST Act, Sec.1444

Funding and Financing
Funding and Financing flow chart

Text of funding and financing flow chart

*Funding is leveraged with Traditional and Innovative Financing

  • Sources of Funds
    • Funding
      • Federal Funds
      • State & Local Funds
      • Value Capture
      • Tolls/Fees/Lease Rev.
      • New Taxes (Sales, Payroll, etc.)
      • Other Operating Rev.
    • Financing
      • Traditional
        • Cash/Pay-Go
        • Revenue Bonds
        • Private Bank Loans
        • Project Finance
      • Innovative
        • PABs
        • Federal Low- Interest-Rate Loans
        • State Infrastructure Banks
        • Investor Equity
  • Uses of Funds
    • Construction Costs
    • Operation & Maintenance Costs
Value Capture vs. Tax
  • Tax
    • Forced contribution to raise revenue for the maintenance of governmental services offered to the general public
    • Levied whether or not one uses a particular service
  • Value Capture (Fees/Assessments/Incremental Growth Tools)
    • Paid in exchange for a special service, benefit, or privilege not conferred upon the general public
    • Not a revenue measure but a means of compensating the government for the cost of offering and regulating the special service or benefit
    • Payment of a fee is voluntary (can refuse the special service, benefit, or privilege)

Why are Value Capture & Asset Recycling Needed?

(ASCE) 2017 Report Card
report card graphic

Text of the 2017 ASCE Report Card

  • 2017 Infrastructure Report Card
    America's Grade: D-
    • Bridges: C+ 9.1% of bridges rated structurally deficient
    • Aviation: D U.S. Airports serve 2 million passengers daily
    • Dams: D 15,498 (17%) dams identified as high-hazard potential
    • Schools: D+ 53% of schools need improvements to reach "good" condition
    • Wastewater: D+ Demand on treatment plants will grow more than 23% by 2032
    • Drinking Water: D 6 billion gallons of treated water lost every day
    • Solid Waste: C+ 258 million tons of municipal solid waste generated in one year
    • Energy: D+ 3,571 total power outages reported in one year
    • Inland Waterways: D 49% of vessels experience delays across the inland waterways system
    • Parks: D+ 11.9 billion in National Park Service deferred maintenance
    • Levees: D Over $1.3 trillion in property value behind levees
    • Roads: D 6.9 billion hours delayed in traffic - 42 hours per driver
    • Ports: C+ 99% of America's overseas trade passes through ports
Highway Capacity & Condition Challenges
collage of various infrastructure issues
  • Two out of every five miles of America's urban interstates are congested
    • Costs the country $160 billion annually in wasted time and fuel
  • One out of every five miles of highway pavement is in poor condition
    • $836 billion backlog of highway and bridge capital needs
  • 47,000 bridges in poor condition and 260,000 (43%) bridges are over 50 years old
  • Pedestrian deaths on US roads have increased 11% since 2015; (5,977 in 2017)
Mileage by Ownership & Federal-aid Highway System
  • 45% of America's major roads are in poor or mediocre condition
  • 15% of U.S. rural roads are rated in poor condition, while 21% are in mediocre condition
  • Road ownership: Local 79%, State 18%, & Federal 3%
Ownership Federal-Aid Highways Non-Federal-Aid Highways Total
Rural 668,082 2,280,612 2,948,696
Urban 359,767 875,245 1,235,012
Total Rural & Urban 1,027,848 3,155,858 4,183,707
Highway Trust Fund Funding Gap

chart - funding gap

Value Capture Overview & Benefits

What is Value Capture?

"Value capture" refers to a toolbox of strategies used by public agencies to recover a portion of the increased property value created as a result of public infrastructure investment.

flow chart

Text summary of Value Capture flow chart

  • Government invests in...
    • transportation infrastructure and services
      • which increase nearby property values.
        • This increase in value goes to...
          • Property owners as a profit.
          • A fraction is paid in taxes
            • Property value return fees are paid.
              • (cycle back to "Government invests in...")
Value Capture Techniques Summary
xxx

Text of Techniques Summary chart

  • Developer Contributions - One-time charges collected by local governments from developers to offset the cost of infrastructure and services necessitated by new development.
  • Special Assessments - An additional fee or tax assessed on businesses or residents in specified geographic areas benefiting proximity to a highway or other transportation facility or corridor.
  • Fees - Similar to a utility fee, transportation fees are assessed based on how individual businesses and households use transportation facilities.
  • Incremental Growth - A mechanism allocating back to infrastructure from some specified portion of increased property tax revenues fostered by new infrastructure - often for a specified period of time.
  • Joint Development - Sale or lease of land or air rights on or adjacent to transportation facilities. This can include donations of land or other in-kind resources from the private sector in ongoing commercial operations.
  • * Concessions - Sale or lease of government owned assets - such as toll roads or bridges - to private-sector investors/operators.
  • Advertising and Naming Rights - Sale of advertising space or naming rights on a transportation facility. Note: Commercial uses within Interstate Highway System right of way, including rest areas, is prohibited by law; however, they may be allowed on toll facilities and in transit stations.

* Topic of this webinar

Value Capture Can .........
Value Capture infographic

Text of "Value Capture Can..." infographic

  • Value capture projects can recover up to 50% or more of overall project costs
    • Can support multimodal projects
  • Revenues capture are a portion of the benefit landowners receive
    • Facilitates better land use and transportation planning
  • Creates sustainable revenue sources
    • TIFs don't raise taxes; they expand the tax base
  • Can fund capital projects, as well as maintenance and operations
    • Appropriate for all roads, from Interstate highways to local roads
  • There are techniques available appropriate to urban, suburban, and rural settings
    • Promotes efficient land use

Asset Recycling Overview and Process

Concession: Asset Recycling Overview
  • Sale or long-term lease of existing highway facility and use of the revenues to pay for other highway improvement needs
  • The value of the old infrastructure is recycled to pay for the new infrastructure project
  • It does not have to be a revenue-generating facility
  • U.S. experience with infrastructure asset recycling dates back to 2005
Asset Recycling Global Practices
Australian bridge
Asset Recycling (Australia) - Monetizing brownfields to pay for greenfields
Brazilian auction scene
CEPACs (Brazil) - Commoditizing land-use entitlements thru auctions
CEPACS - Certificates of Potential Additional Construction
United States toll road
Asset Recycling (America) Monetizing brownfields to pay for 10-year transportation plan
Asset Recycling (Australian Model)
Source: Bipartisan Policy Center

Summary of flow chart

Australia's Asset Recycling

  • Government-owned asset
    • Leased or sold to a private company
      • Revenue pays for new projects
        *Federal government also awards a 15% funding bonus for the new projects
        • (return to "Government-owned asset" above)
Concession: Asset Recycling (American Model)
american model flow chart
Source: Atkins Acuity

Text summary of American model

  • Existing Assets
    • 1. Divest existing assets
      • Proceeds from monetizing existing assets
        • 2. Reinvest in new infrastructure
          • New Infrastructure
            • 3. Recycle assets in the future
              • Existing assets (return to #1.)
Require P3-Enabling Legislation
Map showing various states and their levels of P3 Enabling Legislation
Source: FHWA

More details on P3 Enabling Legislation

Typical P3 Transaction Structure
Complex flow chart demonstrating a typical P3 transaction structure


State of Practice in the U.S
  • Chicago Skyway and Parking Garages, 2005
  • Indiana Toll Road (ITR), 2005
  • Maryland Seagirt Marine Terminal, 2009
  • Puerto Rico PR-22 and PR-5 Lease, 2011
  • Luis Muñoz Marín International Airport, PR, 2013
  • Virginia Transform 66 - Outside the Beltway, 2017
  • Colorado's Innovative Asset Recycling Project, 2018
  • ADOT Land Sale to help fund I-10 widening, 2018
  • Others

Value Capture & Asset Recycling Strategies

Asset Recycling & Value Capture Strategies

Steps

Text summary of flow chart

  • Step#1 - Sale or Long-Term Lease
    • Proceeds from Sale or Long- Term Lease
      • Step #2 - Invest New Roads & Bridges
        • Value Creation
        • Development or Economic Activites
        • Value Capture
          • Step#3 - New/Existing Transportation Facilities
            • (return to step 1)
Benefits
  • Advance new infrastructure without having to borrow, increase debt, or implement new taxes, levies or tolls, etc.
  • Provide alternatives to supplement traditional sources
  • Create jobs & improve regional economy
  • Can capture value created by the new infrastructure projects, ensuring continued recycling and capture of revenue created by new transportation investment
  • Capture the value of underutilize infrastructure, which will cost more money and lose value over time
  • Access to Federal low-interest rate loan programs

Federal Roles

Federal Government's Role in Value Capture Strategies
Federal Role in Value Capture Strategies Infographic

Text of "Federal Roles" Infographic

Universe of Land under State Legal Authority

Land Owned/Regulated by City/County

  • Depends on local policies
  • Decision at the city/county level
  • State DOT and FHWA have no direct influence
  • Land Owned/Acquired by State DOT with State Funds

    • Decision at the State level
    • FHWA has no direct influence

    Land Purchased with Federal Funds

    • State DOT and FHWA have direct influence
    • US DOT supports value capture
Value Capture Implementation Team

Co-Leads

  • Thay Bishop, FHWA Center for Innovative Finance Support, OIPD
  • Stefan Natzke, FHWA Office of Planning, Environment, and Realty

Members

  • Jennifer Ahlin, Virginia Department of Transportation
  • Janine Ashe, FHWA District of Columbia Division
  • David Cohen, FHWA Office of Project Development & Env. Review
  • John Duel, FHWA Office of Planning, Environment, and Realty
  • Kathleen Hulbert, FHWA Infrastructure Office
  • Andrea Kirk, FHWA Center for Local-Aid Support, OIPD
  • Chip Millard, FHWA Freight Management & Operation
  • Diane Mobley, FHWA Chief Counsel Office
  • Kevin Moody, FHWA Resource Center
  • Ben Orsbon, South Dakota Department of Transportation
  • Jill Stark, FHWA Office of Planning, Environment, and Realty
  • Lindsey Svendsen, FHWA Office of Planning, Environment, and Realty
  • Jim Thorne, FHWA Office of Planning, Environment, and Realty
  • Bingxin Yu, FHWA Transportation Policy Studies
VCIT Focus Areas

Communication - Developing the tools to help FHWA staff and others promote Value Capture to local public agencies (Value Capture Implementation Manual)

Technical assistance - Providing technical assistance to local public agencies interested in pursuing Value Capture (Peer Program)

Clearinghouse (website) - Identification of best practices and lessons learned and promoting further discussion on innovative funding options for local public agencies, lessons learned from past and current efforts, etc

EDC-5 Funding Opportunities

State Transportation Innovation Council (STIC) Incentive

Accelerated Innovation Deployment (AID) Demonstration

Contact

Thay Bishop
Email: thay.bishop@dot.gov
Tel: 404-562-3695
or
valuecapture@dot.gov

Presentation 2 -
Virginia's Transform 66 Program

Value Capture National Webinar

FEDERAL HIGHWAY ADMINISTRATION

Susan Shaw, P.E., Northern Virginia District Megaprojects Director
Virginia Department of Transportation

Logo: VDOT

October 24, 2019

Northern Virginia Regional Express Lanes Network

Area map - Northern Virgnia Regional Express Lanes Network
  • 90+ mile express lanes network by late 2022
  • 54 miles in service
    • I-95, I-495, I-66 Inside the Beltway
  • 41 miles under construction
    • I-395 Northern Extension
    • I-66 Outside the Beltway
    • I-95 to Fredericksburg
  • 3 miles under study
    • I-495 Northern Extension
  • Three independent operators

I-66 Outside the Beltway Project

Purpose and Need
  • Address existing and future transportation problems
  • Improve multimodal mobility along the I-66 corridor by providing diverse travel choices in a cost- effective manner
  • Enhance transportation safety and travel reliability
area map
city bus
congested traffic
Passengers exiting WMATA 5000-Series cars

I-66 Outside the Beltway
Project Scope

Two Express Lanes (convert existing HOV lane & add one lane)

  • 22.5 miles (two lanes in each direction) alongside general purpose lanes from I-495 to Gainesville
  • HOV-3+ and buses travel free
  • Non-HOV tolled
  • Congestion-based tolls (similar to other express lanes in region)
  • Converting HOV-2+ to HOV-3+ by 2022, consistent with the region's CLRP

Three regular lanes

  • Open to all traffic
  • No tolls
  • Ramp-to-ramp connections between interchanges (auxiliary lanes)
  • Safety, interchange and operational improvements

New transit service and other multimodal improvements

  • Two new park and ride lots providing 3,200+ parking spaces
  • Transportation Demand Management (TDM) strategies
  • Bicycle and pedestrian trail and improvements including 11 miles of new trails
I-66 Outside the Beltway roadway photo

I-66 Outside the Beltway
Preferred Alternative: Mainline Cross Section

Artists diagram of proposed lanes and roadway layout

Flexible barrier with buffer, median for potential future transit (with auxiliary lanes, if needed)

VDOT P3 Procurement Philosophy

  • Protect the taxpayers
  • Use P3s only when they are in the best interest of the public
  • Deliver a project that best meets the needs of the public
  • Be transparent and accountable to the public and elected officials
  • Embrace P3 reforms of HB1886 (2015)
Logo: Virginia Public-Private Partnerships

I-66 Outside the Beltway
Project Procurement

  • Commonwealth evaluated three procurement options:
    • Toll Concession or DBFOM (Design-Build-Finance-Operate-Maintain)
    • DBOM (Design-Build-Operate-Maintain)
    • D-B/ATC (Design-Build with Alternative Technical Concepts)
  • In September 2015, RFQ issued for
    • Design-Build
    • Design-Build-Operate-Maintain
    • Design-Build-Finance-Operate-Maintain
  • Qualifications received October 1, 2015, from multiple teams
  • Conceptual financial proposals from shortlisted teams received on December 1, 2015
  • Public option will remain on the table until deal is signed with private partner

I-66 Outside the Beltway
Key Commercial Terms and Contract Provisions

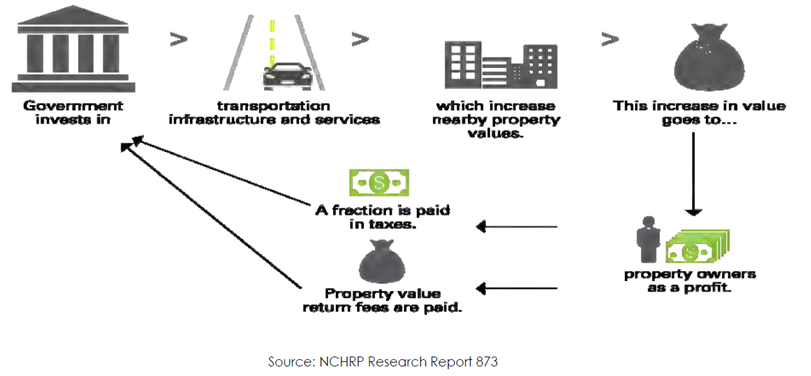
The key contractual provisions in the comprehensive agreement are summarized in the following slides.

Term Summary
Scope
  • The Developer is responsible to design, build, finance, operate and maintain the Project
Term
  • 50 years from agreement date (commercial close) including design-build period
Traffic & Revenue Risk
  • The Developer will bear 100% of the risk related to traffic and revenue (incl. HOV levels)
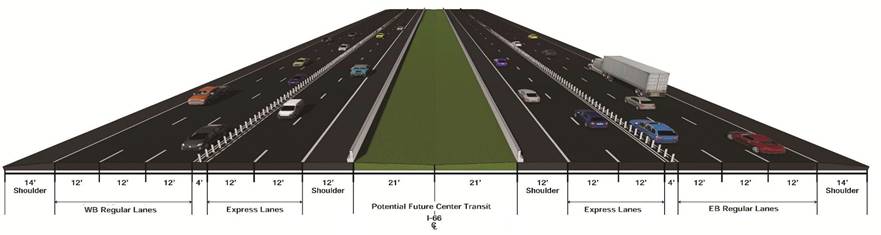
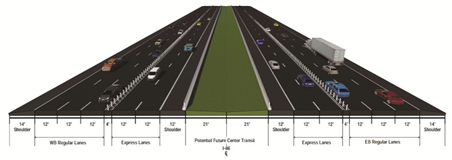
Tolling Policy
  • Dynamic pricing: toll rates will be adjusted periodically based on traffic volumes and speed
  • Minimum speed of 55 mph, posted speed of 70 mph
  • Exempt vehicles: the Express Lanes will be free at all times for users in high occupancy vehicles with three or more occupants (HOV-3+) as well as buses, motorcycles, and emergency vehicles
  • Heavy trucks are allowed in the Express Lanes
Right of Way Acquisition
  • The Developer will bear the risk of all conditions occurring on, under or about the Project Right of Way on which the Work is performed
  • Developer will be responsible for performing all activities and services necessary for the acquisition of all Project Right of Way at its sole cost and expense
  • For parcels that go to condemnation, Developer will be required to place in the Project Enhancement Account an amount equal to 130% of the assessed value of the parcel plus $50,000; the Department will be responsible for any costs of condemnation that exceed 130% plus $50,000
Alternative Facilities
  • Protection provided to the Developer for (i) additional general purpose lanes along the Project corridor and (ii) WMATA Orange Line expansion (first 10 years of operations)
Early Works (Limited Notice to Proceed)
  • Early works, up to a maximum of $39m, to include design development and activities related to obtaining environmental permits; full notice to proceed only after obtaining key environmental permit and financial close
Transit Funding
  • Developer must make transit funding payments to VDOT during the operating period, according to a fixed nominal payment schedule. Developer's obligation is limited to providing the required funding only (no transit operations, maintenance, etc.)
Support for Corridor Improvements
  • Developer must provide VDOT with payments totaling $350m (PV @ 6.14% discount rate as of November 2020) over the term of the concession
Upside Sharing
  • An upside sharing mechanism will be structured with payments starting after reaching the base case equity IRR
Operations and Maintenance (O&M)
  • Developer responsible for O&M of Express Lanes, except for snow and ice removal
Intermediate Milestones
  • Intermediate parking spaces: Within 18 months of construction NTP
  • Remove traffic signals on Route 28: Within 24 months of construction NTP

I-66 Outside the Beltway
Results of the Procurement

I-66 Outside the Beltway Results of the Original P3 Analysis 2015 Public Option Express Mobility Partners
Upfront Public Funding (900 to 1,000) (400 to 600) 0
Transit Capital and Operating 0 800 800
Future Corridor Improvements 0 350 350
Concession Payment to TTF 0 0 500

Figures in millions

I-66 Outside the Beltway
Agreement Signed - December 2016

Express Mobility Partners

  • Equity Investors
    • Cintra Global LTD, Meridiam Infrastructure North American Fund II
  • Design-Build Contractors
    • Ferrovial Agroman US Corp, Allan Myers VA, Inc. (FAM Construction)

Project Cost: $2.3 billion construction project

Other Benefits to the Commonwealth

  • $500M now available for additional improvements to the I- 66 Corridor
  • $600M in anticipated public subsidy returned for other projects
  • $800M in transit subsidy
  • $350M in future I-66 Corridor improvements

Late 2022: Express Lanes scheduled for completion

Freeway traffic
Two new express lanes alongside regular lanes in each direction will look similar to existing I-495 Express Lanes
I-66 cross-section diagram
Flexible barrier with buffer, median for potential future transit (with auxiliary lanes, if needed)

Integrating Transit into Managed Lanes

  • Transit and travel choices key parts of Commonwealth's Northern Virginia Express Lanes
  • Strong commitment to HOV/HOT, leveraging reliability of express lanes to encourage ride-sharing
  • Transit components and funding included in comprehensive agreements with private partners and project scopes (I-66 OTB and I-395)
  • Toll revenues from VDOT-operated Express Lanes on I-66 Inside the Beltway supporting multimodal and transit improvements
  • Express Lanes provide benefits and incentives to carpools and transit through toll-free travel, and faster and more reliable trips
  • Transit financial incentives and resources part of Transportation Management Programs during construction
Bus transit
smiling carpool commuters

I-66 Inside the Beltway Express Lanes

  • Conversion of part-time HOV lanes to state-operated, part-time express lanes
  • Tolling during weekdays, peak hours, peak directions
    • Eastbound: 5:30 - 9:30 a.m.
    • Westbound: 3:00 - 7:00 p.m.
    • HOV2+ toll-free in 2017, HOV3+ toll-free when Express Lanes open on I-66 outside the Beltway (2022)
    • All vehicles using the lanes during tolling periods must have an E-ZPass or E-ZPass Flex (if they are HOV) mounted in vehicle
  • Toll revenue covers funds operations and multimodal projects (Commuter Choice program)
area map of I-66 express lanes
collage showing multiple modes of transportation including car, bike and transit

I-66 Inside the Beltway
Integrating Transit: I-66 Commuter Choice Program

bus and bike transportation options

I-66 Express Lanes Inside the Beltway Toll Revenue

  • Toll revenue funding multimodal projects benefitting I-66
  • Projects submitted by local governments and transit agencies to region's Transportation Commission and approved by Virginia's Commonwealth Transportation Board
  • $19.4M from toll revenue provided to support more than 20 projects that are operational and expected to move an additional 7,000 people through I-66 Corridor
    • $9.6M generated between Dec. 2017 and Sept. 2018
    • $9.8M provided in advance of Toll Day One

Additional Results

  • Bus usage increased by 575 additional riders each weekday through new commuter and express bus routes from suburbs to Pentagon and D.C.
  • Additional funds support transportation demand management outreach programs, bus stop enhancements, new carpool lots and bike share programs

Next Steps

  • Additional $11.6M from toll revenue to be contributed for more improvements by end of FY 19 (June 30, 2019).

I-66 Outside the Beltway
Integrating Transit

  • Two new park and ride lots with more than 3,200 new parking spaces and direct access to Express Lanes to open to commuters in late 2022
    • Creating a "carpool culture" on I-66 connecting outer suburbs with employment centers (Arlington, D.C. and Tysons) and Metro
    • First 1,000+ spaces opened October 7, 2019, as early project milestone to benefit commuters
  • $800 million in future Concessionaire payments for future mass transit improvements serving I-66 corridor funded from future tolls as part of agreement
    • Initial transit study identified new and expanded commuter bus service as a priority and Express Lanes will provide direct access to Orange and Silver Line Metro stations
Area map demonstrating the various transit options

Traffic & Revenue: Key T&R Drivers

Corridor in High Demand


  • Unpredictable travel times and increasing traffic congestion, with heavy traffic extending beyond morning and evening rush hours, and into the weekends
  • Roughly half of travelers are commuters
  • Limited alternative routes for daily commute into DC
  • High income areas and willingness to pay both for time savings and reliability
  • Speed drops to 10-15 mph during peak periods and delays add up to 25 minutes for full length
  • Project offers uninterrupted and reliable travel with up to 30 minutes in travel time saving during peak periods
Population Growth Continues
  • The region west of the District of Columbia has had a high rate of population growth from 2010 to 2013, especially near the I-66 corridor and within Loudoun County and Prince William County
  • Household projections show that regional economic growth will continue to attract new residents between 2010 and 2040
    • 26% growth for Fairfax County/Fairfax City/Falls Church, 81% for Loudon County, and 61% for Prince William County/Manassas
Diverse and Growing Economy
  • In 2013, the District of Colombia and Fairfax County were the two major employment centers in the region, accounting for about 1.3 million jobs
  • From 2000 to 2013, the District of Columbia and Fairfax County added approximately 6,700 and 3,800 jobs per year, respectively
  • The DC metro region is the 3rd most prosperous major metro region in the country in terms of per capita income
  • Expectation of continuing employment growth in the region of 1.3% annually between 2010 and 2040

I-66 Outside the Beltway
Concession Fee Project Requirements ($500 Million)

Projects must:

  • Benefit the toll facility user (Virginia Code)
  • Be federally eligible
  • Meet one of the project improvement goals
    • Move more people
    • Enhance transportation connectivity
    • Improve transit service
    • Reduce roadway congestion
    • Increase travel options
  • Be selected and recommended by NVTA
  • Be approved by the Commonwealth Transportation Board

I-66 Outside the Beltway
Concession Fee Project Categories and Status

Within Transform 66 Project Construction Limits:

  • Widen Jermantown Road Bridge to 4 lanes: Construction underway
  • Widen Monument Drive Bridge to add pedestrian facility: Design underway to determine cost.
  • Widen Poplar Tree Road Bridge to 4 lanes: Construction underway
  • Expand I-66 Median Replace I-66 Bridge over US 29: Design complete. Construction startup underway

Pedestrian Improvement Projects:

  • Nutley Street SW Mixed-use Trail from Marshall Road SW to Tapawingo Road SW: Underway
  • George Snyder Trail from Route 123 to Route 50 at Draper Drive: Design underway
  • Lee Highway Sidewalk Improvements from Nutley Street to Vaden Drive: Design underway

Transit Improvement Projects:

  • Commuter Parking Garage and Transit Station at Fairfax Corner: Design-build procurement underway
  • East Falls Church Metrorail Station Bus Bay Expansion: Design to begin Spring 2020
  • PRTC Western Bus Maintenance and Storage Facility: Construction underway
  • VRE Manassas Line Capacity Expansion and real-time traveler information project: Projects underway

Roadway Projects:

  • US 50 and Waples Mill Road intersection improvements: Design underway
  • Balls Ford Road widening from Groveton Road to Route 234 Business: Design-build procurement underway
  • Route 234 at Balls Ford Road interchange with Balls Ford Road improvements: Design underway
  • Route 29 Widen 1.5 miles: Design underway (June 10, 2019 Public Hearing)
Logo: VDOT - Virginia Department of Transportation

Presentation 3 -
State of Indiana: Asset and Infrastructure Management

Logo: Indiana Finance Authority

Mark Pascarella
Indiana Finance Authority
Director of Debt Management

Indiana Toll Road (ITR)- History

  • Indiana Toll Road
    • 156 mile toll road running east-west across northern Indiana
      • Connects to I-90/ Chicago Skyway at Illinois state line
      • Connects to I-80/I-90/ Ohio Turnpike at Ohio state line
  • Established in 1956
  • Status of Indiana Toll Road as of 2005
    • Toll rates were stagnant and unable to keep up with inflation
    • Large maintenance projects had been delayed
    • Tolls did not generate excess revenues to fund new infrastructure
ITR area map

Indiana Toll Road Concession

  • Public Private Partnership (P3) entered into in 2006
  • P3 highlights:
    • Winning firm: Indiana Toll Road Concession Company (ITRCC)
      • Cintra and Macquarie Infrastructure Group
    • 75 Year Lease
      • State of Indiana never relinquishes ownership of ITR
    • Monetization P3
      • ITRCC receives toll revenues
        • Revenue rate setting provided in the lease
      • ITRCC provides:
        • $3.8 billion in up front payment to State of Indiana
        • Operations and maintenance of asset
        • Toll revenue collection
        • Provide funds for other enhancements that benefit the State

ITR Concession Benefits

  1. Immediate Benefits
    • $3.8 billion in up front payment to State of Indiana
    • Agreement provided for ITRCC to complete deferred maintenance to bring toll road up specific standards set by the State
    • Operate and maintain ITR- Lifecycle approach
      • ITRCC must achieve certain requirements for quality or suffer penalties
    • Handback requirements- AT end of 75 years, State will receive ITR back in predetermined condition
    • Collect tolls
      • ITRCC incentive to operate tolling in most cost efficient manner
      • ITRCC must also provide excellent customer service in order to drive increased business to use toll road
        • As an example, keeping up with electronic tolling
      • Provide funds for other enhancements that benefit the State
        • ITRCC provided funds for State Police to cover ITR, constructed new State Police headquarters and has funded State police equipment.
  2. Asset Recycling (Long Term)- State received $3.8B
    • Funding for Major Moves
      • In 2006, Indiana had a $2.8B deficit for transportation funding
      • INDOT has received over $3.5B (including investment returns)
        • To date, Major Moves has funded over 773 projects totaling $3.13B
        • Remaining funds have associated projects assigned and are earning investment returns until anticipated spending
      • Funded $500 million Next Generation Trust Fund
        • Fund started to provide continuous funding into future
        • Investment returns fund INDOT projects (returns included above)
      • Approximately $500 million distributed to local governments for projects
      • Projects funded enabled eliminating rising construction costs due to acceleration of projects
        • Acceleration of projects placed Indiana with a significant competitive advantage in creating a friendly business environment
          • Positive business environment produces economic development
  3. Unintended Consequences (positive)
    • Indiana 2005
      • Reserve Levels- Negative
      • 2005- Indiana elects Governor Mitch Daniels
        • Governor Daniels focuses on fiscal responsibility
    • ITRCC Concession 2006- Provides significant transportation funding to Indiana during a time when Indiana was returning to fiscal strength
      • Still build infrastructure, build reserves and provide services
      • Reserves continued to grow while Indiana debt declined
      • Ratings stabilize or start moving up
    • 2008/2009 Great Recession
      • Reserves stay strong, debt continues to decline
      • Indiana is upgraded by S&P to AAA in 2008, upgraded to AAA and Aaa by Fitch and Moody's in 2010. Upgraded during Great Recession
      • ITRCC concession still funding large capital projects during recession
        • Allows Indiana to react to issues but also fund opportunities

ITRCC Concession Bankruptcy

  • ITR Concession Company LLC (ITRCC) Bankruptcy Filing
    • Bankruptcy petition filed by ITRCC, and affiliates, on September 21, 2014
      • The Toll Road would continue to be owned by the IFA on behalf of the State, with IFA retaining the rights it negotiated in the original lease
      • No changes to the current toll rate structure under the original lease agreement
      • No impact on the $3.8 Billion received by the State that was invested in Major Moves projects throughout the State
      • Road operations continued as usual during bankruptcy process without impact to drivers, employees, vendors and the communities served by the Toll Road
  • Result
    • Acquisition Of Toll Road Lease by IFM Investors. IFM elected to keep ITRCC structure
    • IFM will operate the Toll Road for the remaining 66 years of the original lease agreement, and is strictly held to the same operational standards set forth in the original lease agreement
    • IFM has pledged a $260 million investment improvement plan over the next five years
      • Bridge and pavement rehabilitation
      • Updating and improvements to the travel plazas along the Toll Road
    • Original concession documents provided for all rights of the IFA to be maintained. State of Indiana did not see reduced benefits as a result of the original Concessionaire going through bankruptcy
  • 2018: IFA worked with ITRCC to modify and update Lease based on current market conditions
    • State receives $1B over two years
      • Enact a one-time 35% increase on the toll rate
      • No extension of Lease term
      • Increase better aligns with market rate for tolling
        • Only applies to Class-3 (3 axle) and above vehicles
      • No additional changes to Lease
        • State still maintains ownership
        • ITRCC still responsible for all activities associated with initial lease
      • Agreement included additional upgrades/ enhancements to ITR
    • Spending priorities
      • Proceeds will benefit counties connected to ITR
      • Another significant resource to add more transportation projects that generate significant value to the State of Indiana

Conclusion

Questions?

Presented By:
Mark D Pascarella, CFA
Director of Debt Management
Indiana Finance Authority
317-234-2228
mpascarella@ifa.in.gov

Logo: Indiana Department of Transportation