


CONTENTS
FIGURES
TABLE
TIF is an infrastructure funding mechanism created in California in 1952.18 The concept rests on two assumptions. First, it is assumed that, absent new or improved public infrastructure, economic activity within a defined area would remain unchanged. In accordance with this assumption, tax revenues generated within this area would also remain essentially unchanged into the future. Second, it also is assumed that a proposed investment in new or improved infrastructure would induce an increase in economic activity and in tax revenues. Any subsequent increase in tax revenues above the pre-investment revenue level is a tax increment that is assumed to arise solely as a result of the public infrastructure project.
TIF also can be described as a project budgeting technique. Typically, infrastructure projects are vetted and placed in a capital improvement budget for approval. However, if an infrastructure project was going to primarily benefit private property owners in a small area, such a project might not be very competitive with other projects that would provide more widespread benefits. Because the assumption is made that TIF revenues would not exist but for the TIF project, the TIF project is not competing against other projects for funds from the anticipated revenue stream. Thus, TIF projects are "off budget" in this sense.
When a TIF mechanism is created, certain taxes are identified as the source(s) of potential tax increments. These taxes are benchmarked for revenue prior to the infrastructure project. If revenues from these benchmarked taxes increase above the benchmarked amount, the tax increment is not deposited into a jurisdiction's general fund. Instead, the tax increment (or a portion thereof) is deposited into an account dedicated solely to the funding and financing of the infrastructure project. If the initial assumptions are true, the infrastructure investment project is funded from revenues generated by economic activity induced by the infrastructure project.
TIFs are typically terminated after the TIF infrastructure project has been completed or its debt has been retired. State enabling statutes often indicate the maximum permissible duration of TIFs. If State enabling statutes allow for extending TIF durations, they will indicate the criteria and process for doing so. Many TIF infrastructure projects are financed by bonds. Typical TIF durations are between 15 and 30 years. After a TIF is terminated, the tax increment disappears and all of the tax collected is deposited in the general fund. Figure 1 illustrates the fundamental concepts behind TIF:
The original intent of a TIF programme is to stimulate private investment within a blighted area that has been designated through public hearings to be in need of economic revitalization. A typical TIF programme will finance a variety of infrastructure and site improvements that will attract new business and will hopefully raise property values within the TIF district.19
Figure 1. Tax increment financing: Fundamental concepts.20
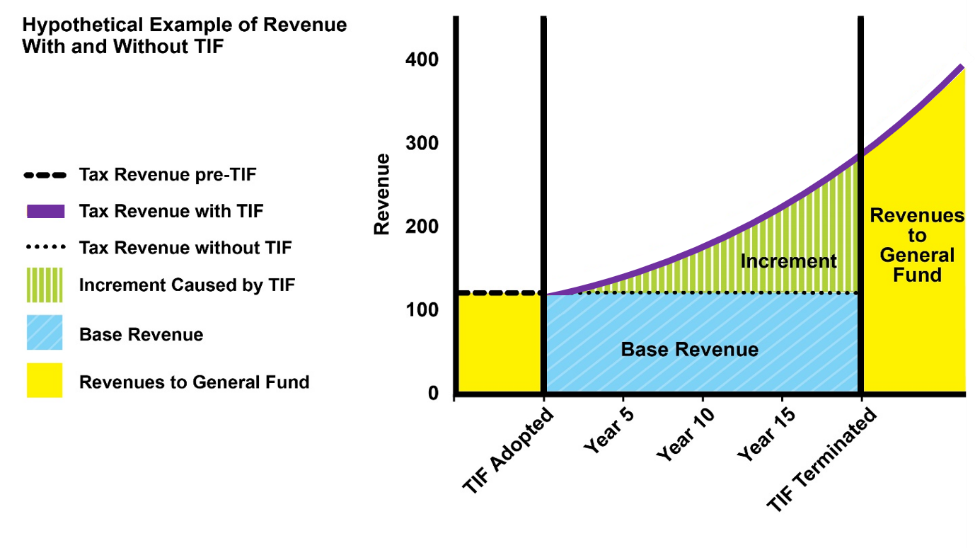
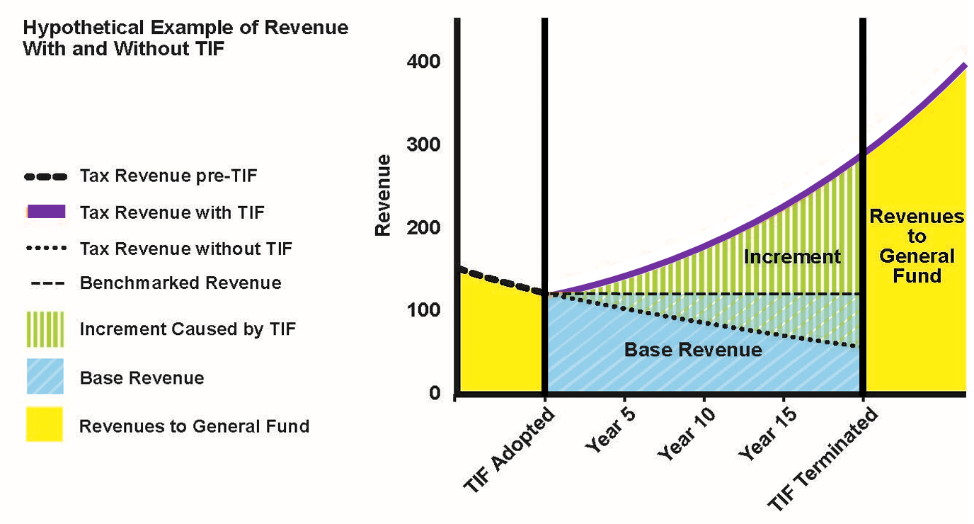
Figure 2 illustrates a more robust assumption that, in the absence of the TIF infrastructure investment and the ensuing private development, benchmarked revenues would actually decline over time. Under this scenario, general fund revenues are enhanced by the assumption that revenues from the TIF district would remain steady over the duration of the TIF.
Figure 2. Tax increment financing for a district with declining tax revenues.21
It is possible that tax revenues within the defined district would rise even in the absence of a TIF infrastructure project. Similarly, the ongoing projects and programs funded by the general fund, due to inflation, are likely to become more costly over time. For both of these reasons, limiting tax revenues going into the general fund at the benchmarked level could deprive the general fund of revenue and fail to support the existing level of public services after the first few years of a TIF (which often last for many years until the project has been completed or until the debt for the project has been retired, which is 20 to 30 years from TIF implementation).
Figure 3. Tax increment financing for a district with increasing tax revenues.22
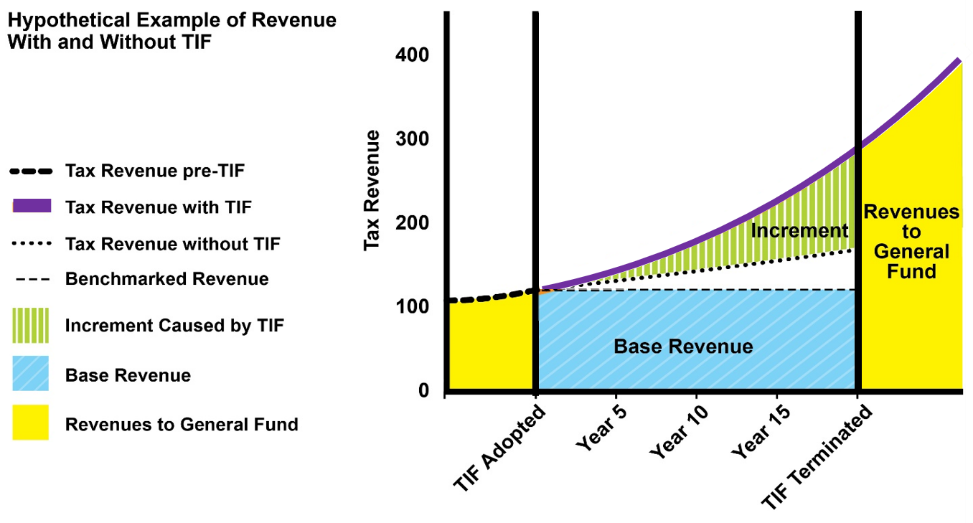
In figure 3, tax revenues within the TIF district would have risen somewhat even in the absence of the TIF project. Therefore, the TIF mechanism in this place, at this time, could be structured so that revenues allocated to the general fund (Base Revenue in the figure) are allowed to grow either by the rate of inflation or by some other factor. This diminishes the amount of revenue allocated to the TIF project accoun for the sake of maintaining the general fund and existing public projects and programs.
Figures 1 through 3 illustrate that what would occur in the absence of a TIF project could be quite different depending on the circumstances unique to the time and place where a TIF project is proposed. If allowed by State enabling statutes, TIF mechanisms could be structured differently to accommodate different baseline conditions and assumptions.
Although TIF enabling statutes vary from State to State, the typical mechanics are:
A determination of the geographic area to benefit from a TIF. In most States, areas must be blighted or distressed in order to be eligible for a TIF.23
Development of an infrastructure improvement proposal. Because TIFs rely on future increases in economic activity, the infrastructure improvement proposal often reflects what private developers say they need to advance private development projects.
A determination of debt service costs for the infrastructure improvement proposal.
Designation of one or more revenue sources as eligible to be benchmarked and used to fund the infrastructure proposal out of revenues that exceed the benchmarked amounts (tax increments).
Estimating the likely amount of revenue increases for the benchmarked funding sources, both with and without the TIF infrastructure project.
Envisioning a TIF district that, in terms of geographic extent and designated revenues, will generate incremental revenues sufficient to cover the TIF portion of project costs. If TIF is the only, or primary, funding source, TIF revenue might need to cover debt service for the proposed infrastructure project.
Note: Given the uncertainty and risk associated with estimating future revenues, "sufficient" from the lenders' perspective probably means identification of incremental revenue well in excess of projected debt service requirements. Sometimes, jurisdictions will create a special assessment district to "backstop" a TIF in the event that future tax revenues do not increase as much as anticipated. This reduces the risks for bond holders or other lenders and thereby reduces risk-related interest charges even if a special assessment is never actually levied.
Actual legislative enactment of a TIF district:
Identification of boundaries
Identification of tax revenues to be benchmarked
Identification of the project funds or financing
Duration and termination of the TIF district. (Termination usually occurs upon project completion or retirement of the project financing.)
A strategy to dissolve the TIF once the improvements are funded and debt is retired.
The key issues to be discussed below:
Are the key TIF assumptions valid? If not, what are the implications? (See sections 2.3 and 5.1)
How are the boundaries of a TIF district determined? (See sections 5.2 through 5.5)
Which tax revenue sources are benchmarked and subject to the segregation of incremental revenue? (See section 5.5)
TIF is referred to in a variety of ways throughout the country:
California: Enhanced infrastructure finance district
Florida: Community reinvestment area
Georgia: Tax allocation district (TAD)
New Jersey: Economic redevelopment and growth grant
North Carolina: Project development financing
Pennsylvania: Transportation reinvestment district
Texas: Tax increment reinvestment zone
Despite their different names and different legal requirements, TIFs often adhere to a similar structure and function, regardless of geography.24 Even so, State and local laws determine the actual manifestation and operation of TIF in particular places.
As mentioned above, TIFs were initially intended to promote development in blighted areas.25 As a result, most TIF authorizing statutes require that the implementing jurisdiction make a finding of "blight" or "distress" as a pre-condition to the creation of a TIF mechanism.26
Where a finding of blight is required, blight is defined by that State's TIF enabling statute. Identifying blight often includes one or more of the following characteristics applied either to individual properties or to neighborhoods:27
Age of buildings
Dilapidation
Obsolescence
Excessive vacancies
Deleterious land use or layout
Depreciation of physical assets/lack of maintenance
Lack of necessary transportation infrastructure
Static or declining land values
The degree to which TIFs have succeeded in reducing blight varies:
Studies also indicate that TIF's impact on economic activity is mixed:
Many recent findings show that TIF does little to deliver economic growth and sometimes simply relocates economic activity that would have occurred elsewhere without TIF.28
The "relocation" of growth should not be dismissed out of hand as being of no consequence. If growth is relocated from a greenfield site to an urban infill location, this could help preserve agriculture, reduce increases in air and water pollution, provide access to services and employment for underserved populations, and accommodate new development with less new infrastructure, thereby saving taxpayers money in the long run. On the other hand, if growth is relocated from an urban infill site to the urban fringe, the opposite impacts might occur.29
A study of TIFs in Wisconsin found that mid-size, growing communities were more likely to utilize TIFs than larger, economically stagnant communities. The implications are that suburban communities might be using TIFs to attract private development, raising the possibility that TIF incentives might be luring development away from the larger central cities, thereby depressing growth, economic activity, and property values in the central cities.30
In addition, to the extent that TIFs are used by different jurisdictions to lure a specific new development (e.g., the relocation of a large corporate headquarters) and each city attempts to outdo the other with the size of their "incentives," then TIFs could become a race to the bottom. In such a situation, the public sector could be impoverished for the sake of a ribbon-cutting ceremony and bragging rights for economic development officials.31
Regarding the development or redevelopment of blighted areas, jurisdictions are learning the importance of determining whether development is being done by, for, or to those who now live and work in these areas.32 Going forward, applying an "equity" lens to TIF decision making could be important as long as doing so is not prohibited by the enabling legislation.33
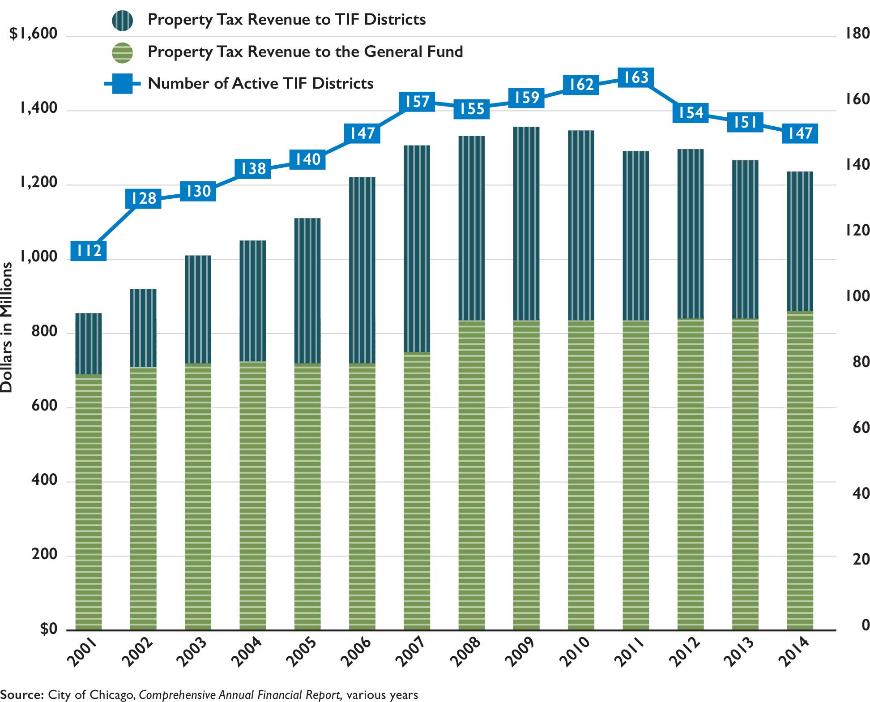
As mentioned above, the TIF concept is very appealing because its assumptions create the appearance that infrastructure projects or developer subsidies can be provided without competing for funds with other projects or programs, and without any requirement to increase tax rates. Not surprisingly, the use of TIFs has expanded greatly. For example, the number of TIF districts in Chicago increased from 28 in 1994 to 163 in 2011, before decreasing slightly to 147 in 2014. Figure 4 shows the growth in the number of Chicago's TIF districts and the amount of revenue generated by those districts from 2001 to 2014. In 2011, the 163 active TIF districts occupied 30 percent of Chicago's taxable land.34 In 2020, Chicago's TIF districts were receiving $850 million in annual revenue. Similar expansions of TIF activity have occurred in other States as well.35
Figure 4. Number of active TIF districts in Chicago and property tax revenue directed to TIFs and to Chicago's general fund by fiscal year.36
18 Community Redevelopment Agencies Annual Report, 24th edition, for Fiscal Year 2008. Sept 30, 2009. The Community Redevelopment Law, Chapter 710, Statutes of 1951, was enacted by the California State Legislature with the objective of redeveloping those areas in many communities that, for a variety of reasons, suffer from unsafe, unfit, deteriorated, and economically dislocated buildings and properties. The California Constitution, Article XVI, section 16, and the Health and Safety Code, beginning with section 33000, provide funding from local property taxes to promote the redevelopment of blighted areas. Voters approved Article XVI in 1952; therefore, the revenues it generates are not subject to the limitations imposed by Article XIIIB, the Gann Limit (also known as Proposition 13). See https://web.archive.org/web/20100105093005/http://www.sco.ca.gov/Files-ARD-Local/LocRep/redevelop_fy0708redev_reports.pdf.
19 Mattson, Gary A. 2004. Tax Increment Financing in Encyclopedia of the City. Roger W. Caves, Ed. pp. 659–660.
20 Source: USDOT. The key to this graphic is that revenues increase after TIF creation, not because of higher tax rates, but because of increased development and economic activity that are subject to the existing tax rates.
21 Source: USDOT.
22 Source: USDOT.
23 Scheider, Benjamin. 2019, October 24. City Lab University: Tax Increment Financing. https://www.bloomberg.com/news/articles/2019-10-24/the-lowdown-on-tif-the-developer-s-friend.
24 Council of Development Finance Agencies. Tax Increments & Development Finance. https://www.cdfa.net/cdfa/cdfaweb.nsf/pages/Tax-Increment-Finance.html.
25 Mattson, Gary A. 2004. Tax Increment Financing in Encyclopedia of the City. Roger W. Caves, Ed. pp. 659–660.
26 Scheider, Benjamin. 2019, October 24. City Lab University: Tax Increment Financing. https://www.bloomberg.com/news/articles/2019-10-24/the-lowdown-on-tif-the-developer-s-friend.
27 Port of Port Royal Redevelopment. 2011. Tax Increment Financing Plan. http://properties.cbre.us/port-royal/assets/tax-increment-financing-presentation-(final).pdf.
28 Merriman, David. 2018. Improving Tax Increment Financing (TIF) for Economic Development. Lincoln Institute of Land Policy. p. 4. https://taxpayersci.org/wp-content/uploads/TIF_Lincoln-Institute_2018.pdf.
29 Rybeck, Rick. October 2019. Avoiding misgivings: Recycling community-created land values for affordability, sustainability and equity. Journal of Affordable Housing and Community Development Law, 28(2), p. 299, see footnote 14 on p. 303.
30 Public Policy Forum. 2009, July. Too Much or Not Enough? A Statistical Analysis of Tax Incremental Financing in Wisconsin. Research Brief. p. 10. http://www.mounthorebwi.info/wp-content/uploads/2014/05/2009TIFBrief.pdf.
31 Scheider, Benjamin. 2019, October 24. City Lab University: Tax Increment Financing. https://www.bloomberg.com/news/articles/2019-10-24/the-lowdown-on-tif-the-developer-s-friend.
32 Treuhaft, Sarah. 2016, July 20. Embedding Equity into Economic Development. ShelterForce. https://shelterforce.org/2016/07/20/embedding-equity-into-economic-development/.
33 The author is not aware of any such prohibitions. However, should they exist, they could be an appropriate subject for revision and amendment.
34 City of Chicago TIF Reform Panel. 2011, August 23. Findings and Recommendations for Reforming the Use of Tax Increment Financing in Chicago: Creating Greater Efficiency, Transparency, and Accountability, p. 10. https://www.chicago.gov/content/dam/city/depts/mayor/Press%20Room/Press%20Releases/2011/August/8.29.11TIFReport.pdf.
35 Fisher, Bridget, Flávia Leite, and Lina Moe. 2020, August 20. TIF Case Studies: California and Chicago. Schwartz Center for Economic Policy Analysis, The New School. https://www.economicpolicyresearch.org/insights-blog/tif-case-studies-california-and-chicago.
36 Source: USDOT, based on the City of Chicago's Comprehensive Annual Financial Reports, various years, https://www.chicago.gov/city/en/depts/fin/supp_info/comprehensive_annualfinancialstatements.html. Number of TIF districts by year obtained from Chicago Data Portal, TIF Status and Eligibility, https://data.cityofchicago.org/Community-Economic-Development/TIF-Status-and-Eligibility/3qsz-jemf/data.