


TABLE OF CONTENTS
LIST OF FIGURES
LIST OF TABLES
In the short term, economic shocks like the GFC that began in 2008 and COVID-19 which began in 2020, can lead to disruptions to economies at the local, State, and national levels. These disruptions can affect the revenue collected through funding techniques based on value capture. However, the change in revenue collected depends on the nature of the shock and its interplay with the key revenue drivers of the value capture technique. For example, during the Pandemic, while some aspects of the economy saw significant drops, other aspects like online retail, home improvement, and the residential housing market could have been classified as “booming.” Furthermore, the impact of these shocks may be influenced by the types of national and State monetary and fiscal stimulus measures that policymakers undertake, because such measures can benefit some real estate sectors more than others. For instance, low interest rates have been one factor why the residential housing market has benefitted during the Pandemic. The following section discusses possible impacts to be expected during an economic shock that are relevant for value capture techniques.
Projects funded using value capture techniques are inherently subject to cycles and volatility of the real estate market. Many value capture techniques rely on growth in real estate values to fund infrastructure projects. When segments of the real estate market wax and wane, so too does the funding available through value capture techniques applied to that market segment. COVID-19 is one example of such economic shocks, affecting the private and public office market and, to a lesser extent, the housing market. While at writing COVID-19 continues to be a major public health issue, it has already had an enormous impact on in the way people use office spaces and may affect the demand for such spaces in the future, with work from becoming a norm for certain types of employees and a “hybrid” work week an expected outcome of COVID-19, at least in the short-term. Appendix 2 explores COVID-19’s impacts in greater detail especially on the office market, including how different categories of employees will be affected and residential location patterns.
Economic shocks like COVID-19 and the GFC generally affect the broader economy and often specifically the real estate market. While economic shocks vary, they can lead to reduced value capture revenues, driven by several factors, such as:
How a value capture source will be affected by an economic shock will be determined by the nature of the economic shock. For example, during the GFC the residential real estate subsector was extraordinarily impacted declining by over 1,200,000 housing starts during the recession to around 500,000 at its worst. Housing start production did not return to pre-GFC levels until five years later. During the Pandemic, however, housing starts declined from 1,600,000 to 1,000,000, recovering within a year.11
During an economic shock, property values may not appreciate as quickly and, in some instances, may lose value. The slower rate of appreciation or even depreciation will vary by type of shock, as well as property type. For example, the 2008 GFC led to a downturn across real estate asset classes–office, retail, industrial, multifamily, and residential.12 In contrast, COVID-19 has led to an appreciation in some segments of the residential market and a depreciation in other segments of the commercial market. During the first year of the Pandemic, the office space segment experienced a downturn as more white-collar employees opted to work from home, while the industrial segment, which includes warehouses, saw an increase due to increased demand for such spaces to accommodate the rise of e-commerce.13
The value capture techniques of tax increment financing (TIF), special assessments, and joint development would likely be most impacted by swings in property value appreciation. TIF rests on the concept that improved infrastructure assets in a district will lead to higher property values–appreciation–in that district, an assumption is supported by research demonstrating that this is usually the case, but not always immediately. However, even the best-laid analyses cannot predict every shock. During the GFC, properties within the Atlanta BeltLine’s TIF (tax allocation district) did not appreciate as much or as quickly as forecast. As a result, the project saw a significant funding gap, as discussed in Appendix 1. Figure 1 shows how an economic shock negatively affects growth in appraised value. Similarly, special assessments on property values could decrease an economic shock. Finally, joint development projects funded with real estate revenues could also see decreased revenues or be delayed.
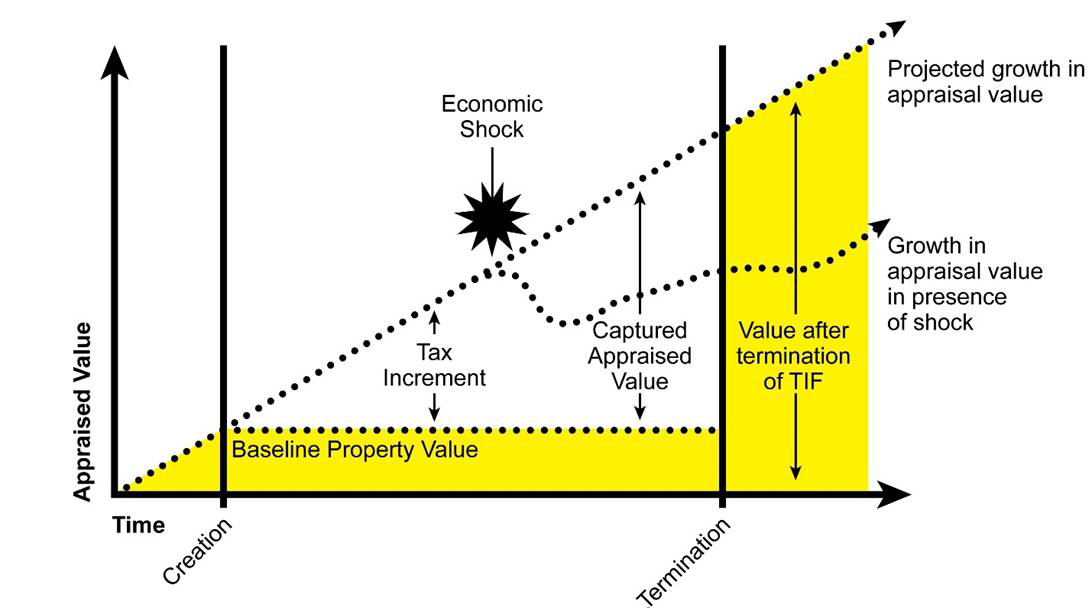
Figure 1 . Economic Shock Impacts on Tax Increment Financing
Since special assessment fees are tied to a property’s value, these fees may decline during an economic shock. While in many cases, fees levied in special assessments are tied to a property’s square footage, there are instances of special assessments calculated on an ad valorem basis, i.e., tied to the property value. In the case of the Mosaic District in Virginia, as discussed in Appendix 1, the assessed value of the properties in the district slightly declined in 2020 due to the Pandemic. If the special assessment mechanism in that transaction were utilized–although it was not–then the available monies would have been less than projected.
Another possibility during an economic shock is that it may be more difficult to levy new special assessments. This risk may be stronger in jurisdictions such as Oregon and Washington, where the creation of a SAD (locally as a “local improvement district”) is more grassroots-driven, i.e., formed on initiative of a group of landowners, and requiring approval of a majority of affected landowners. During an economic shock, these property owners could have hesitations about creating a district that levies new fees. In the case of jurisdictions like Georgia, where the creation of a SAD is initiated by local government–and not property owners–the risk that such a district could not be created may be lower–though it still exists. The Atlanta City Council approved a type of SAD (locally called a special services district) in 2021 while COVID-19 had a major impact on local businesses. The BeltLine SAD managed to pass a City Council vote even though some of these local businesses were opposed to it since they stated that the COVID-19 Â pandemic was still adversely affecting their businesses.14
Impact fees may decline or may even be suspended during economic shocks, because they are tied to new development. During an economic shock, new development can slow significantly. One indicator of new development is “housing starts data,” the number of new residential construction projects that began on a monthly basis. As Figure 2 shows, during recessions such as the GFC, which began in 2008, new housing starts can decline significantly. In this situation, municipalities that rely on impact fees to fund their infrastructure could face shortfalls in fees they were initially projected to receive. An example is in Osceola, Florida, during the economic slowdown between the years 2008 and 2012 and profiled in Box 1.
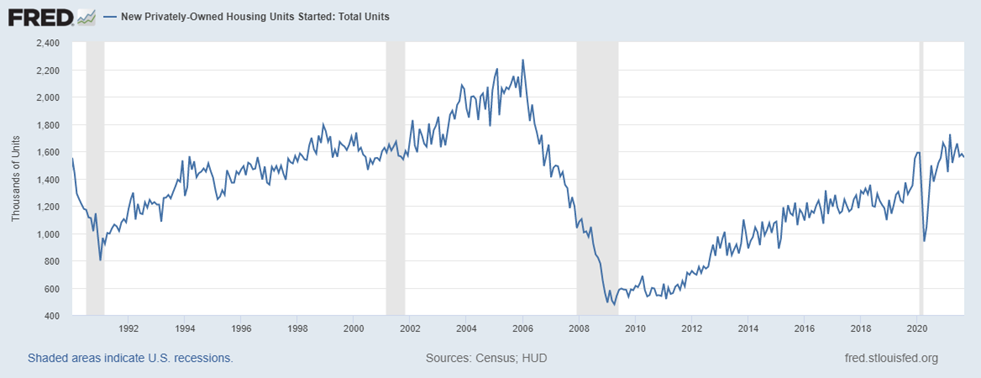
Figure 2 . New Privately-Owned Housing Units Started, 1990-202115
Box 1: Osceola County’s Suspension of Impact Fees Due to Economic Slowdown16
Osceola County, FL implemented transportation impact fees in 1990 to address rapid growth in the county that had led to severe traffic issues and citizen frustration. The fees sought to facilitate construction of key bridge and roadway infrastructure. In response to an economic slowdown, the fees were suspended in 2011 and repealed in 2012.
In 2015, as growth picked up, the fees were re-implemented under the name “mobility fees,” and changes were made to allow for faster collection. In their initial form, transportation impact fees were collected once a building was occupied. The new mobility fees were collected when a building permit was issued. Therefore, governments could make roadway improvements before the arrival of new traffic. As the county's economy improved, mobility fees also increased. Between 2017 and 2018, single-family home mobility fees increased from $4,585 to $8,671 and multifamily mobility fees increased from $3,203 per unit to $6,058 per unit.
Correlated with retail sales, sales taxes often decline during an economic shock. Sales tax declines caused by an economic shock can negatively affect the revenues collected within a sales tax district created to help fund the transportation asset. This was the case in the “Starter Line Transportation Development District (TDD)” to fund the Kansas City streetcar (KC Streetcar). The sales tax of 1 percent was applied to all applicable retail sales within the TDD’s boundaries.17 As shown in Figure 3, after several years of growth, receipts fell by 49 percent from 2019 to 2020, the year the Pandemic hit. While sales taxes fell across the U.S. in 2020, it is possible that the areas like the TDD was more negatively impacted than others, as it is home to bars, restaurants, theaters, and music venues, retail very much affected by Pandemic-imposed social distancing and quarantining measures.
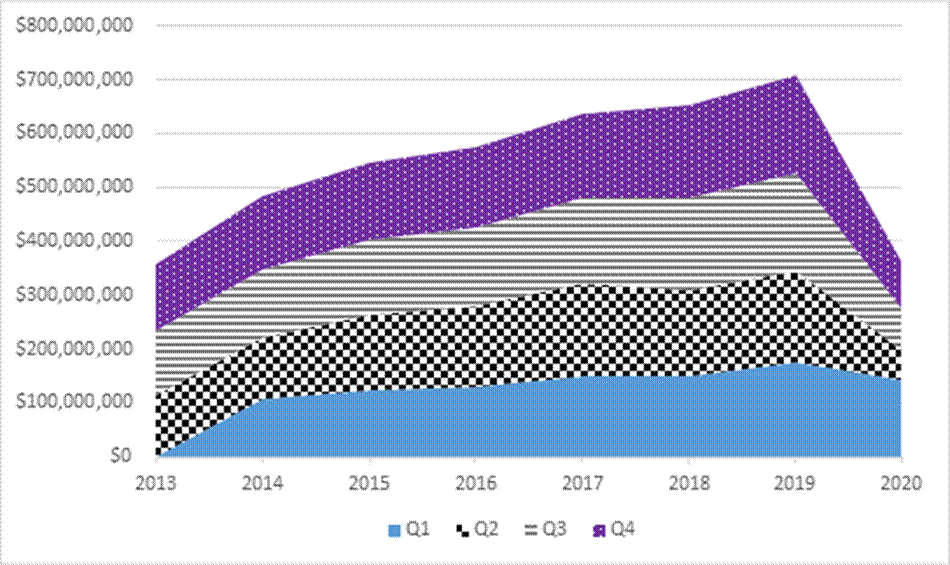
Figure 3. Volume of Taxable Sales in the KC Streetcar's Starter Line Transportation Development District18
Patterns of sales tax receipts vary by region and district, however. When looking at the U.S. as a whole, State and local sales taxes saw a significant decline in 2020 Q2 compared to 2019 Q2. By Q3, revenue from they had rebounded, as reflected in Table 4. However, as shown in the KC Streetcar, this sales tax growth at the national level masks different dynamics playing out at local levels. As discussed, the KC Streetcar runs through a downtown district replete with theaters, restaurants, and other amenities that require foot traffic to generate sales. COVID-19 forced several lockdowns and stay-at-home orders, which depressed foot traffic. In contrast, areas reliant on sales tax revenues from large purchases may have seen a quicker rebound as people focused on home improvement projects or bought cars as anecdotal evidence suggests.
| 2019 | 2020 | % Change | |
|---|---|---|---|
| Q1 | 107,482 | 111,597 | 4% |
| Q2 | 107,936 | 96,129 | -11% |
| Q3 | 111,478 | 113,342 | 2% |
| Q4 | 110,846 | 115,892 | 5% |
Demand for naming rights may decline as corporations and large institutions cut back on branding and marketing budgets. This was the case during the GFC when, according to one naming rights expert, the market was quiet. However, the COVID-19 economic shock has not led to lower naming rights demand. On the contrary, given that several parts of the economy are booming, naming rights deals are still very possible, with several new players–including firms in the cryptocurrency sector and home lenders (driven by lower interest rates) are very active.20
With reduced funding available, public agencies may not be able to complete projects funded with value capture monies. This could particularly affect TIF districts dependent on growth in assessed property values. The Atlanta BeltLine case, featured in Appendix 1, experienced such a scenario in the mid-2010s after the GFC limited the property appreciation in the TIF district established for the project. Forecasted revenues failed to materialize at expected levels, and the project had difficulty progressing. The Pandemic has also shown the fragility of tax bases–often commercial real estate–for special assessment districts. For example, in New York City, the assessed value of office buildings declined by 16.6 percent in fiscal year 2021, resulting in a loss of $850M in property taxes.21 Furthermore, with a bit less than one-third of Manhattan building leases expiring by 2024, New York City and other cities with similar large office markets may see dramatic losses of property tax revenue.22
A decline in value capture revenues, such as through tax increment financing districts or special assessments, could mean that projects may not be able to meet their debt service requirements. The Atlanta BeltLine case, featured in Appendix 1, always managed to service its bond debt. However, it struggled to honor some of its other obligations after the GFC, namely the ‘Payments-in-lieu-of-Taxes’ (PILOT) it owed to the Atlanta Public School (APS) system. Ultimately, it was forced to renegotiate these PILOT payments.The lack of funding could affect the public agency’s ability to secure financing from lenders. Again, the Atlanta BeltLine case (Appendix 1) illustrates this case. In the mid-2010s when the project’s TIF-related revenues failed to materialize at the initial levels projected, the project did not have enough debt capacity to issue more bonds using the TIF revenues as a pledge. Ultimately, a negotiated reduction in the PILOT payments to the APS gave the project the “breathing space” it needed to issue more debt and move forward.
On the flipside, lenders themselves may struggle during economic crises and pull back support. For example, the construction of the second to fourth phases of the Colorado E-470 toll road became more difficult when a lender pulled back support: “in October 1990, UBS withdrew its April 1990 proposal to provide letter of credit financing for the remaining tollway segments due to the Persian Gulf crisis, international economic crises, and the savings and loan crisis.”23 The project was eventually built after several delays.
With reduced prospects for value capture funding and/or increased value capture volatility, public agencies may not be able to or choose not to fund these projects. Even in good economic times, many projects fail to get off the ground due to funding scarcity. For example, Moynihan Train Hall, which is an expansion of Penn Station in New York City, and which opened to much fanfare during COVID-19, had previously failed due to lack of funding, among other issues. With the fiscal resource constraints faced by public agencies during times of economic stress, it is likely that those projects with unidentified funding sources or with less support will fail to get off the ground during economic shocks.
When value capture related revenues are volatile or less than expected due to economic shocks, public agencies and project sponsors may opt to pay for the projects or maintenance as they go. To some extent, this phasing occurred in the Colorado E-470 toll road example and the Atlanta BeltLine. In times of economic stress when value capture sources like TIFs and SADs are more volatile, local governments could consider fee-based value capture sources, such as TUFs, where applicable. TUFs are typically invoiced in conjunction with water bills, which most people will pay for fear of losing access to their water. As a result, they have strong payment records in times of economic shocks and can provide a source of ongoing funding for operations and maintenance of road and local transportation infrastructure.
11 U.S. Census Bureau and U.S. Department of Housing and Urban Development, New Privately-Owned Housing Units Started: Total Units.
12“Comparing this Commercial Real Estate Recovery to the Great Recession,” The Private Bank, March 2021. https://www.wellsfargo.com/the-private-bank/insights/ream-cre-recovery/
13Ibid.
14Kelley, Colin. “Small Business Owners Urge Delay in BeltLine Tax District During Community Meeting,” January 29, 2021. Atlanta In Town. January 29, 2021, https://reporternewspapers.net/2021/01/29/small-business-owners-urge-delay-in-beltline-tax-district-during-community-meeting/.
15 U.S. Census Bureau and U.S. Department of Housing and Urban Development, New Privately-Owned Housing Units Started: Total Units.
16FHWA, Value Capture Implementation Manual, 2019, “Example 1: Osceola County Roadway and Bridge Program.” McBride, Brian, “Mobility Fees for Osceola Developers Nearly Double,” Osceola News-Gazette, January 12, 2018.
17Kansas City Streetcar Authority, “The Kansas City Main Street Rail Transportation Development District,” https://kcstreetcar.org/wp-content/uploads/2021/05/Final-TDD-2021.pdf.
18 Sales tax data from: Missouri Department of Revenue, Taxation Division, Taxable Sales and Use Tax by Locality – Taxable Sales for All Districts (2013 - 2021).
19Sales tax data from: Fiscal Conditions During the COVID-19 Pandemic in Selected States. Government Accountability Office, GAO-21-562, p. 2, https://www.gao.gov/assets/gao-21-562.pdf.
20Private consultant, personal communication, October 25, 2021.
21Office of the New York State Comptroller, Thomas P. DiNapoli, “More Than $850 Million in Property Taxes Lost in FY 2022,” Press release, October 7, 2021, https://www.osc.state.ny.us/press/releases/2021/10/dinapoli-nyc-office-market-will-take-years-recover-pandemic.
22Hong, Nicole, and Matthew Haag, “Why Co-Working Spaces Are Betting on the Suburbs,” New York Times, Oct 28, 2021, https://www.nytimes.com/2021/10/28/nyregion/co-working-space-suburbs.html
23 “FHWA, Colorado E-470 Toll Road and Vehicle Registration Fees,” https://www.fhwa.dot.gov/ipd/value_capture/case_studies/colorado_e470_toll_road_and_vehicle_registration_fees.aspx