U.S. Department of Transportation
Federal Highway Administration
1200 New Jersey Avenue, SE
Washington, DC 20590
202-366-4000
Federal Highway Administration Research and Technology
Coordinating, Developing, and Delivering Highway Transportation Innovations
 | REPORT |  |
| This report is an archived publication and may contain dated technical, contact, and link information |
|
| Publication Number: FHWA-HRT-10-077 Date: July 2013 |
Publication Number: FHWA-HRT-10-077 Date: July 2013 |
A GRS mass is a soil mass that is embedded with layers of geosynthetic reinforcement. These layers are typically placed horizontally with a vertical spacing of 8 to 12 inches (200 to 300 mm). Under vertical loads, a GRS mass exhibits significantly higher stiffness and strength than an unreinforced soil mass. This chapter presents a review of previous studies on the mechanics of reinforced soil, the composite behavior of a GRS mass, and CIS in a reinforced soil mass.
2.1 MECHANICS OF REINFORCED SOIL
In literature, three concepts have been proposed to explain the mechanical behavior of a GRS mass: (1) the concept of enhanced confining pressure, (2) the concept of enhanced material properties, and (3) the concept of reduced normal strains. (See references 21–32.)
The mechanics of a GRS mass have been explained by Schlosser and Long and Yang using two concepts: the concept of apparent cohesion and the concept of apparent confining pressure.(25,21)
In this concept, a reinforced soil is said to increase the major principle stress at failure from σ1 to σ1R (with an apparent cohesion C'R) due to the presence of the reinforcement, as shown by the Mohr stress diagram in figure 3. If a series of triaxial tests on unreinforced and reinforced soil elements were conducted, the failure envelopes of the unreinforced and reinforced soils would allow the apparent cohesion C'R to be determined. Yang indicated that the Φ value for unreinforced sand and reinforced sand were about the same as long as slippage at the soil-reinforcement interface did not occur.(21)
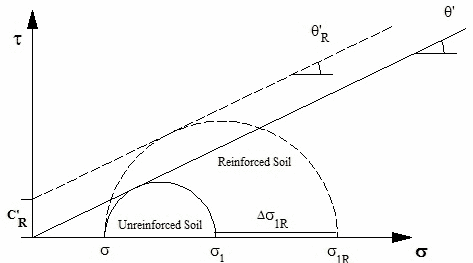
Figure 3. Illustration. Concept of apparent cohesion due to the presence of reinforcement
In this concept, a reinforced soil is said to increase its axial strength from σ1 to σ1R (with an increase of confining pressure, Δσ3R), as shown in figure 4, due to the tensile inclusion. The value of Δσ3R can also be determined from a series of triaxial tests by assuming that Φ will remain the same.
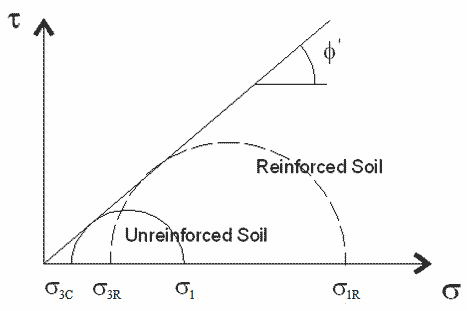
Figure 4. Illustration. Concept of apparent confining pressure due to the presence of reinforcement
Note that the concept of apparent confining pressure allows the apparent cohesion to be determined with only the strength data for the unreinforced soil, as shown in figure 5 through figure 13.(25)
Consider a GRS mass with equally spaced reinforcement of strength Tf and vertical spacing Sv. It is assumed that the increase in confining pressure due to the tensile inclusion, Δσ3R, can be calculated using the equation in figure 5.
![]()
Figure 5. Equation. Increase in confining pressure as a function of reinforcement strength and spacing
From figure 3 and figure 4 and using Rankine’s Earth pressure theory to equate the principal stress at failure, σ1R can be calculated using figure 6.
![]()
Figure 6. Equation. Principle stress at failure for reinforced soil
![]()
Figure 7. Equation. Principle stress at failure for reinforced soil with zero cohesion
![]()
Figure 8. Equation. Total confining stress of reinforced soil
Using figure 8, figure 7 can be written as figure 9.
![]()
Figure 9. Equation. Principle stress at failure for reinforced soil substituting the components derived in Figure 8
Equating figure 6 to figure 9, figure 10 is obtained.
![]()
Figure 10. Equation. Apparent cohesion for reinforced soil in terms of increase in confining stress
Substituting figure 5 into figure 10 results in figure 11.

Figure 11. Equation. Apparent cohesion in terms of reinforcement strength and spacing
Figure 11 may be useful for evaluating the stability of a reinforced soil mass. Given a granular soil with strength parameters c (c = 0) and Φ, figure 11 allows the strength parameters of a reinforced soil mass (c'R and ΦR) to be determined as a function of T and Sv.
It should be noted that the validity of figure 11 is questionable. There is a key assumption involved in the derivation—the assumption of figure 5, which implies that an increase in Tf has the same effect as a proportional decrease in Sv.
Note that figure 12 represents the increase in confining pressure based on the explanation given by Schlosser and Long and Yang (see figure 4), while figure 13 represents the same increase in Hausmann’s study, where RT ≡ Tf.(22,25,26)
![]()
Figure 12. Equation. Increase of confining pressure due to reinforcement
![]()
Figure 13. Equation. Increase of confining pressure by Hausmann(26)
2.2 COMPOSITE BEHAVIOR OF GRS MASS
The behavior of GSGC has been investigated through different types of laboratory experiments including small-size (1.9-inch (50-mm)-diameter) triaxial compression tests with a specimen diameter no greater than 6 inches (150 mm), large-size (19-inch (500-mm)-diameter) triaxial compression tests, large-size (30-inch (760-mm)-diameter) unconfined compression tests, unconfined compression tests with cubical specimens, and plane-strain tests. (See references 6, 7, 20, 31, and 33–35.)
The effects of reinforcement layers on the stiffness and strength of GSGCs has been investigated, and the results suggest that unless the reinforcement is placed at locations where lateral deformation of the soil occurs, there will not be any reinforcing effect.(33)
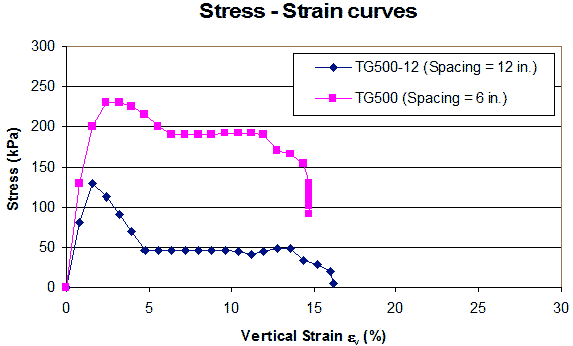
There are questions concerning the applicability of these small-size triaxial tests because the reinforcement in these tests is very small compared to the typical field installation, and factors such as gravity, soil arching, and CIS are not simulated properly. For these reasons, several larger triaxial tests and plane-strain tests have been conducted. Elton and Patawaran conducted seven unconfined compression tests on 2.5-ft (0.76-m)-diameter and 5-ft (1.53-m)-high specimens with different types of reinforcement and spacing (see figure 14 and figure 15).(31) Six types of reinforcement were used in the tests with spacing of 6 and 12 inches (150 and 300 mm). Figure 16 shows the stress-strain curves of the specimens reinforced by Tensar® TG500 at spacings of 6 and 12 inches (150 and 300 mm). As shown in the figure, the strength of the GSGC was much higher at the 6-inch (150-mm) spacing than at the 12-inch (300-mm) spacing.
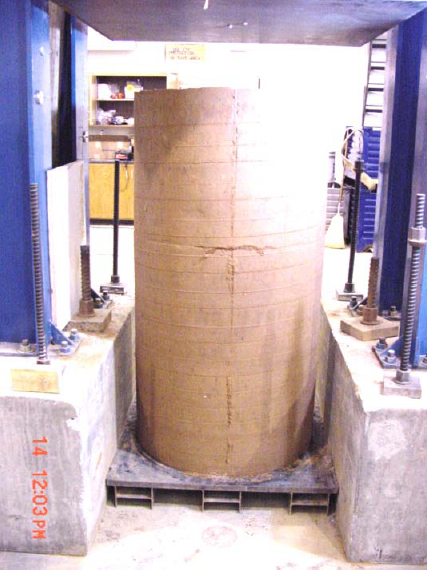
Figure 14. Photo. Unconfined test specimen before testing(31)
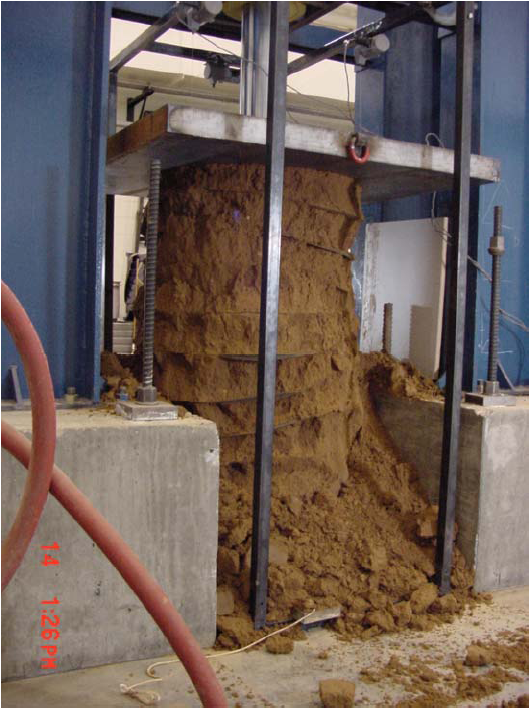
Figure 15. Photo. Unconfined test specimen after testing(31)
1 kPa = 0.145 psi
1 mm = 0.039 inches
Figure 16. Graph. Stress-strain curves of specimens reinforced at spacings of 6 and 12 inches (150 and 300 mm) in large, unconfined compression test (31)
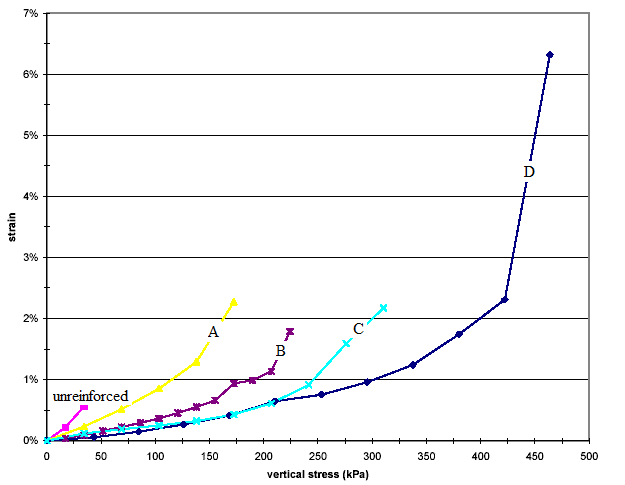
Five unconfined mini-pier experiments were conducted by Adams and his associates.(6,7) The dimensions of the specimen were 6.6 ft (2.0 m) high, 3.3 ft (1.0 m) wide, and 3.3 ft (1.0 m) deep. The test results showed that the load-carrying capacity was strongly affected by the spacing of the reinforcement and was not significantly affected by the strength of the reinforcement. Figure 17 shows a photo of the mini-pier experiment, and table 1 shows the material properties and conditions for the tests. The stress-strain curves from the tests are presented in figure 18. The effect of reinforcement spacing and reinforcement strength on the behavior of the mini-piers can be seen in the figure by comparing the difference between curve B (at 1.3-ft (0.4-m) spacing) and curve D (at 0.7-ft (0.2-m) spacing) and the difference between curve C (reinforcement strength = 1.4 kip/ft (21 kN/m)) and curve D (reinforcement strength = 4.8 kip/ft (70 kN/m)). The effect of reinforcement spacing is much more pronounced than the effect of reinforcement strength.
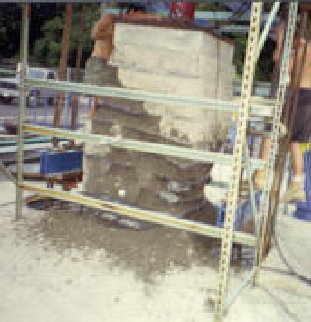
Figure 17. Photo. Mini-pier experiments. (6)
Table 1. Properties of materials for the mini-pier experiments.(7)
| Experiment |
Fill Average Density (kN/m3) |
Geotextile Reinforcement Schedule | ||
| Polypropylene Type | Strength (kN/m) | Spacing (m) |
||
| MP NR | 22.4 | None | None | None |
| MP A | 23.0 | A2044 | 70.0 | 0.4–0.6 |
| MP B | 22.7 | A2044 | 70.0 | 0.4 |
| MP C | N/A | A2000 | 21.0 | 0.2 |
| MP D | 22.8 | A2044 | 70.0 | 0.2 |
| MP NR | 22.4 | None | None | None |
|
MP = Mini-pier and NR = Not reinforced. |
||||
1 kPa = 0.145 psi
Figure 18. Graph. Stress-strain curves of mini-pier experiments.(7)
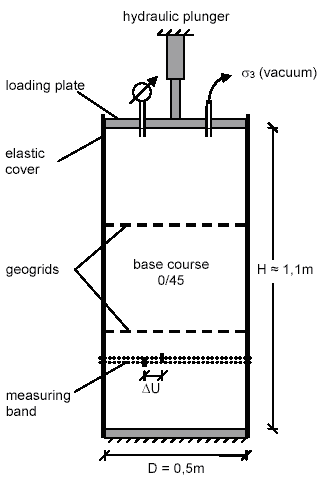
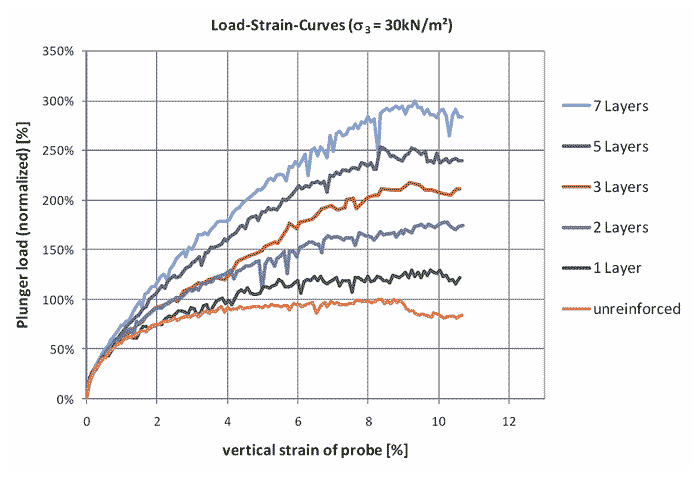
Figure 19 and figure 20 show the setup of the large-size triaxial tests conducted by Ziegler et al.(35) The specimens were 1.6 ft (0.5 m) in diameter and 3.6 ft (1.1 m) high. The results also show the behavior of the GRS specimens was strongly affected by reinforcement spacing. Figure 21 shows the relationship between the applied loads and vertical strains of the test specimens. The strength of the specimen increased with an increasing number of reinforcement layers. The stiffness of the specimen also increased with an increasing number of reinforcement layers for strains of more than about 1 percent. Below 1 percent, the stiffness was not affected by the reinforcement layers.
1 m = 3.28 ft
Figure 19. Illustration. Schematic of large-size triaxial tests with specimens 3.6 ft
(1.1 m) high and 1.6 ft (0.5 m) in diameter.(35)
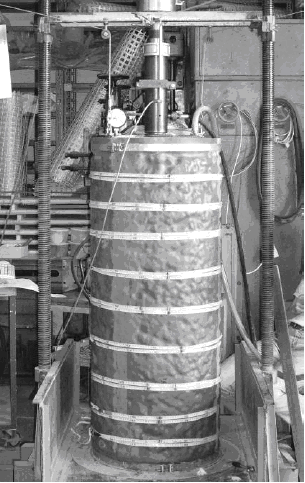
Figure 20. Photo. Setup of large-size triaxial tests with specimens 3.6 ft (1.1 m) high and 1.6 ft (0.5 m) in diameter.(35)
1 kN/m2 = 0.021 kip/ft2
Figure 21. Graph. Large-size triaxial test results.(35)
The behavior of GSGCs has also been investigated through numerical analysis. (See references 20 and 36–40.)
Vulova and Leshchinsky conducted a series of analyses using the two-dimensional (2D) finite difference program Fast Lagrangian Analysis of Continua (FLAC) Version 3.40.(40,41) From the analyses, it was concluded that reinforcement spacing was a major factor controlling the behavior of GRS walls. The analysis of GRS walls with reinforcement spacing from 0.7 to 3.3 ft (0.2 to 1.0 m) showed that the critical wall height (defined as a general characteristic of wall stability) always increased when reinforcement spacing decreased. Reinforcement spacing also controlled the mode of failure of GRS walls. In these analyses, CIS in soil was not included.
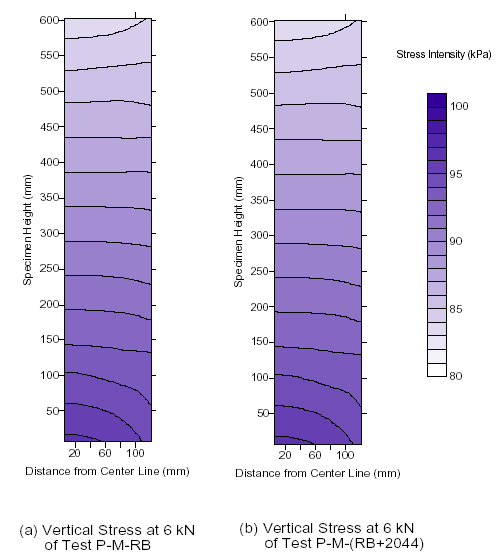
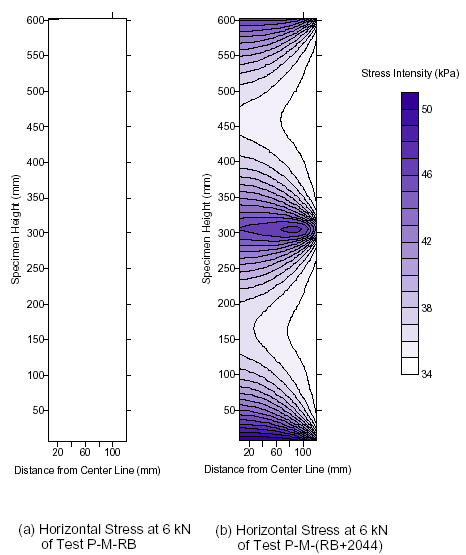
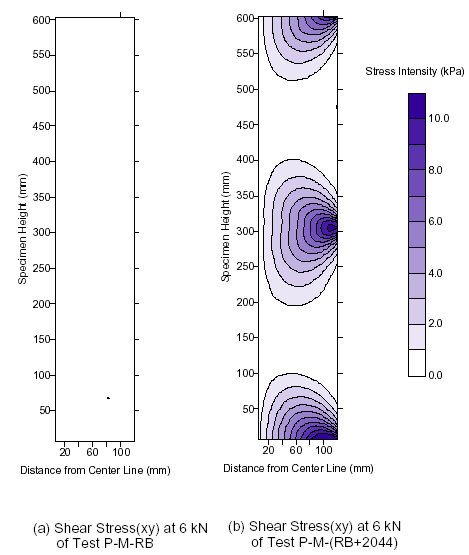
Comparisons of the stress distribution in a soil mass with and without reinforcement were made by Ketchart and Wu.(20) The reinforcement was a medium-strength woven geotextile with wide-width strength of 4.8 kip/ft (70 kN/m). The backfill was a compacted road base material, and the reinforcement spacing was 1 ft (0.3 m). Figure 22, figure 23, and figure 24 show the vertical, horizontal, and shear stress distributions, respectively, at a vertical load of 1.3 kip (6 kN). The presence of the reinforcement layers in the soil mass altered the horizontal and shear stress distributions but not the vertical stress distribution. The horizontal and shear stresses increased significantly near the reinforcement. The largest stresses occurred near the reinforcement and reduced with increasing distance from the reinforcement. The extent of appreciable influence was only about 0.33–0.49 ft (0.1–0.15 m) from the reinforcement. With the increased lateral stress, the stiffness and strength of the soil became larger. Ketchart and Wu emphasized the importance of keeping reinforcement spacing less than 1 ft (0.3 m) for GRS walls.
1 kPa = 0.145 psi
1 mm = 0.039 inches
Figure 22. Graph. Vertical stress distributions at 1.3-kip (6-kN) vertical load of the GRS masses without and with reinforcement.(20)
1 kPa = 0.145 psi
1 mm = 0.039 inches
Figure 23. Graph. Horizontal stress distribution at 1.3-kip (6-kN) vertical load of the GRS masses without and with reinforcement.(20)
1 kPa = 0.145 psi
1 mm = 0.039 inches
Figure 24. Graph. Shear stress distribution at 1.3-kip (6-kN) vertical load of the GRS masses without and with reinforcement.(20)
2.3 CIS IN AN UNREINFORCED SOIL MASS
Many studies have been conducted to address CIS in a soil mass. As early as 1943, Terzaghi noted that compaction significantly affected lateral Earth pressures.(42) In 1954, Rowe calculated lateral Earth pressures for conditions of wall deflection intermediate between the at-rest, fully active, and fully passive states.(8) Rowe’s work did not directly address CIS, but it contributed to a later study by Broms on compaction-induced Earth pressures.(9) Seed and Seed and Duncan developed a simulation model called the “bi-linear hysteretic loading/unloading model” to simulate the compaction effect on vertical, non-deflecting structures.(11,43) Duncan and Seed and Duncan et al. also developed a procedure to determine lateral Earth pressure due to compaction.(12,13) These studies were considered to have a strong impact on the determination of CIS.
The lateral Earth pressure estimation study by Rowe was not directly related to CIS, but it addressed lateral Earth pressures for conditions of wall deflection between the at-rest, fully active, and fully passive states.(8) Rowe’s stress-strain theory for calculations of lateral pressures exerted on structures by cohesionless soils was based on the following hypotheses:
The basic mechanics of Rowe’s theory are essentially a simple Coulomb analysis of sliding wedges. A sample wedge adjacent to a wall or structure is considered. When the structure deflects, slip strain occurs along planes AB and AC. Assuming no soil compression, slip strain along each plane is calculated as the ratio of shear displacement along the plane to the length of the plane. The forces acting on the typical sliding wedge are the weight of the soil, the force exerted on a sliding wedge by the underlying soil, and the force exerted on the sliding wedge by the wall.
Rowe substantiated his theory by performing a series of direct shear tests on different sands, recording the friction angle developed at various levels of slip strain, and using these values to calculate lateral Earth pressures for sample problems. By considering tamping or compaction as application and removal of surcharge pressure γ ho (γ = unit weight of soil and ho = surcharge head), Rowe postulated that slip strains would be induced by the load application. He suggested that in the compression and shear tests, unloading causes relatively small strain reversals. Thus, after tamping a fill behind a wall, the lateral pressure will be almost as great as the value, which acted under the preconsolidation pressure. From that, the pressure coefficient (K 'o) could be expressed as shown in the equation in figure 25.
![]()
Figure 25. Equation. At-rest Earth pressure coefficient.
Where ho is the surcharge head removed and h is the overburden head (h = σv / γ). In any case, Ko ≤ Kp, where Kp is the coefficient of passive Earth pressure at limiting condition.
It is interesting to note the similarity between Rowe’s early equation for residual compaction-induced lateral Earth pressures and an equation proposed later by Schmidt to explain residual lateral Earth pressures resulting from over-consolidation of soils under conditions of no lateral strain (i.e., the Ko condition).(44) Schmidt’s equation, which empirically allows for some degree of relaxation of lateral stresses following surcharge removal, can be expressed in figure 26.
![]()
Figure 26. Equation. Schmidt’s equation for residual lateral Earth pressures.(44)
Where:
α = 0.3 to 0.5 for most sands.
α = 1.2 sin Φ' for initially normally consolidated clays.
Broms developed a stress path theory to explain residual lateral Earth pressure on rigid, vertical, non-yielding structures resulting either from compaction or surcharge loading that is subsequently removed.(9) The theoretical basis for Broms’ theory is illustrated in figure 27. An element of soil at some depth is considered to exist at some initial stress state represented by point A with horizontal and vertical effective stresses of σ 'ho and σ 'vo. Compaction of the soil is considered a process of loading followed by unloading. When the overburden pressure is increased (i.e., loading), there is little change in lateral pressure until the ratio of lateral to vertical effective stresses is equal to Ko (denoted by point B in figure 27 ), where Ko is the coefficient of Earth pressure at rest. Thereafter, increased vertical stress is accompanied by an increased lateral stress according to figure 28, corresponding to primary (or virgin) loading.
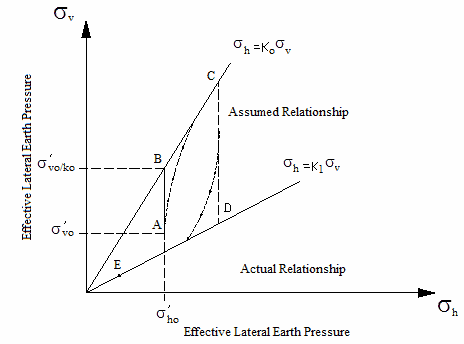
Figure 27. Illustration. Hypothetical stress path during compaction.
![]()
Figure 28. Equation. Lateral Earth pressure at rest.
When the overburden pressure is subsequently decreased (e.g., from point C), the corresponding decrease in lateral pressure is small until the ratio of lateral to vertical effective stresses is equal to some limiting constant K1 (denoted by point D in figure 27). Thereafter, a continued decrease in vertical pressure is accompanied by a decrease in lateral stress according to figure 29.
![]()
Figure 29. Equation. Lateral Earth pressure at K1.
This idealized stress path is in agreement with Rowe’s earlier hypothesis that stress relaxation with unloading is negligible until some limiting condition, defined by the K1 line, is reached.(8) By following this type of stress path, an element of soil can be brought to a final state, which is represented by an effective coefficient Keffective, varying Ko ≤ Keffective ≤ K1. Having made this idealized assumption of the stress path, Broms then postulated the actual stress path followed by a real soil element.(9) Rowe and Ingold both suggested that K1 = KP (the coefficient of passive Earth pressure), reasoning that the limiting condition reached is essentially a form of passive failure.(8,45)
By employing this theory to estimate the lateral pressure exerted on a vertical, rigid, non-yielding structure with a compacted fill, Broms considered the compaction plant to present a load applied to the fill surface, inducing vertical stresses that may be approximated as twice as those calculated by the Boussinesq stress equation for an infinite half space.(9) Lateral Earth pressures acting against the wall were then calculated using figure 28. The resulting horizontal stress distribution calculated for a 11.25-T (10.2-t) smooth wheel roller is presented by Broms.(9)
By considering the backfill process as the placement of a series of soil layers each deposited and then compacted one after the other, the compaction-induced lateral pressure for each new layer will be surpassed in magnitude by the at-rest Earth pressures due to the static overburden.
Ingold applied the extension of Broms’ theory in cases where wall deflection during backfilling was sufficient to induce an active condition in the lower layers of a backfill that is deposited and compacted in lifts by assuming the virgin loading path to be σ ' h = KA σ ' v instead of Broms’ σ ' h = Ko σ ' v.(45) Ingold postulated that passive failure controlled the other limiting condition and therefore, K1 = Kp.(45)
Aggour and Brown were the first to model compaction-induced lateral Earth pressure by 2D FE analysis.(10) Aggour and Brown’s analysis involved the following steps for simulation of compaction operation:
Aggour and Brown used the procedure to model the soil moduli. The effects of increased number of compaction passes were modeled by increasing the soil modulus E2. The soil modulus was greater for unloading than for reloading. Compaction loading was modeled as a uniform unit surface pressure of unit width acting at all points along the full length of the fill, from the wall to the right boundary of the FE mesh. The fill materials were placed in five 4-ft (1.22-m) lifts. The interface between the soil and the wall was assumed to remain bonded at all times. The results of this analysis indicate the following:
The second sample problem analyzed by Aggour and Brown used the same soil and wall geometry, but only the last soil lift placed was compacted.(10) The effects of the compaction of the last soil layer were increased wall deflections and increased residual lateral Earth pressures near the top of the wall. These results were in agreement on a qualitative basis with field- and scale-model observations of the effects of compaction on structural deflections and residual lateral Earth pressures. The analyses suggest the potential value of FE analysis for determining compaction-induced Earth pressures on yielding structures.
Seed proposed a method to estimate the effects of CIS and associated deflections.(11) The study represents the most indepth study on the subject of CIS and involved the following three areas:
2.3.4.1 First Cycle Ko Reloading Stress Path and Typical Ko Unloading/Reloading Stress Path
Seed proposed the first cycle Ko reloading model.(11) The model was derived from fitting available data. Upon loading, the stress path is assumed to follow the Ko line to point A, after which, the unloading stress path is followed by K 'o = Ko (OCR)α to an arbitrary point B prior to reloading where OCR is the overconsolidation ratio, Ko is the at-rest coefficient of Earth pressure, α is an exponent determined from laboratory or in situ testing, and Ko' is the at-rest coefficient of Earth pressure accounting for stress history. Reloading is then assumed to follow a linear path to point R, the intersection of the reloading path with the Ko line and to follow the Ko line thereafter. Point R, the intersecting point of the reloading path with the virgin loading path, is determined as shown in figure 30 and figure 31.
![]()
Figure 30. Equation. Horizontal residual stress after compaction.
![]()
Figure 31. Equation. Vertical residual stress after compaction.
Where:
Δ = The decrease in horizontal effective stress from the maximum loading at point A to the minimum unloading at point B.
β = Assumed constant regardless of the degree of unloading that precedes reloading.
σ 'h,min = Minimum horizontal stress.
σ *v,r and σ *h,r = Vertical and horizontal residual stress after compaction, respectively.
2.3.4.2 Multicycle Ko Unloading/Reloading Stress Path and Ko Unloading Following Reloading Stress Path
Seed proposed another model for multicycle Ko unloading/reloading conditions.(11) The values α and β are assumed to remain constant regardless of the number of loading-reloading cycles.
Three situations of unloading were considered. The first situation is for unloading after significant loading, the second situation is for unloading after intermediate reloading, and the third situation is for unloading after moderate reloading. Note that Seed also developed a nonlinear multicycle Ko unloading/reloading compaction model.
2.3.4.4 Simplified Bilinear Approximation to the Nonlinear Model
In this model, the α-type nonlinear unloading model for the first cycle unloading is approximated by a bilinear unloading path. The relationship between K2 and F in the bilinear unloading model shows the relationship between K3 (slope of reloading path) and β3 of the model.
Seed also developed the following simplified hand-calculation procedure for computing CIS:(11)
![]()
Figure 32. Equation. Lateral residual stress.
The compaction models developed by Seed were used to determine CIS for full-scale experiments and were reported by Duncan and Seed and Duncan et al.(11–13) The publications show that CIS could be calculated based on either the simplified method (i.e., the bilinear model) or the nonlinear model with the aid of FE analysis. The studies showed that the resulting lateral Earth pressures determined by the models are in good agreement with measured data.
2.4 CIS IN A REINFORCED SOIL MASS
Many researchers and engineers have suggested that if a granular backfill is well compacted, a GRS mass can usually carry many loads while experiencing little movement. Several studies on performance of GRS structures have used simplified and somewhat arbitrary procedures to simulate the effects of fill compaction. In past studies, CIS in the fills were ignored completely. CIS in a GRS mass is likely to be more pronounced than CIS induced in an unreinforced soil mass because soil reinforcement interface friction tends to restrain lateral deformation of the soil mass and result in greater values of CIS. A review of previous studies on GRS masses, including the effects of CIS, is presented in this section.
Ehrlich and Mitchell presented a procedure to include CIS in the analysis of reinforced soil walls and noted that CIS was a major factor affecting the reinforcement tensions.(46) The assumptions involved in the procedure were as follows:
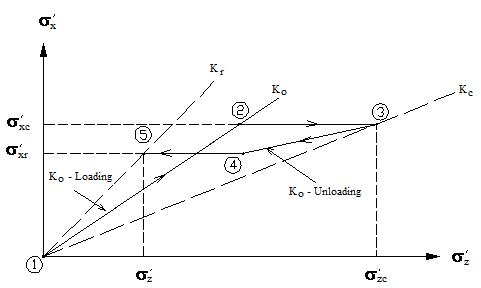
Figure 33. Illustration. Assumed stress path due to compaction-induced stress.
Loading due to the weight of overlying soil layers plus some equivalent increase in the stress state induced by the compaction operations is shown as paths 1–3 in figure 33. This is followed by unloading along paths 3–5 to the final residual stress-state condition at the end of construction. Ehrlich and Mitchell noted that by following this procedure, the stresses in each layer were calculated only once and that each layer calculation was independent of the others.(46)
The specific values of σ'z and σ'zc at point 3 in figure 33 represent the maximum stress applied to the soil at a given depth during the construction process. The maximum past equivalent vertical stress, including compaction at the end of construction (σ'zc ), can be estimated using a new procedure based on the method given by Duncan and Seed for conventional retaining walls.(12)
In figure 33, the value of σ'zc can be estimated using figure 34 through figure 38.
![]()
Figure 34. Equation. Maximum vertical stress at a given depth during construction.
![]()
Figure 35. Equation. Coefficient of Earth pressure at rest.(47)

Figure 36. Equation. Maximum lateral stress in terms of compaction and effective soil unit weight.
Where:
Q = Maximum vertical operating force of the roller drum.
L = Length of the roller drum.
γ = Effective soil unit weight.
![]()
Figure 37. Equation. Poisson’s ratio under Ko condition.
![]()
Figure 38. Equation. Bearing capacity factor.
The effects of CIS on compaction and reinforcement stiffness in GRS walls were investigated by Ehrlich and Mitchell.(46) Their conclusions were as follows:
Hatami and Bathurst noted that fill compaction has two effects on the soil: it increases the lateral Earth pressure and it reduces the effective Poisson’s ratio.(17) They suggested that the first effect can be modeled in a numerical analysis by applying a uniform vertical stress (1.2 and 2.3 psi (8 and 16 kPa) depending on compaction load) to the entire surface of each newly placed soil layer before analysis and removing it afterwards. This procedure was based on a recommendation by Gotteland et al., who simulated the compacting effect by loading and unloading a uniform surcharge of 7.3 and 14.5 psi (50 kPa and 100 kPa) on the top of the wall.(48)
For the second effect of compaction on the reduction of Poisson’s ratio, Hatami and Bathurst used the numerical simulation to find the minimum Poisson’s ratio, νmin , from matching measured and analysis data.(17) The results (wall lateral movement and reinforcement forces) obtained from the numerical analysis, including compaction effects, were in good agreement with the measured data.
In the numerical analyses, the compaction effects were also accounted for by increasing the elastic modulus number, Ke, from triaxial test results by a factor of 2.25 for walls 1 and 2.
Morrison et al. simulated the effects of fill compaction of shored mechanically stability Earth walls.(18) A 7.3-psi (50-kPa) inward pressure was applied to the top, bottom, and exposed faces of each lift to simulate the effects of fill compaction. The inward pressure was then reduced to 1.5 psi (10 kPa) on the top and bottom of a soil lift prior to placement of the next lift to simulate vertical relaxation or unloading following compaction. The inward pressure acting on the exposed face was maintained at 7.3 psi (50 kPa) because this produced the most reasonable model deformation behavior compared with that observed in the field-scale test. It was considered that the inward maintained pressures were “locking-in” stresses in soil due to compaction.
The stiffness of soil was increased by a factor of 10 to consider CIS in the GRS mass. This factor was about 2.25 in Hatami and Bathurst. (17)
Figure 39 shows the model for FE analysis by Morrison et al. (18) The figure shows the simulation of fill compaction of lift 5 by the applying uniform pressures.
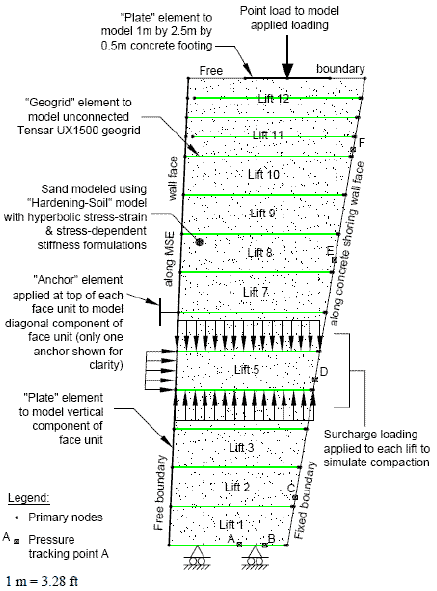
Figure 39. Illustration. FE model for FE analysis.(18)
The results of the lateral movement and reinforcement forces showed a good qualitative agreement with the measured data. However, general application of the procedure may be questionable because neither the method of analysis nor the magnitude of the applied inward pressure was properly justified.
2.5 HIGHLIGHTS OF COMPACTION-INDUCED EARTH PRESSURES IN THE LITERATURE
Several important highlights regarding compaction-induced lateral Earth pressures in the literature include the following: