U.S. Department of Transportation
Federal Highway Administration
1200 New Jersey Avenue, SE
Washington, DC 20590
202-366-4000
Federal Highway Administration Research and Technology
Coordinating, Developing, and Delivering Highway Transportation Innovations
 | REPORT |  |
| This report is an archived publication and may contain dated technical, contact, and link information |
|
| Publication Number: FHWA-HRT-10-077 Date: July 2013 |
Publication Number: FHWA-HRT-10-077 Date: July 2013 |
This chapter describes analytical models for evaluating CIS in a GRS mass, strength properties of a GRS mass, and required tensile strength of reinforcement in the design of GRS structures.
The first analytical model is a simple compaction model that is capable of estimating CIS, or the increase of the horizontal stresses, in a GRS mass due to fill compaction. The model was developed by combining a compaction model developed by Seed, the companion hand-calculation procedure for an unreinforced soil mass by Duncan and Seed, and the theory of GRS composite behavior proposed by Ketchart and Wu.(11,12,20)
The second analytical model is for the determination of the strength properties of a GRS composite mass. With the analytical model, a new relationship between reinforcement strength and reinforcement spacing is introduced to reflect an observation made in actual construction and in controlled experiments regarding the relative effects of reinforcement spacing and reinforcement strength on the performance of GRS structures.
The third analytical model is for the determination of reinforcement strength in design. This model was also developed based on the relationship between reinforcement strength and reinforcement spacing.
5.1 EVALUATING CIS IN A GRS MASSBased on previous studies regarding CIS for unreinforced soil masses and very limited studies for reinforced soil masses, a conceptual stress path for loading-unloading-reloading of a GRS mass is shown in figure 202.
 mass.")
Figure 202. Illustration. Conceptual stress path for compaction of a GRS mass.
Elements in figure 202 are as follows:
A simplified compaction simulation model is proposed for simulation of fill compaction of a GRS mass, as depicted in figure 203. By using the proposed model, the increase of the horizontal stresses in a GRS mass due to compaction can be estimated. These stresses, namely CIS, are represented by the horizontal residual stresses, Δσh, c, r, in figure 203. The proposed model is based on the bilinear compaction model for an unreinforced soil mass suggested by Seed and the companion hand-calculation procedure suggested by Duncan and Seed.(11,12) The proposed model considers the presence of geosynthetic inclusions.
 mass.")
Figure 203. Illustration. Stress path of the proposed simplified model for fill compaction
of a GRS mass.
The stress path for fill compaction of a GRS mass in the proposed model can be considered as a simplified form of the conceptual model described in section 5.1. The differences between the simplified model and the conceptual model are as follows:
Four model parameters are needed for the proposed compaction simulation model: Ki, c, K1, c, K2, c, and K3, c. These parameters can be estimated from soil and reinforcement properties using correlations shown in table 19. The empirical coefficients (e.g., α and F ) are calibrated by the measured data from the GSGC tests described in chapter 4. Recommended values of the empirical coefficients are given for routine applications. Alternatively, the model parameters can be obtained directly from the results of GSGC tests. Note that the term ![]() for the estimation of K2, c is to account for the presence of reinforcement.For hand calculations, the maximum increase of vertical stress due to compaction, Δσ'v, c, max, can be estimated simply by using Westergaard's solution as shown in figure 203.(78)
for the estimation of K2, c is to account for the presence of reinforcement.For hand calculations, the maximum increase of vertical stress due to compaction, Δσ'v, c, max, can be estimated simply by using Westergaard's solution as shown in figure 203.(78)
Table 19. Model parameters for the proposed compaction simulation model.
| Parameter | Name | Range of the Parameter Values | Preliminary Estimation Based on Soil and Reinforcement Properties |
| Ki, c | Coefficient of lateral Earth pressure of a GRS mass for initial loading | K A ≤ Ki, c ≤ K 0 | Ki, c ≅ β K A 1.0 ≤ β ≤ 1.5  K0 ≅ 1 - sin Φ' |
| K1, c | Limiting coefficient of lateral Earth pressure for unloading | K1, c ≅ K P | 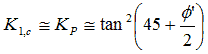 |
| K2, c | Coefficient of lateral Earth pressure for unloading | 0 ≤ K2, c ≤ K 0 | 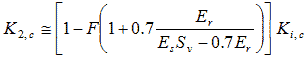 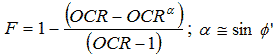 |
| K3, c | Coefficient of lateral Earth pressure for reloading | 0 ≤ K3, c ≤ K 0 | K3, c ≅ K2, c |
Ko = Coefficient of at-rest lateral Earth pressure. |
|||
Fill compaction is a complex operation in terms of change in stresses. This section describes the maximum increase of vertical stress at depth z along a given section in a soil mass due to typical compaction operation. Consider the change of vertical stress at depth z in section I-I due to moving compaction loads, as shown in figure 204 through figure 207. The directions of the moving compaction plant may either be coming toward section I-I or moving away from section I-I. The compaction loads are simulated by loading and unloading at different locations (locations 1, 2, and i), as shown in figure 204 and figure 206. Figure 205 and figure 207 show the stress path of the stresses at depth z along section I-I.

Figure 204. Illustration. Locations of compaction loads moving toward section I-I.

Figure 205. Illustration. Stress paths during compaction at depth z as compaction loads move toward section I-I.

Figure 206. Illustration. Locations of compaction loads moving away from section I-I.

Figure 207. Illustration. Stress paths during compaction at depth z as compaction loads move away from section I-I.
Elements in figure 205 are as follows:
In figure 206 and figure 207, the compaction plant moves away from section I-I. Initially, the compaction is located directly above section I-I, which causes the stresses to increase from point A to point F due to the compaction loads. As the compaction loads are removed from section I-I, the stresses are reduced from point F to point G, following the K2,c line. As the compaction plant moves away from section I-I, the stress conditions will move to points D and B along line FG. As the compaction plant is finally removed, the stress condition will be at point G.
As shown in figure 204 through figure 207, the residual stresses, denoted by the vertical distance AG, are the same for the two cases. This indicates that to determine the CIS at a certain section due to a moving compaction plant, only the residual lateral stresses need to be determined as the compaction loads are directly above the section under consideration.
Figure 208 shows the conceptual stress path on the effect of the number of compaction passes. For the first pass, the residual stress at point A is represented by point G. With the subsequent pass of the compaction plant, the slope of the K2line increases, and point G becomes point G'. As the number of compaction pass increases, the final residual stresses will move from G' to G'' to G'''.

Figure 208. Illustration. Stress path at depth z when subject to multiple compaction passes.
This section presents the estimation of K2, c in the proposed model for determining CIS in a GRS mass. Two stress reduction factors, F and A, are introduced (see figure 209). Factor F represents CIS for unreinforced soil in Seed’s model, and factor A is considered the presence of the reinforcement in the GRS mass.(11)
. It introduces two stress reduction factors, F and A, used in the estimation of K subscript 2,c in the proposed model.")
Figure 209. Illustration. Stress path of the proposed model for fill compaction of a GRS mass.
5.1.5.1 Compacted Soil
For an unreinforced soil fill, the coefficient of lateral Earth pressure for unloading in figure 203 can be estimated by using the expression in figure 210, as suggested by Seed.(11)
![]()
Figure 210. Equation. Coefficient of later Earth pressure.
Where:
![]()
α ≅ sin Φ'
OCR ≅ 5 for typical compacted sand.(11)
5.1.5.2 GRS Composite
For a GRS mass, total residual strain in the soil can be determined as shown in figure 211.
![]()
Figure 211. Equation. Total residual strain.
Where:
F and G = Stress reduction factors shown in figure 209.
Δσ = Increase in horizontal stress due to compaction.
Es = Soil stiffness.
From figure 211, the reinforcement force, T, due to residual strain in the soil can be determined as shown in figure 212.
![]()
Figure 212. Equation. Reinforcement force.
Where Er is the reinforcement stiffness.
The average residual stress in the soil due to compaction, G * ( Δσ ), is calculated as shown in figure 213 and figure 214.
![]()
Figure 213. Equation. Average residual stress in the soil due to compaction.
![]()
Figure 214. Equation. Second equation for average residual stress in the soil due to compaction.
Figure 215 is a result of the previous two equations.
![]()
Figure 215. Equation. Result of figure 213 and figure 214.
Substituting figure 215 into figure 216 results in figure 217.
![]()
Figure 216. Equation. First equation for estimation of K2, c.

Figure 217. Equation. Second equation for estimation of K2, c.
The factor 0.7 in figure 213 is explained in section 5.2.1. The increased horizontal stress in a GRS mass due to compaction can be estimated using figure 218.
![]()
Figure 218. Equation. Increased horizontal stress in a GRS mass due to compaction.
Substituting figure 217 into figure 218 results in figure 219 and figure 220.

Figure 219. Equation. Second equation of increased horizontal stress in a GRS mass due to compaction.

Figure 220. Equation. Residual lateral stress in a GRS mass due to compaction and the effect of CIS in a GRS mass.
Figure 220 shows the calculation of the residual lateral stress in a GRS mass due to compaction as well as the effect of CIS in a GRS mass.
Using figure 220, the increase in lateral stress in a GRS mass can be estimated, and the increase in soil stiffness can be evaluated. For example, the stiffness of a soil can be evaluated using figure 221.

Figure 221. Equation. Stiffness of a soil.
Where:
Et = Tangent modulus.
Rf = Ratio of ultimate deviator stress to the failure deviator stress.
c = Cohesive strength.
Φ = Angle of friction.
Pa = Atmospheric pressure.
K and n = Material parameters.
Schlosser and Long proposed the concepts of increase of apparent confining pressure and apparent cohesion of a GRS composite.(25) The Mohr circles of an unreinforced cohesive soil and a reinforced cohesive soil at failure are shown in figure 222.
 composite. The reinforced soil Mohr-Coulomb failure envelope has an apparent cohesion intercept of c subscript R, which is larger than the cohesion intercept of c for the unreinforced soil, and a friction angle of phi, which is the same as that for the unreinforced soil.")
Figure 222. Illustration. Concept of apparent confining pressure and apparent cohesion of a GRS composite.
The apparent cohesion of a GRS composite can be determined as shown in figure 223.
![]()
Figure 223. Equation. Apparent cohesion of a GRS composite.
Where:
cR= Apparent cohesion of a GRS composite.
c = Cohesion of soil.
Kp = Coefficient of passive Earth pressure.
Δσ3 R= Increase of confining pressure due to reinforcement.
Schlosser and Long also proposed figure 224 to calculate increased confining pressure.(25)
![]()
Figure 224. Equation. Increased confining pressure.
This expression implies that an increase in reinforcement strength, Tf, has the same effect as a proportional decrease in reinforcement spacing, Sv. Many experimental test results have shown that figure 224 is not correct. Reinforcement spacing plays a more important role than reinforcement strength. (See references 6, 7, 30, 31, and 35.) This point is also supported by the experiments conducted as a part of this study and presented in chapter 4.
A new method to estimate the increased confining pressure in soil due to the presence of reinforcement is expressed in figure 225.
![]()
Figure 225. Equation. New method to estimate the increased confining pressure in soil due to the presence of reinforcement.
Where the factor, W, can be estimated as shown in figure 226.
![]()
Figure 226. Equation. Estimation of the factor W.
Where:
Tf = Extensile strength of reinforcement.
r = Dimensionless factor.
Sv = Vertical spacing of reinforcement.
Sref = Reference spacing.
To estimate the factor r in figure 226, the concept of average stresses proposed by Ketchart and Wu was employed.(20) However, instead of using average stresses, average reinforcement forces were used.
5.2.1.1 Average Stress in GRS Mass by Ketchart and Wu(20)
Ketchart and Wu developed a concept of average stress to determine the behavior of a GRS composite based on a load transfer analysis.(20) From a simplified preloading-reloading (SPR) model for GRS mass, the equations to calculate stresses and displacements of a GRS mass were developed using the idealized geometry of a plane-strain GRS mass and differential elements of soil and reinforcement for equilibrium equations, as shown in figure 227.
 mass for the simplified preloading-reloading (SPR) model. The diagram shows a square of soil that is split in the middle by reinforcement. At the top of the diagram, there are arrows pointing down, labeled P subscript v. On the right, there are arrows pointing left, labeled P subscript h. At the bottom, the width of the mass is marked L. Along the left, the height of the mass is marked A subscript s equals S subscript v.")
Figure 227. Illustration. Idealized plane-strain GRS mass for the SPR model.
Based on the equilibrium equations and several assumptions, the stresses in soil and the force in the reinforcement can be calculated using the following equations.
The force in the reinforcement is calculated with figure 228.

Figure 228. Equation. Force in the reinforcement.
The horizontal stress in the soil is calculated with figure 229.

Figure 229. Equation. Horizontal stress in the soil.
Based on a load-transfer analysis, the average stresses were determined.
The average vertical stress,![]() v, is assumed to be equal to the boundary vertical pressure, as shown in figure 230.
v, is assumed to be equal to the boundary vertical pressure, as shown in figure 230.
![]()
Figure 230. Equation. Average vertical stress.
The average horizontal stress, ![]() h, is as shown in figure 231 and figure 232.
h, is as shown in figure 231 and figure 232.

Figure 231. Equation. First equation of average horizontal stress.

Figure 232. Equation. Second equation of average horizontal stress.
5.2.1.2. Average Reinforcement Forces in a GRS Mass
The equations of the forces in the reinforcement and the maximum force in the reinforcement are expressed as shown in figure 233 and figure 234.

Figure 233. Equation. Forces in the reinforcement.

Figure 234. Equation. maximum force in the reinforcement.
The average force in the reinforcement is calculated as shown in figure 235.

Figure 235. Equation. Average force in the reinforcement.
Substituting figure 233 into figure 235 results in figure 236 and figure 237, which is simplified to figure 238.

Figure 236. Equation. Second equation of average force in the reinforcement.

Figure 237. Equation. Third equation of average fore in the reinforcement.

Figure 238. Equation. Fourth equation of average force in the reinforcement.
Introducing a factor ![]() and using figure 234 and figure 238, r can be determined using figure 239.
and using figure 234 and figure 238, r can be determined using figure 239.
![]()
Figure 239. Equation. Estimation of factor r.
Table 20 shows the values of factor r for different applied pressures and reinforcement lengths using the data from the calculation example in the SPR model.(20)
Table 20. Values of factor r under different applied pressure and reinforcement lengths.
| Increment of Vertical Pressure (Pv) kPa) | Reinforcement Length, L (m) |
α | |
| 9.0 | 0.127 | 13.875 | 0.698 |
| 18.0 | 0.127 | 14.616 | 0.701 |
| 9.0 | 0.225 | 6.851 | 0.691 |
| 18.0 | 0.225 | 6.966 | 0.692 |
1 kPa = 0.145 psi |
|||
Table 20 shows that the average reinforcement forces are about 70 percent of the maximum reinforcement force. The highest value of the maximum reinforcement force, Fmax, cannot exceed the tensile strength of reinforcement, Tf, as shown in figure 240.
![]()
Figure 240. Equation. Maximum reinforcement force.
The average reinforcement force is as shown in figure 241.
![]()
Figure 241. Equation. Average reinforcement force.
Figure 226 becomes figure 242.
![]()
Figure 242. Equation. Second estimation of the factor W.
Substituting figure 242 into figure 225, the increased confining pressure in a GRS mass is calculated in figure 243.

Figure 243. Equation. Increased confining pressure in a GRS mass.
Therefore, the apparent cohesion, cR, of a GRS composite can be evaluated using figure 244.

Figure 244. Equation. Apparent cohesion.
Where:
c = Cohesion of soil.
Kp = Coefficient of passive Earth pressure.
Tf = Extension strength of reinforcement.
Sv = Vertical spacing of reinforcement.
Sref = Reference spacing, which can be calculated using figure 245.
![]()
Figure 245. Equation. Reference spacing.
Where:
dmax = Maximum particle/grain size of soil.
Therefore, the ultimate pressure carrying capacity, σ1R, of a soil-geosynthetic composite mass is calculated using figure 246.
![]()
Figure 246. Equation. Pressure carrying capacity.
Where σ3 is the confining pressure.
5.3 VERIFICATION OF THE ANALYTICAL MODEL WITH MEASUREMENT DATAVerification of the proposed analytical model for GRS composite strength properties was made by comparing the model calculation results with the measured data from GSGC tests presented in chapter 4 and with the measured data by Elton and Patawaran.(31)
The dimensions of the GSGC tests were 6.6 ft (2 m) high and 4.6 ft (1.4 m) wide in a plane-strain condition. The soil mass in the tests was reinforced with Geotex® 4×4 geotextile at 0.7- and 1.3-ft (0.2- and 0.4-m) spacing. For the diabase soil used in GSGC tests, the maximum particle size was about 1.3 inches (66 mm). Therefore, Sref = 6 dmax = 7.8 inches (0.2 m). Comparisons of the results between the analytical model and the GSGC tests are presented in table 21. The deviatoric stresses at failure calculated from the analytical model are in good agreement with those of the GSGC tests, with differences of less than 10 percent.
Table 21 . Comparison of the results of the analytical model and the GSGC tests.
| Parameter | Test 2 (T, S) |
Test 3 (2T, 2S) |
Test 4 (T, 2S) |
| Tf (kN/m) | 70 | 140 | 70 |
| Sv (m) | 0.2 | 0.4 | 0.4 |
| Δσ3 (kN/m2) by the analytical model | 245 | 172 | 86 |
| cR (kN/m2) by the analytical model | 407 | 305 | 188 |
| (σ1R - σ3) (kN/m2) from measured data | 2,700 | 1,750 | 1,300 |
| (σ1R - σ3) (kN/m2) by the analytical model | 2,460 | 1,900 | 1,250 |
| Difference between analytical model and measured data | -9 percent | +8 percent | -4 percent |
|
1 kN/m = 0.069 kip/ft |
|||
For reference purposes, comparisons of the results between Schlosser and Long’s method and the GSGC tests are presented in table 22. The deviatoric stresses at failure calculated from Schlosser and Long’s method are about 20 to 86 percent larger than the measured values.
Table 22. Comparison of the results of Schlosser and Long’s method and the GSGC tests.
| Parameter | Test 2 (T, S) |
Test 3 (2T, 2S) |
Test 4 (T, 2S) |
| Tf (kN/m) | 70 | 140 | 70 |
| Sv (m) | 0.2 | 0.4 | 0.4 |
| Δσ3 (kN/m2) by Schlosser and Long’s method | 350 | 350 | 175 |
| cR (kN/m2) by Schlosser and Long’s method | 550 | 550 | 310 |
| (σ1R - σ3) (kN/m2) from measured data | 2,700 | 1,750 | 1,300 |
| (σ1R - σ3) (kN/m2) by Schlosser and Long’s method | 3,250 | 3,250 | 1,930 |
| Difference between Schlosser and Long’s method and measured data | +20 percent | +86 percent | -48 percent |
|
1 kN/m = 0.069 kip/ft |
|||
Elton and Patawaran conducted seven large-size triaxial tests for reinforced soil 5 ft (1.5 m) in height and 2.5 ft (0.76 m) in diameter.(31) All the tests were conducted under an unconfined condition. The properties of the tests were as follows:
. There are two lines, one for before and one for after. The lines match fairly closely, both starting between 1.000 and 0.100 inches (25.4 and 2.54 mm) and just below 100 percent and ending between 0.010 and 0.001 inches (0.254 and 0.0254 mm) just above 0 percent.")
1 mm = 0.039 inches
Figure 247. Graph. Backfill grain size distribution before and after large-size triaxial tests.
The maximum particle size of the backfill in the large-size triaxial tests was dmax = 0.5 inches (12.7 mm). Therefore, Sref = 6 dmax = 3 inches (0.08 m). The measured results are shown in figure 248. The comparisons of Elton and Patawaran’s tests results with the analytical model and with Schlosser and Long’s method are presented in table 23 and table 24, respectively.
, and vertical strain is on the x-axis from 0 to 30 percent. There are seven lines representing different types of reinforcement. The lowest line is for TG500-12, and the highest line is for TG028.")
1 ksf = 47.88 kPa
Figure 248. Graph. Large-size triaxial test results.
Table 23. Comparison of the results of the analytical model and Elton and Patawaran’s tests.(31)
| Parameter | TG 500 | TG 500 | TG 600 | TG 700 | TG 800 | TG 1000 | TG 028 |
| Tf (kN/m) | 9 | 9 | 14 | 15 | 19 | 20 | 25 |
| Sv (m) | 0.15 | 0.30 | 0.15 | 0.15 | 0.15 | 0.15 | 0.15 |
| Δσ3 (kN/m2) by the analytical model | 30 | 8 | 47 | 48 | 62 | 67 | 83 |
| cR (kN/m2) by the analytical model | 60 | 36 | 78 | 79 | 94 | 99 | 116 |
| (σ1R - σ3) (kN/m2) from measured data | 230 | 129 | 306 | 292 | 402 | 397 | 459 |
| (σ1R - σ3) (kN/m2) by the analytical model | 256 | 153 | 333 | 341 | 402 | 426 | 498 |
| Difference between the analytical model and measured data (percent) | 11 | 18 | 9 | 17 | 0 | 7 | 8 |
1 kN/m = 0.069 kip/ft |
|||||||
Table 24. Comparison of the results of Schlosser and Long’s method and Elton and Patawaran’s tests.(31)
| Parameter | TG 500 | TG 500 | TG 600 | TG 700 | TG 800 | TG 1000 | TG 028 |
| Tf (kN/m) | 9 | 9 | 14 | 15 | 19 | 20 | 25 |
| Sv (m) | 0.15 | 0.30 | 0.15 | 0.15 | 0.15 | 0.15 | 0.15 |
| Δσ3 (kN/m2) by Schlosser and Long’s method | 59 | 30 | 92 | 122 | 122 | 132 | 163 |
| cR (kN/m2) by Schlosser and Long’s method | 91 | 59 | 126 | 158 | 158 | 169 | 202 |
| (σ1R - σ3) (kN/m2) from measured data | 230 | 129 | 306 | 402 | 402 | 397 | 459 |
| (σ1R - σ3) (kN/m2) by Schlosser and Long’s method | 390 | 254 | 541 | 678 | 678 | 726 | 868 |
| Difference between Schlosser and Long’s method and measured data (percent) | 70 | 97 | 77 | 69 | 69 | 83 | 89 |
1 kN/m = 0.069 kip/ft |
|||||||
The differences in the deviatoric stresses at failure calculated from the analytical model and Elton and Patawaran’s measured data are less than 18 percent. The results calculated from Schlosser and Long’s method are 69 to 97 percent larger than the measured values.
FE analyses were conducted to provide additional data for verifying the analytical model. The test conditions and material properties used for the FE analyses were the same as those used in GSGC test 2 but with confining pressures of 4.9, 10, 15, and 29 psi (34, 70, 100, and 200 kPa). The confining pressure used in GSGC test 2 was 4.9 psi (34 kPa). The comparison shown in table 25 indicates that the results of the analytical model are in good agreement with those obtained from the FE analyses at the different confining pressures. The largest difference in terms of the deviatoric stress at failure is 9 percent.
Table 25. Comparison of the results of analytical model and GSGC test 2 with different confining pressures from FE analyses.
| Parameter | σ3 = 34 kPa |
σ3 = 70 kPa |
σ3 = 100 kPa |
σ3 = 200 kPa |
| Δσ3 (kN/m2) by the analytical model | 245 | 245 | 245 | 245 |
| cR (kN/m2) by the analytical model | 407 | 407 | 407 | 407 |
| (σ1R - σ3) (kN/m2) from FE analysis | 2,700 | 2,970 | 3,190 | 3,860 |
| (σ1R - σ3) (kN/m2) by the analytical model | 2,490 | 2,760 | 2,990 | 3,740 |
| Difference between the analytical model and FE analyses | -8 percent | -7 percent | -6 percent | -3 percent |
1 kN/m = 0.145 kip/ft |
||||
5.4 REQUIRED REINFORCEMENT STRENGTH IN DESIGN
In this section, an analytical model for determining required tensile strength in reinforcement is developed, the analytical model is compared with the current design equation, and verification of the analytical model is presented.
In current design methods, figure 249 is used to determine the required reinforcement strength for the design of GRS structures.
![]()
Figure 249. Equation. Required strength for reinforcement.
Where:
Trequired = Required strength for reinforcement at depth z.
σh = Horizontal stress in a GRS mass at depth z.
Fs = Safety factor.
Assuming Fs = 1, then Trequired = Tf , the ultimate strength of reinforcement, and figure 249 becomes figure 250.
![]()
Figure 250. Equation. Tf divided by Sv
Note that when the horizontal stress, σh, is a constant, the ratio Tf /Sv becomes a constant (i.e., Tf is linearly proportional to Sv). Using figure 225, a new expression for the increase of confining pressure due to tensile inclusion, a modified equation for determination of required reinforcement strength can be obtained. The horizontal stress, σh, in a GRS structure at depth z is calculated using figure 251 or figure 252.
![]()
Figure 251. Equation. First equation for horizontal stress in a GRS structure.
![]()
Figure 252. Equation. Second equation for horizontal stress in a GRS structure.
Substituting figure 225 into figure 250 leads to figure 253 and figure 254.
![]()
Figure 253. Equation. Third equation for horizontal stress in a GRS structure.
![]()
Figure 254. Equation. Second equation for Tf divided by Sv.
Substituting figure 241 into figure 254 results in figure 255.

Figure 255. Equation. Third equation for Tf divided by Sv.
For a GRS wall with modular block facing, the lateral constraint pressure, σ3, at depth z, can be estimated as shown in figure 256.
![]()
Figure 256. Equation. Lateral constraint pressure.
Where:
γb = Unit weight of facing block.
b = Width of facing block.
δ = Friction angle between modular block facing elements ( δ can be the friction angle between facing blocks if there is no reinforcement between the blocks or it can be the friction angle between facing block and geosynthetic if there is reinforcement sandwiched between blocks).
dmax = Maximum grain size of the backfill.
The required tensile strength of the reinforcement in design is shown in figure 257.

Figure 257. Equation. Required tensile strength of the reinforcement in design.
Where σh is the maximum lateral stress in a GRS mass and can be evaluated as the Rankin active Earth pressure. Note that Trequired is always equal or greater than zero. For a GRS mass without lateral constraint (e.g., a wrapped wall), σ3 equals 0, and figure 257 becomes figure 258.

Figure 258. Equation. Second equation for required tensile strength of the reinforcement in design.
A comparison of reinforcement forces was made between the proposed model (figure 257) and the current design equation (figure 249). The reinforcement forces in a 20-ft (6.0-m)-high GRS wall, as determined by the two equations, are shown in table 26. Note that the facing stiffness is ignored in the current design method, while the facing rigidity, as denoted by the lateral constraint pressure, σ3, can be accounted for in the proposed model.
Table 26. Comparison of reinforcement forces in proposed model and current design equation for a GRS wall.
| z (m) | Trequired (kN/m) for Fs = 1 | |||
| Current Design Equation | Proposed Model | |||
| No Facing | Modular Block Facing with δ b-b = 35 degrees |
Modular Block Facing with δ b-b = 54 degrees |
||
| 0.4 | 0.3 | 0.4 | 0.0 | 0.0 |
| 0.8 | 0.6 | 0.9 | 0.0 | 0.0 |
| 1.2 | 1.0 | 1.3 | 0.0 | 0.0 |
| 1.6 | 1.3 | 1.8 | 0.3 | 0.0 |
| 2.0 | 1.6 | 2.2 | 0.8 | 0.0 |
| 2.4 | 1.9 | 2.7 | 1.2 | 0.0 |
| 2.8 | 2.3 | 3.1 | 1.7 | 0.3 |
| 3.2 | 2.6 | 3.5 | 2.1 | 0.7 |
| 3.6 | 2.9 | 4.0 | 2.5 | 1.2 |
| 4.0 | 3.2 | 4.4 | 3.0 | 1.6 |
| 4.4 | 3.6 | 4.9 | 3.4 | 2.0 |
| 4.8 | 3.9 | 5.3 | 3.9 | 2.5 |
| 5.2 | 4.2 | 5.8 | 4.3 | 2.9 |
| 5.6 | 4.5 | 6.2 | 4.8 | 3.4 |
| 6.0 | 4.9 | 6.6 | 5.2 | 3.8 |
1 kN/m = 0.069 kip/ft |
||||
Verification of the analytical model for determination of reinforcement strength was made by comparing the forces in reinforcement at failure from the GSGC tests with the data measured by Elton and Patawaran and with a typical GRS wall.(31)
Table 27 shows a comparison of the results from the proposed model and measured data from the GSGC tests. Note that cohesion, c, was included in model calculations. The largest difference in reinforcement forces between the two is 16 percent, whereas there is 47 percent difference between the current design methods and the test data.
Table 27. Comparison of reinforcement forces in the proposed model and the GSGC tests.
Parameter |
Test 2 |
Test 3 |
Test 4 |
Test 5 |
Reinforcement force at failure, Tf (kN/m) |
70 |
140 |
70 |
70 |
Reinforcement spacing, Sv (m) |
0.2 |
0.4 |
0.4 |
0.2 |
Measured failure pressure (kPa) |
2,700 |
1,750 |
1,300 |
1,900 |
Lateral constraint pressure σ3 (kPa) |
34 |
34 |
34 |
0 |
Maximum reinforcement force from current design equation (kN/m) |
62.4 |
74.4 |
50.5 |
41.2 |
Difference between current design equation and Tf (percent) |
-11 |
-47 |
-28 |
-41 |
Maximum reinforcement force from proposed model (kN/m) |
79.4 |
124.1 |
75.4 |
58.8 |
Difference between proposed model |
+13 |
-11 |
+8 |
-16 |
1 kN/m = 0.069 kip/ft |
||||
A comparison of the reinforcement forces between the proposed model and the measured data from Elton and Patawaran’s tests is shown in table 28.(31) The largest difference in reinforcement forces between the two is 13 percent, whereas it was as high as 74 percent between the current design method and the test results. The proposed model clearly gives a much improved value for estimating reinforcement strength compared to the current design methods.
Table 28. Comparison of reinforcement forces between proposed model and test data from Elton and Patawaran.(31)
| Parameter | TG 500 |
TG 500 |
TG 600 |
TG 700 |
TG 800 |
TG 1000 |
TG 028 |
| Reinforcement force at failure, Tf (kN/m) | 9 | 9 | 14 | 15 | 19 | 20 | 25 |
| Reinforcement spacing, Sv (m) | 0.15 | 0.30 | 0.15 | 0.15 | 0.15 | 0.15 | 0.15 |
| Measured failure pressure (kPa) | 230 | 129 | 306 | 292 | 402 | 397 | 459 |
| Maximum reinforcement force from current design equation (kN/m) | 4.47 | 2.35 | 6.95 | 6.49 | 10.08 | 9.91 | 11.94 |
| Difference between current design equation and Tf (percent) | -50 | -74 | -50 | -57 | -47 | -50 | -52 |
| Maximum reinforcement force from proposed model (kN/m) | 9.02 | 9.56 | 14.02 | 13.10 | 20.34 | 20.01 | 24.09 |
| Difference between proposed model and Tf (percent) | 0 | +6 | 0 | -13 | +7 | 0 | -4 |
1 kN/m = 0.069 kip/ft |
|||||||

