U.S. Department of Transportation
Federal Highway Administration
1200 New Jersey Avenue, SE
Washington, DC 20590
202-366-4000
Federal Highway Administration Research and Technology
Coordinating, Developing, and Delivering Highway Transportation Innovations
 | REPORT |  |
| This report is an archived publication and may contain dated technical, contact, and link information |
|
| Publication Number: FHWA-HRT-10-077 Date: July 2013 |
Publication Number: FHWA-HRT-10-077 Date: July 2013 |
The GSGC tests described in chapter 4 were simulated using the FE method of analysis. The behavior of the reinforced soil mass in GSGC test 2 under different confining pressures, which was not part of the experimental program, was investigated using the FE model. The angle of dilatation of a GRS composite was studied. In addition, the analytical model developed for evaluation of CIS in a GRS mass was verified by comparing the model results with those obtained from the FE analyses.
Many FE codes are available for the analysis of soil-structure interaction problems, including Abaqus, FLAC, LS-Dyna®, Plaxis, Sage Crisp®, and Sigma/W® (Geoslope). Plaxis 8.2 code was selected for the analysis in this study due primarily to the author’s familiarity with the code. This code has been used successfully for the analysis of various Earth structures, including GRS structures.(79–81)
6.1 PLAXIS 8.2Version 8.2 of Plaxis is an FE code intended for 2D analysis of deformation and stability problems in geotechnical engineering. The details of Plaxis 8.2 can be found in the software manual.(81) Following is a brief description of some key features of the program:
The residual lateral stresses in a GRS mass due to compaction can be evaluated by figure 259. (See section 5.15 for details.)
![]()
Figure 259. Equation. Residual lateral stresses in a GRS mass due to compaction.
To illustrate how to compute the residual lateral stresses, or CIS, in a GRS mass, a 19.68-ft (6-m)-high GRS mass was used as an example. The parameters for the calculation of CIS are as follows:
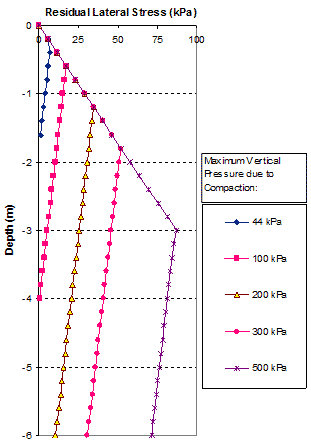
The vertical maximum pressures of 6.4, 15, 29, 44, and 73 psi (44, 100, 200, 300, and 500 kPa) due to compaction were used for the calculation of the residual stresses. Note that the maximum vertical compaction stress of 6.4 psi (44 kPa) was the contact pressure used in the GSGC tests described in chapter 4.
Figure 260 shows the distribution of the residual lateral stresses with depth due to the different maximum compaction pressures. The values of the lateral residual stresses in this figure were calculated based on figure 258 with the assumption that the compaction lift of 0.7 ft (0.2 m) is small compared to the dimensions of the compaction plant. As a result, the distribution of the lateral residual stress within the 0.7-ft (0.2-m)-thick lift due to compaction is constant. Near the surface, the lateral residual stresses will follow the limiting lateral Earth pressure for the unloading condition (i.e., the K1,c line, as shown in figure 203 and table 19).
1 m = 3.28 ft
1 kPa = 0.145 psi
Figure 260. Graph. Distribution of residual lateral stresses of a GRS mass with depth due to fill compaction.
6.3 FE SIMULATION OF THE GSGC TESTS
Plaxis 8.2 was used for the simulation of GSGC tests 1, 2, and 3, as described in chapter 4. The backfill of all GSGC test specimens was compacted at 0.7-ft (0.2-m) lifts using an MBW GP1200 plate compactor with a contact pressure of 6.4 psi (44 kPa). The soil stiffness, Eref50, can be estimated from triaxial tests using Janbu’s equation.(82) The Poisson’s ratio of the backfill can be estimated as shown in figure 261 for uniaxial tests and figure 262 for triaxial tests.
![]()
Figure 261. Equation. Poisson’s ratio of the backfill for uniaxial tests.
![]()
Figure 262. Equation. Poisson’s ratio of the backfill for triaxial tests.
For GSGC test 1 (unreinforced soil), the soil model and parameters used in the analysis are as follows:
For the GSGC tests, the backfill stiffness was increased due to CIS as follows:
The properties of the backfill were modified due to compaction effects. The Poisson’s ratio under plane-strain condition was reduced to νmin, as suggested by Hatami and Bathurst. (17) Soil modulus Eref50 was calculated using the increase in confining pressure due to compaction. The value of Eref50 can be estimated by using equation 80 with σ'3 = σ'3S + Δσ3, where Δσ3 can be estimated by figure 221. Note that the elastic modulus was increased by factor of 2.25 for walls 1 and 2 in Hatami and Bathurst’s numerical analyses and by a factor of 10 in the FE analyses by Morrison, et al.(17,18)
The conditions and properties of the backfill and reinforcement of GSGC tests 2 and 3 used in the FE analyses are shown in table 29.
Table 29. Parameters and properties of the GSGC tests used in FE analyses.
| Category | Description |
| Soil | Material, diabase; Soil model, hardening soil model; dry unit weight, γd = 24 kN/m3; wet unit weight, γw = 25 kN/m3; cohesion, c = 70 kPa; angle of internal friction, Φ = 50 degrees; angle of dilation, Ψ = 17 degrees; soil modulus, Eref50 = 63,400 kPa, Erefur = 126,800 kPa; Poisson’s ratio, ν = 0.2; power, m = 0.5 |
Reinforcement |
GSGC test 2: Single-sheet Geotex® 4×4: axial stiffness, EA = 1,000 kN/m; ultimate strength, Tult = 70 kN/m; reinforcement spacing, Sv = 0.2 m |
| GSGC test 3: Double-sheet Geotex® 4×4: axial stiffness, EA = 2,000 kN/m; ultimate strength, Tult = 140 kN/m; reinforcement spacing, Sv = 0.4 m | |
| Facing block | FE model, linear elastic model; modulus, E = 3*107 kPa; unit weight, γ = 12.5 kN/m3 (hollow blocks); Poisson’s ratio, ν = 0. |
| Block-block interface | FE model, Mohr-Coulomb model; modulus, E = 3*106 kPa; unit weight, γ = 0 kN/m3; cohesion, c = 2 kPa; angle of internal friction, Φ = 33 degrees; Poisson’s ratio, ν = 0.45 |
| Confining pressure | Constant confining pressures of 34 kPa for the GSGC tests 1–4 |
1 kN/m3 = 0.006 kip/ft3 |
|
Figure 263 through figure 268 show the steps in the FE analyses. The first 20 steps were used for modeling the preparation of the specimen. The loading began from step 21.

Figure 263. Illustration. Step 1 of analysis for the GSGC tests—placement of first layer.

Figure 264. Illustration. Step 2 of analysis for the GSGC tests—compaction of first layer.

Figure 265. Illustration. Step 3 of analysis for the GSGC tests—placement of second layer.
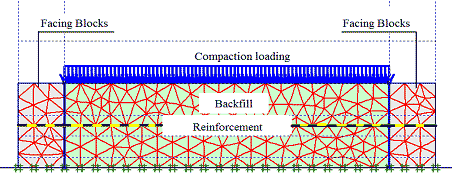
Figure 266. Illustration. Step 4 of analysis for the GSGC tests—compaction of second layer.
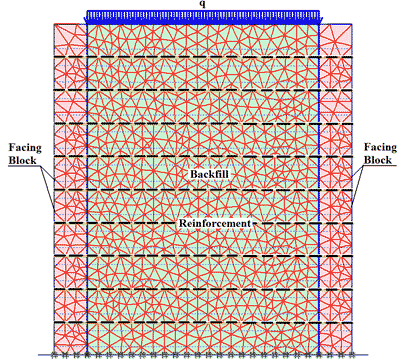
Note: The full height of the GSGC mass was reached at the last step of the specimen preparation.
Figure 267. Illustration. Step 20 of analysis for the GSGC tests—placement of surcharge.
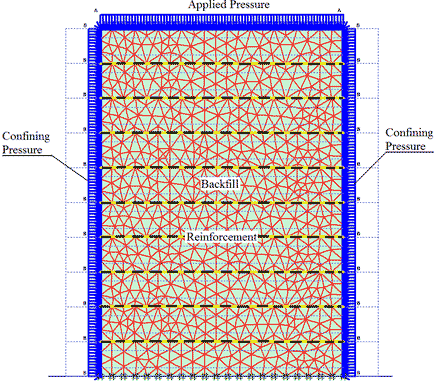
Note: The facing blocks were removed and confining pressure and vertical pressures were applied (during loading).
Figure 268. Illustration. Step 21 of analysis for the GSGC tests—placement of surcharge and confining stress.
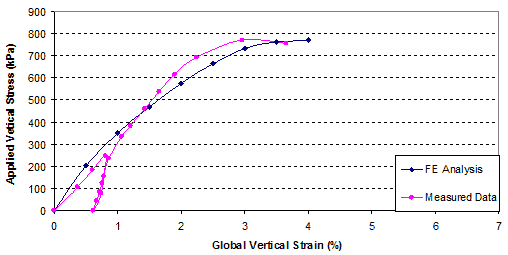
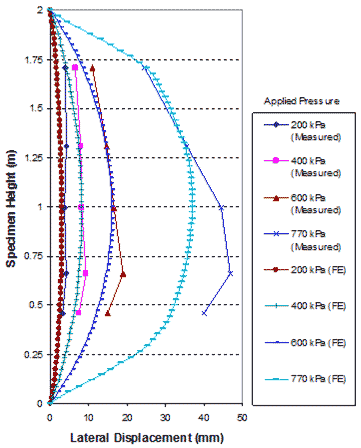
The global stress-strain relationship and volume change relationship obtained from FE analysis and the GSGC tests are shown in figure 269 and figure 270. The analysis results are in good agreement with the measured data. The maximum differences of the results between the FE analysis and the tests were about 5 percent. Figure 271 shows the lateral movements on the open faces of the specimen at 29, 58, 87, and 110 psi (200, 400, 600, and 770 kPa). These results from FE analyses and the tests are also in good agreement.
1 kPa = 0.145 psi
Figure 269. Graph. Comparison of results for GSGC test 1, global vertical stress-strain relationship.
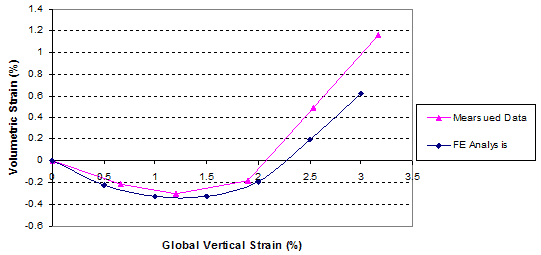
Figure 270. Graph. Comparison of results for GSGC test 1, volume change relationship.
1 m = 3.28 ft
1 kPa = 0.145 psi
Figure 271. Graph. Comparison of lateral displacements on open face of GSGC test 1.
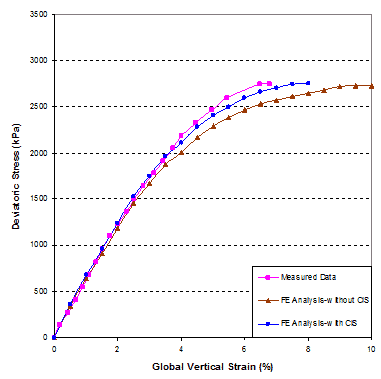
The global stress-strain relationships, as obtained from FE analysis and the GSGC tests, are shown in figure 272. The results of the FE analysis with and without consideration of CIS are included in the figure. The results with consideration of CIS give a slightly better simulation of the stress-strain curve. It should be noted that the compaction energy used in the GSGC tests was very low. As a result, the magnitude of CIS was very small and the effect of CIS on the global stress-strain relationship was not significant.
1 kPa = 0.145 psi
Figure 272. Graph. Comparison of global stress-strain relationship of GSGC test 2.
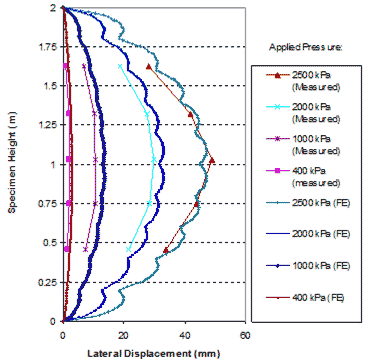
Figure 273 shows the lateral displacements on the open faces of the specimen at applied pressures of 58, 145, 290, and 360 psi (400, 1,000, 2,000, and 2,500 kPa). The simulated lateral displacements are no more than 5 percent greater than the measured values.
1 m = 3.28 ft
1 mm = 25.4 inches
1 kPa = 0.145 psi
Figure 273. Graph. Comparison of lateral displacement at open face of GSGC test 2.
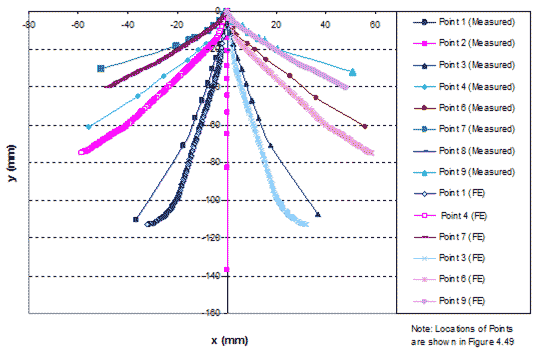
Figure 274 shows the simulated and measured displacements of the GSGC mass at selected points in figure 153. The simulated displacements are in agreement with the measured values.
1 mm = 0.039 inches
Figure 274. Graph. Comparison of internal displacements of GSGC test 2.
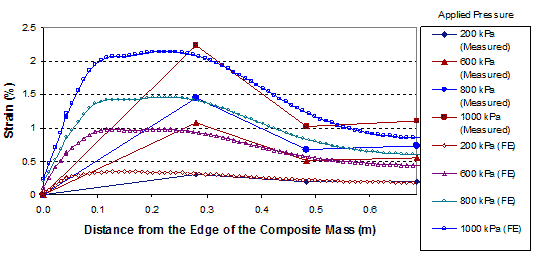
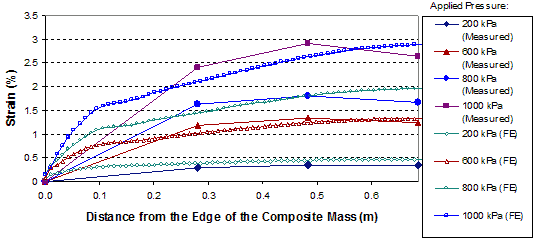
A comparison of the distribution of strains in the reinforcement in GSGC test 2 between the FE analyses and measured data are shown in figure 275 and figure 276. The simulated strains are in good agreement with the measured values.
1 m = 3.28 ft
1 kPa = 0.145 psi
Figure 275. Graph. Comparison of results for GSGC test 2 at reinforcement layer 5.25 ft (1.6 m) from the base.
1 m = 3.28 ft
1 kPa = 0.145 psi
Figure 276. Graph. Comparison of results for GSGC test 2 at reinforcement layer 2.62 ft (0.8 m) from the base.
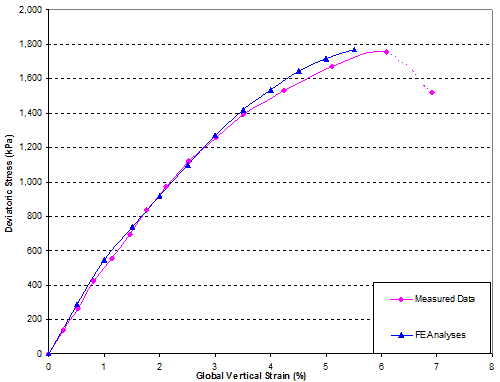
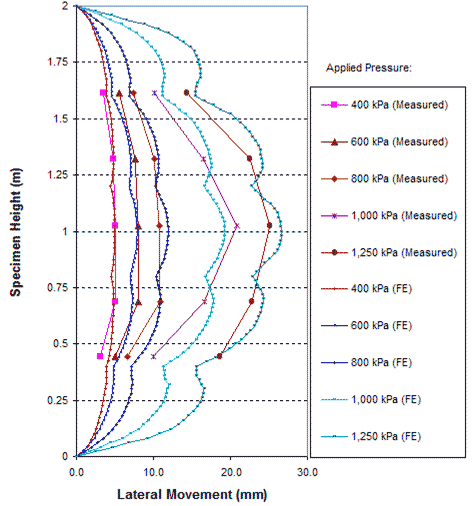
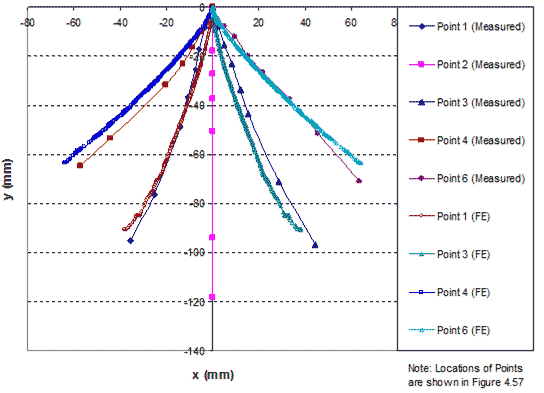
A comparison of the global stress-strain relationships obtained from FE analysis and measured data of GSGC test 3, are shown in figure 277. The FE results are in agreement with the measured data. The lateral displacements on the open faces at applied pressures of 58, 87, 116, 145, and 180 psi (400, 600, 800, 1,000, and 1,250 kPa) are shown in figure 278. Figure 279 shows a comparison of simulated and measured internal displacements of the GSGC test 3 specimen at selected points in figure 169. Once again, the results from FE analyses are in good agreement with the measured values.
1 kPa = 0.145 psi
Figure 277. Graph. Comparison of global stress-strain relationship of GSGC test 3.
1 m = 3.28 ft
1 mm = 0.039 inches
1 kPa = 0.145 psi
Figure 278. Graph. Comparison of lateral displacement at open face of GSGC test 3.
1 mm = 0.039 inches
Figure 279. Graph. Comparison of internal displacements of GSGC test 3.
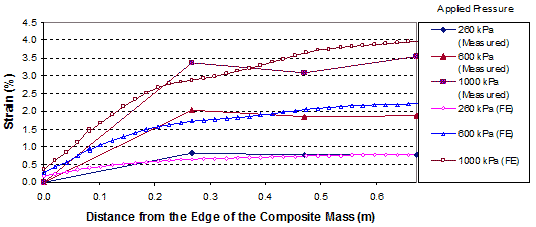
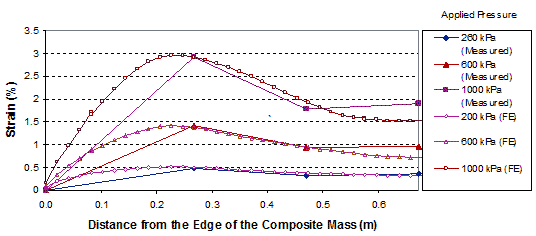
The comparisons of the distribution of strains in the reinforcement in GSGC test 3 between FE analyses and measured data are shown in figure 280 and figure 281. The simulated strains are in agreement with the measured values.
1 m = 3.28 ft
1 kPa = 0.145 psi
Figure 280. Graph. Comparison of results for GSGC test 3 at reinforcement layer 3.94 ft (1.2 m) from the base.
1 m = 3.28 ft
1 kPa = 0.145 psi
Figure 281. Graph. Comparison of results for GSGC test 3 at reinforcement layer 1.3 ft (0.4 m) from the base.
6.4 FE ANALYSIS OF GSGC TEST 2 UNDER DIFFERENT CONFINING PRESSURES AND DILATION ANGLE OF SOIL-GEOSYNTHETIC COMPOSITES
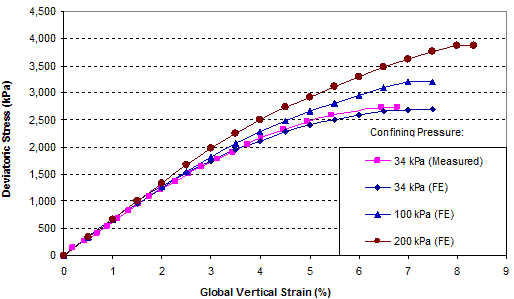
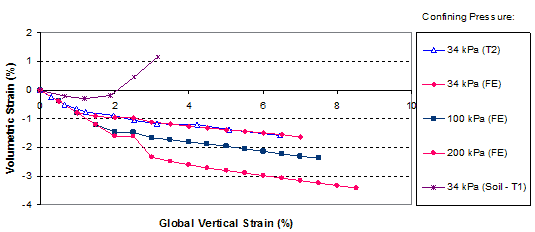
Figure 282 shows a comparison of the global stress-strain relationship obtained from FE analysis and the measured data of GSGC test 2. Figure 283 shows a comparison of the volume change relationships. GSGC test 2 was conducted under a confining pressure of 4.9 psi (34 kPa). The global stress-strain and volume change relationships under the confining pressure of 4.9 psi (34 kPa) as obtained from FE analysis are in good agreement with the measured data. To provide additional data under different confining pressures, the FE model was used to generate data under confining pressures of 15 and 29 psi (100 and 200 kPa), as shown in the figures.
1 kPa = 0.145 psi
Figure 282. Graph. FE analyses of GSGC test 2 under different confining pressures—global stress-strain relationship.
1 kPa = 0.145 psi
Figure 283. Graph. FE analyses of GSGC test 2 under different confining pressures—volume change curves.
It is interesting to note that the reinforcing mechanism of a GRS mass can be viewed in terms of the angle of dilation. The angle of dilation of a GRS mass is smaller than the angle of dilation of an unreinforced soil mass. Using the data in figure 282 and figure 283 as an example, the angles of dilation of the soil-geosynthetic composites were approximately -8, -11, and -12 degrees (a negative dilation angle means no dilation; the greater the absolute value, the less likely the material will dilate) under confining pressures of 4.9, 15, and 29 psi (34, 100, and 200 kPa), respectively. The angle of dilation of the unreinforced soil was +17 degrees under a confining pressure up to 29 psi (200 kPa). This suggests that the presence of geosynthetic reinforcement has a tendency to suppress dilation of the surrounding soil. A soil having less tendency to dilate will become stronger. The dilation behavior offers a new explanation of the reinforcing mechanism, and the angle of dilation provides a quantitative measure of the degree of reinforcing effect of a GRS mass.
The analytical model for evaluating CIS, as described in section 3.2, was verified using the FE method of analysis. The FE analysis was carried out by using Plaxis 8.2.(81) To verify the CIS model, a 20-ft (6-m)-high GRS mass was chosen as an example. The parameters used for the calculation of CIS in the analytical model and the FE analysis are as follows:
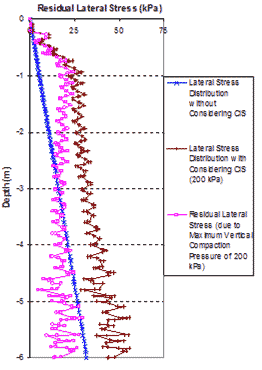
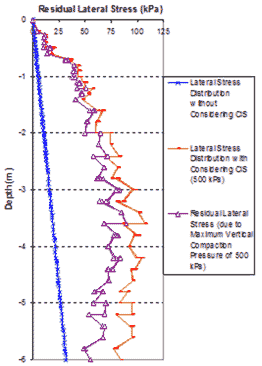
The very fine mesh of an FE analyses to simulate CIS in a GRS mass is shown in figure 284. Figure 285 and figure 286 show the lateral stress distributions at the center line of the GRS mass without considering CIS and with CIS under the maximum compaction pressures of 29 and 73 psi (200 and 500 kPa). The compaction operation was simulated by loading and unloading at different locations on the surface area of each lift. The residual lateral stresses were the differences between the lateral stresses with simulating CIS and those without CIS at the same location, as shown in figure 285 and figure 286.
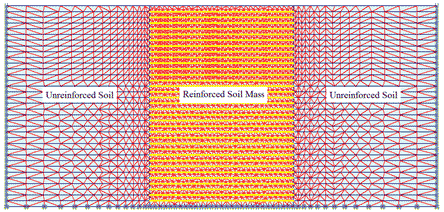
Figure 284. Illustration. FE mesh to simulate CIS in a reinforced soil mass.
1 m = 3.28 ft
1 kPa = 0.145 psi
Figure 285. Graph. Lateral stress distribution of a GRS mass from FE analyses with maximum vertical compaction pressures of 29 psi (200 kPa).
1 m = 3.28 ft
1 kPa = 0.145 psi
Figure 286. Graph. Lateral stress distribution of a GRS mass from FE analyses with maximum vertical compaction pressures of 72.5 psi (500 kPa).
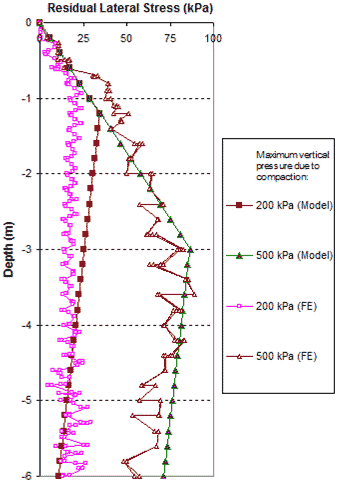
Comparisons of residual lateral stress distribution resulting from compaction pressures of 29 and 73 psi (200 and 500 kPa) between the CIS model and the FE analysis are shown in figure 287. The CIS calculated from the hand computation model are in good agreement with the values obtained from the FE analysis. Note that the residual lateral stresses in a GRS mass are higher under a higher vertical compaction pressure. In actual construction, the maximum vertical pressure of compaction is in the range of 29 to 73 psi (200 to 500 kPa). As shown in figure 287, the effects of CIS can be significant in actual construction. The zigzag of the FE analyses lines in figure 287 was caused by the thickness of compaction lift of 0.7 ft (0.2 m). A larger compaction lift indicates a larger amplitude of the zigzag, and the effect of CIS is smaller.
1 m = 3.28 ft
1 kPa = 0.145 psi
Figure 287. Graph. Comparison of residual lateral stresses of a GRS mass due to fill compaction between FE analysis with very fine mesh and the analytical model.
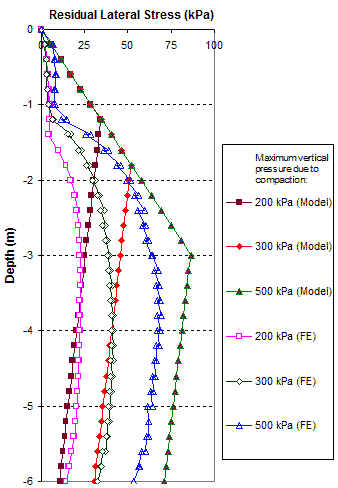
The FE analyses are more accurate with finer meshes, but the results for one curve from the FE analysis took more than 20 h of inputting data and running the program with a strong computer configuration (e.g., dual core 1.86 GHz, 3 GB RAM). Conversely, the analytical model is simple and can use hand calculations. To speed up the FE analysis process, a coarse mesh can be used with somewhat tolerated error. Figure 288 shows the comparison between FE results with a coarse mesh and the analytical model. The FE results were obtained from simulating the compaction operation by applying the compaction pressure over the entire surface area of the GRS mass at each compaction lift. Figure 287 and figure 288 show that the fine mesh should be used when analyzing GRS structures.
1 m = 3.28 ft
1 kPa = 0/145 psi
Figure 288. Graph. Comparison of residual lateral stresses of a GRS mass due to fill compaction between FE analysis with coarse mesh and the analytical model.