U.S. Department of Transportation
Federal Highway Administration
1200 New Jersey Avenue, SE
Washington, DC 20590
202-366-4000
Federal Highway Administration Research and Technology
Coordinating, Developing, and Delivering Highway Transportation Innovations
 | REPORT |  |
| This report is an archived publication and may contain dated technical, contact, and link information |
|
| Publication Number: FHWA-HRT-10-077 Date: July 2013 |
Publication Number: FHWA-HRT-10-077 Date: July 2013 |
Over the past two decades, GRS walls have gained increasing popularity in the United States and abroad. In actual construction, GRS walls have demonstrated a number of distinct advantages over the conventional cantilever and gravity retaining walls. Generally, GRS walls require less over-excavation and are more ductile, more flexible (hence more tolerant to differential settlement and to seismic loading), more adaptable to low permeability backfill, easier to construct, and significantly more economical than conventional Earth structures.(2–4)
A GRS wall comprises two major components: a facing element and a GRS mass. GRS wall facing elements have been constructed with different types of material and in different forms including wrapped geotextile facing, timber facing, modular concrete block facing, precast concrete panel facing, and cast-in-place rigid facing. Among the various facing types, modular concrete block facing has been the most popular in North America, mainly because of its ease of construction, availability, and low cost. The other component of a GRS wall, the GRS mass, is a compacted soil mass reinforced with layers of geosynthetic reinforcement. Figure 40 shows the schematic diagram of a typical GRS wall with a modular block facing.
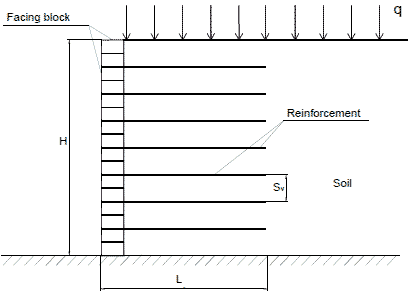
Figure 40. Illustration. Basic components of a GRS wall with a modular block facing.
Current design methods for GRS walls consider only the stresses and forces in the wall system. Even though a GRS wall with a modular block facing is a fairly flexible wall system, movement of the wall is not accounted for in current designs. A number of empirical and analytical methods have been proposed for estimating lateral movement of GRS walls. Although many full-scale experiments, numerical analyses, and field experience have clearly indicated the importance of facing rigidity on wall movement, most methods do not address the rigidity of the facing. (See references 49–52.)
The prevailing methods for estimating the maximum lateral displacement of GRS walls include the Federal Highway Administration (FHWA) method, the Geoservices method, the Colorado Transportation Institute (CTI) method, and the Jewell-Milligan method. (See references 2, 19, 53, and 54.) Among these methods, the Jewell-Milligan method has been found to give the closest agreement with FE analysis.(55) However, the method ignores the effect of facing rigidity. Strictly speaking, the method is only applicable to reinforced soil walls where there is little facing rigidity, such as a wrapped-faced GRS wall.
A study aimed at developing an analytical model for calculating lateral movement of a GRS wall with modular block facing was undertaken.(19) The analytical model is a modification to the Jewell-Milligan method by including the rigidity of facing element. This analytical model can be used in routine design by determining the required reinforcement strength for a limiting value of maximum allowable wall movement.
To verify the analytical model, the lateral wall displacements calculated by the analytical model were compared with the results of the Jewell-Milligan method for GRS walls with negligible facing rigidity.(19) In addition, the lateral wall displacements obtained from the analytical model were compared with the measured data of a full-scale experiment using a GRS wall with modular block facing.(16,17)
In addition to lateral displacement profiles, an equation for determining facing connection forces (i.e., the forces in reinforcement immediately behind the facing) is introduced.(19)
3.1 EXISTING METHODS FOR ESTIMATING MAXIMUM WALL MOVEMENTThe most prevalent methods for estimating the maximum lateral displacement of GRS walls are the FHWA method, the Geoservices method, the CTI method, and the Jewell-Milligan method. (See references 2, 19, 53, and 54.) A summary of each method is presented in this section.
The FHWA method correlates the reinforcement length/wall height (L/H) ratio with the lateral displacement of a reinforced soil wall during construction. Figure 41 shows the relationship between L/H and δR, the empirically derived relative displacement coefficient. Based on 20-ft (6-m)-high walls, the δR value increases by 25 percent for every 3 psi (20 kPa) of surcharge. For higher walls, the surcharge effect may be greater. The curve in figure 41 has been approximated by a fourth-order polynomial for 0.3 ≤ L/H ≤ 1.175, as shown in figure 42.
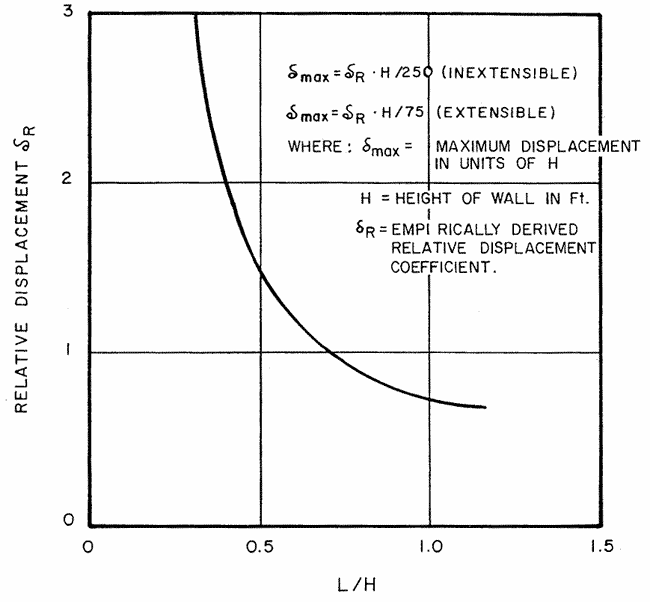
1 m = 3.28 ft
Figure 41. Graph. Empirical curve for estimating maximum wall movement during construction in the FHWA method. (53)
![]()
Figure 42. Equation. Relative displacement coefficient.
For extensible reinforcement, the maximum lateral wall displacement, δmax , can be calculated using figure 43 ( δmax is in units of wall height (H)).
![]()
Figure 43. Equation. Maximum lateral wall displacement during construction for extensible reinforcement.
The FHWA method was developed empirically by determining a displacement trend from numerical analysis and adjusting the curve to fit with field-measured data. The method provides a quick estimate of the maximum lateral displacement. Note that the maximum lateral displacement, δmax, as obtained from figure 43, has been corrected for a wall with a different height and surcharge.
The Geoservices method relies on limit equilibrium analyses to calculate the length of the required reinforcement to satisfy a suggested factor of safety with regard to three presumed external failure modes (e.g., bearing capacity failure, sliding, and overturning). The method provides a procedure for calculating the lateral wall displacement.
The lateral displacement is calculated by first choosing a strain limit for the reinforcement. This strain limit is usually less than 10 percent and depends on a number of factors, such as the type of wall facing, the displacement tolerances, and the type of geosynthetic to be used as reinforcement. Concrete facing panels, for example, would not allow much lateral displacement without showing signs of distress. Therefore, a low strain limit (1–3 percent) should be selected.
Geosynthetics have a wide range of material properties depending on, among other factors, the way they are manufactured. Non-woven geotextile exhibits low modulus characteristics. If such a geosynthetic was chosen as a reinforcement for a wall, design would necessarily imply that a large design strain is to be considered.
Once the strain limit has been selected, the method assumes a distribution of strain in the reinforcement, as shown in figure 44, for calculating wall movement.
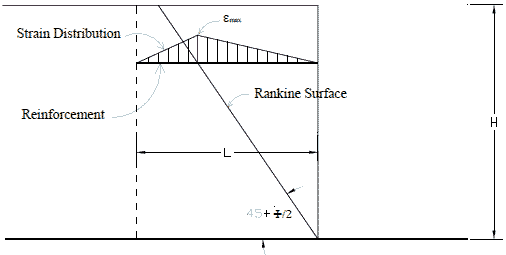
Figure 44. Illustration. Assumed strain distribution in the Geoservices method.(54)
The horizontal displacement, δh, is calculated as shown in figure 45.
![]()
Figure 45. Equation. Horizontal displacement.
Where:
εd = Strain limit ( εmax ).
L = Reinforcement length.
Differing from all other design methods based on ultimate strength of the geosynthetic reinforcement, the CTI method is a service-load-based design method. The reinforcement requirements are made in terms of stiffness at a design limit strain as well as the ultimate strength.
In most cases, the designer will select a design limit strain of 1–3 percent for the reinforcement. The maximum lateral displacement of a wall, δmax, can be estimated by the empirical equation in figure 46.
![]()
Figure 46. Equation. Maximum lateral wall displacement according to CTI method.
Where:
εd = Design limit strain (typically 1–3 percent for H less than or equal to 30 ft (0.9 m)).
H = Wall height.
If the maximum wall displacement exceeds a prescribed tolerance for the wall, a smaller design limit strain should be selected so that the maximum lateral displacement of the wall will satisfy the performance requirement. Figure 46 applies only to walls with very small facing rigidity, such as wrapped-faced walls. Walls with significant facing rigidity will have smaller maximum lateral displacement. For example, a modular block GRS wall will have δmax about 15 percent smaller than that calculated in figure 46.
Jewell and Jewell and Milligan proposed a procedure for calculating wall displacement based on analysis of stresses and displacements in a reinforced soil mass.(56,19) The method describes a link between soil stresses (stress fields) in a reinforced soil mass in which a constant mobilized angle of friction is assumed with the resulting displacements (velocity fields). There are two parameters for plane-strain plastic deformation of soil: the plane-strain angle of friction, Φps, and the angle of dilation, Ψ. The planes on which the maximum shearing resistance Φps is mobilized are called the “stress characteristics” and are inclined at (45° + φps / 2 ) to the direction of major principal stress, as shown in figure 47. The directions along which there is no linear extension strain in the soil are called the “velocity characteristics” and are inclined at (45° + Ψ / 2 ) to the direction of major principal stress, as shown in figure 47.
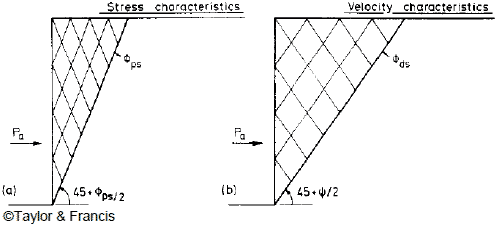
Figure 47. Illustration. Stress and velocity characteristics behind a smooth retaining wall rotating about the toe.(19)
Jewell and Milligan noted from limiting equilibrium analyses that there are three important zones in a reinforced soil wall, as illustrated in figure 48.(19) The boundary between zone 1 and 2 is at an angle (45° + Ψ / 2 ) to the horizontal, and the boundary between zone 2 and 3 is at an angle Φds. Large reinforcement forces are required in zone 1 to maintain stability across a series of critically inclined planes. In zone 2, the required reinforcement forces reduce progressively.
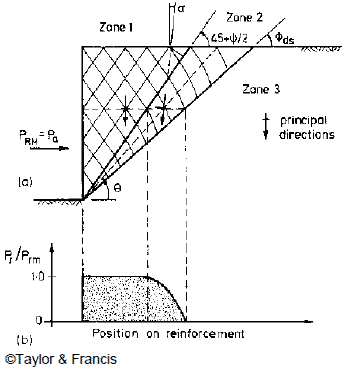
Figure 48. Illustration. Major zones of reinforcement forces in a GRS wall and the force distribution along reinforcement with ideal length.(19)
The assumptions of the Jewell-Milligan method for ideal length of reinforcement are as follows:
In figure 48, the maximum horizontal resultant force required for equilibrium, Prm , is equal to the active force Pa , as shown in figure 49.
![]()
Figure 49. Equation. Maximum horizontal resultant force required for equilibrium.
Where:
γ = Unit weight of the soil.
H = Wall height.
qs = Uniform surcharge.
Ka = The active Earth pressure coefficient, which can be expressed as shown in figure 50.

Figure 50. Equation. Active Earth pressure coefficient.
The required reinforcement force Pr in zone 2 at an angle θ, as shown in figure 48, can be estimated from the maximum reinforcement force, Prm, as shown in figure 51.
![]()
Figure 51. Equation. Ratio of the required reinforcement force and the estimated maximum reinforcement force.
The results of the displacement analyses have been presented in the form of design charts in figure 52. The charts can be used to determine the distribution of lateral wall displacement along the wall face for different values of mobilized internal friction, Φps, and angles of dilation, Ψ.
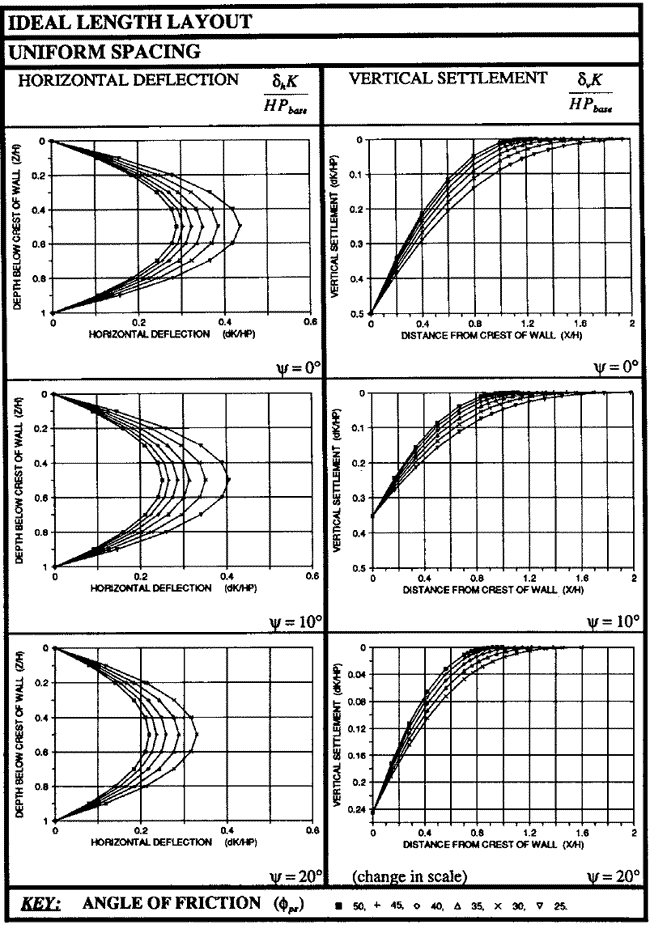
© Taylor & Francis
Figure 52. Illustration. Charts for estimating lateral displacement of GRS walls with the ideal length layout.(19)
To estimate the horizontal deflection at the GRS wall face for reinforcement with the ideal length and uniform spacing, the charts in figure 52 can be used. The horizontal deflection at the wall face depends on the wall height, H, the mobilized soil shearing resistance, Φds, the reinforcement force, Pr , and the reinforcement stiffness, K. Figure 52 can also be used to obtain a dimensionless factor, ![]() . The horizontal displacement, δh, can be calculated from this factor. The reinforcement occurs at the base of the wall, Pbase, in the dimensionless factor above. Pbase is calculated using figure 53.
. The horizontal displacement, δh, can be calculated from this factor. The reinforcement occurs at the base of the wall, Pbase, in the dimensionless factor above. Pbase is calculated using figure 53.
![]()
Figure 53. Equation. Reinforcement force at the base of the wall.
Jewell and Milligan presented design charts for estimating the deformation of reinforced soil walls where the rigidity of the facing can be ignored.(19) Rowe and Ho and Ho and Rowe pointed out that there is little variation in the reinforcement forces and the lateral wall deformation when L/H is equal to or greater than 0.7.(50,57,58) Note that L/H = 0.7 is commonly used in practice and is suggested by AASHTO.(59) Based on a series of numerical analyses of GRS walls, Rowe and Ho also showed that the maximum lateral deformation obtained by the Jewell-Milligan method with an ideal reinforcement length, as defined by Jewell and Milligan, is generally in good agreement with the numerical results for L/H = 0.7.(19,50) For this reason, the Jewell-Milligan method can be used to estimate lateral movement of a reinforced soil wall with L/H greater than or equal to 0.7. The analytical model developed in this study for GRS walls with modular block facing was based on the Jewell-Milligan method.
The derivation of the analytical model is provided in the following sections. It presents the derivation of the equations in the Jewell-Milligan method for predicting deformation of a reinforced soil wall with negligible facing rigidity, provides the derivation of the equations for determining connection forces in the reinforcement for walls with modular block facing, and provides equations for calculating lateral movement of GRS walls with modular block facing.
Figure 54 shows the three major zones in a GRS wall and the force distribution in the reinforcement at depth zi used by Jewell and Milligan to develop an analytical model for determination of wall deformation.(19) Jewell and Milligan presented design charts based on the analytical model (without giving the derivation).(19) The following derivation is presented for completeness and for easier reference when showing the derivation of the analytical model developed for this study.
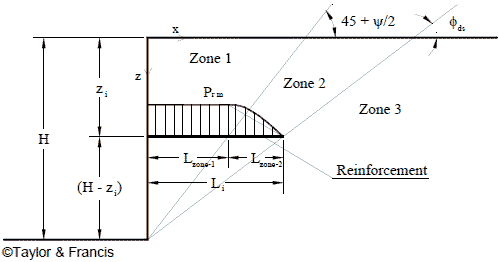
Figure 54. Illustration. Major zones of the reinforcement force in a GRS wall.(19)
The horizontal movement, Δh, of the wall face at depth zi can be evaluated using figure 55 through figure 57.
![]()
Figure 55. Equation. Horizontal movement.

Figure 56. Equation. Lateral deformation in zone 1.

Figure 57. Equation. Lateral deformation in zone 2.
Where:
Kreinf = Stiffness of the reinforcement.
Prm = Maximum reinforcement force at depth zi.
Lzone-1 = Reinforcement length in zone 1 at depth zi.
Lzone-2 = Reinforcement length in zone 2 at depth zi.
Substituting figure 56 and figure 57 into figure 55 results in figure 58.
![]()
Figure 58. Equation. Total horizontal movement of the wall face.
Substituting figure 59 and figure 60 into figure 58 results in figure 61.
![]()
Figure 59. Equation. Reinforcement length in zone 1.
![]()
Figure 60. Equation. Reinforcement length in zone 2.

Figure 61. Equation. Total horizontal movement of the wall face substituting the components derived in figure 59 and figure 60.
Rearranging figure 61 results in figure 62 and figure 63.

Figure 62. Equation. Rearrangement of total horizontal movement of the wall face.

Figure 63. Equation. Factored down total horizontal movement of the wall face.
The value of Δh, the lateral displacement of a GRS wall at depth zi, can be calculated directly from figure 64.
![]()
Figure 64. Equation. Simplified horizontal movement of the wall face.
Where:
Kreinf = Stiffness of the reinforcement.
Prm = Maximum reinforcement force at depth zi.
H = Wall height.
Φds = Effective direct shear friction angle of soil.
Ψ = Angle of dilation of soil.
The connection forces in figure 64 are defined as the forces in the reinforcement at the back face of the wall facing. The assumptions made for the determination of the connection forces include the following:
Consider the reinforcement at depth, zi, sandwiched between two adjacent facing blocks, as shown in figure 65. The frictional forces, F, above and below these blocks are Fi-1 and Fi+1. The horizontal resultant force of lateral Earth pressure acting on the two facing blocks is Pi. The tensile connection force in the reinforcement is Ti, Wi is the weight of the facing at location at depth Zi, Ni is the normal force, and Sr is the reference spacing.
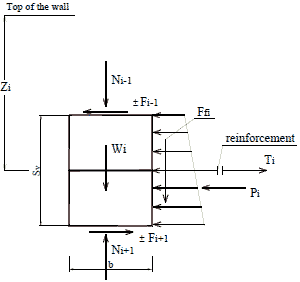
Figure 65. Illustration. Forces acting on two facing blocks at depth zi.
The tensile connection force, Ti, in the reinforcement is shown in figure 66. Pi is calculated using figure 67.
![]()
Figure 66. Equation. Tensile connection force.
![]()
Figure 67. Equation. Horizontal resultant force of lateral Earth pressure acting on the two facing blocks.
If Pi ± (Fi+l - Fi-l) < 0, Ti should be set equal to 0, as geosynthetic reinforcement can resist only tensile forces (i.e., Ti is always greater than or equal to 0).
From figure 65, figure 68 to figure 70 are derived.
![]()
Figure 68. Equation. Tensile connection force substituting the components derived in
figure 67.
Where Ni+1 and Ni-1 are normal forces on the top and the bottom of the two adjacent blocks.
![]()
Figure 69. Equation. Tensile connection force solved in terms of the weight of the facing block and friction between the soil and wall facing.
Or
![]()
Figure 70. Equation. Simplified tensile connection force.
Where:
Ffi = Frictional resultant force between wall facing and soil.
γb = Unit weight of facing block.
b = Width of facing block.
Sv = Reinforcement spacing.
δ = Friction angle between modular block facing elements (δ can be the friction angle between facing blocks if there is no reinforcement between the blocks, or it can be the friction angle between facing block and geosynthetic if there is reinforcement sandwiched between blocks).
β = Friction angle between back face of wall and soil.
![]() = Average net Earth pressure acting on the facing due to Earth pressure on the facing and the pressure caused by the reinforcement force. The value of
= Average net Earth pressure acting on the facing due to Earth pressure on the facing and the pressure caused by the reinforcement force. The value of ![]() can be estimated as shown in figure 71.
can be estimated as shown in figure 71.
![]()
Figure 71. Equation. Average net Earth pressure on the facing.
Substituting figure 71 into figure 70, Ti, the connection force at depth zi, can be determined as shown in figure 72 and figure 73.
![]()
Figure 72. Equation. Tensile connection force at a given depth.
![]()
Figure 73. Equation. Tensile connection force substituting figure 67.
Therefore, the tensile connection force in the reinforcement at depth zi can be expressed as shown in figure 74.
![]()
Figure 74. Equation. Tensile connection force as a simplification of figure 73.
Note that if the friction between the back face of the wall facing and the soil behind the wall is ignored, the connection force at depth zi is as shown in figure 75.
![]()
Figure 75. Equation. Tensile connection force ignoring the effect of fiction between the back of the block and soil.
Calculating the reinforcement connection forces in a GRS wall with modular block facing by a simple equation can eliminate a considerable amount of work designing a GRS wall. In designing GRS walls with segmental facing, the connection forces are involved. A series of experimental tests to measure the connection forces were conducted by many researchers. According to the results, if the blocks are heavy and well connected, the GRS walls with block facing would perform very well.(16,17) The values of the connection forces can be estimated by using figure 76 for a typical GRS wall with modular block facing.
![]()
Figure 76. Equation. Connection force for a typical GRS wall with modular block facing.
The resistant connection force at depth zi at facing can be estimated using figure 77.
![]()
Figure 77. Equation. Resistant connection force.
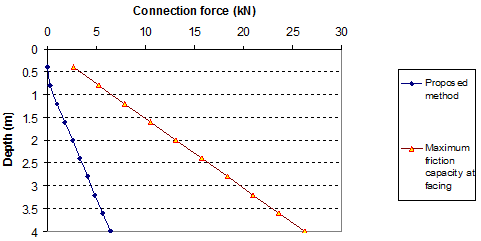
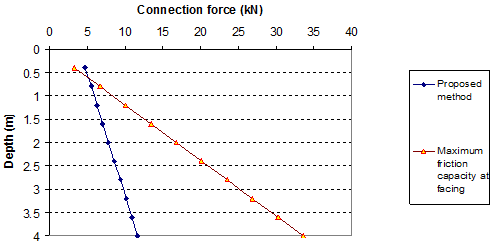
Comparisons of connection forces and maximum friction capacity at facing blocks are shown in figure 78 and figure 79.
1 kN = 224.81 lbf
1 m = 3.28 ft
Figure 78. Graph. Connection forces in reinforcement (q = 0 kip/ft (0 kN/m)) (wall data from section 3.3.1 with Ψ = 15 degrees).
1 kN = 224.81 lbf
1 m = 3.28 ft
Figure 79. Graph. Connection forces in reinforcement (q = 3.4 kip/ft (50 kN/m)) (wall data from section 3.3.1 with Ψ = 15 degrees)
Figure 78 and figure 79 show the values of connection forces with the maximum connection friction forces with a surcharge of 0 and 3.4 kip/ft (0 and 50 kN/m). For most of the cases, the lightweight blocks (without strong key connections between blocks) can be used for GRS walls. With the heavy surcharge, some blocks at the top of the wall may be unstable, as shown in figure 79.
From figure 64 and figure 76, the displacement of a GRS wall with modular block facing at depth zi can be determined by figure 80.
![]()
Figure 80. Equation. Lateral displacement of a GRS wall with modular block facing.
Figure 80 is theanalytical model in this study. When the frictional resistance between the back face of the wall facing and the soil can be ignored, the displacement of the wall at depth zi will reduce to figure 81.
![]()
Figure 81. Equation. Lateral displacement of a GRS wall with modular block facing ignoring the effect of fiction between the back of the block and soil.
Note that the lateral movement calculated by figure 81 will be slightly larger than that calculated by figure 80.
The analytical model for estimating wall movement can also be used to determine the required reinforcement strength for a limiting value of maximum lateral wall movement (e.g., 2 inches (50 mm) or 1 percent of wall height, whichever is smaller) for any given backfill strength properties. The required reinforcement strength, Trequired, can be determined from the maximum allowable lateral movement at the wall face, Δmax, as shown in figure 82.

Figure 82. Equation. Required tensile reinforcement strength at a given allowable lateral movement of the wall face.
Figure 82 applies to any facing rigidity because the force T is related only to Δmax and is unaffected by the facing rigidity.
3.3 VERIFICATION OF THE ANALYTICAL METHODTo verify the analytical model developed in this study, the model calculation results were first compared to the Jewell-Milligan method for GRS walls with negligible facing rigidity. The model calculation results were then compared to measured data from a full-scale experiment.
The model calculation results of wall movement from the analytical model were first compared to the results of the Jewell-Milligan method using an example.(19) The conditions of the wall in this example are as follows:
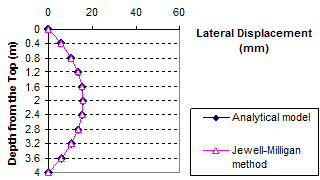
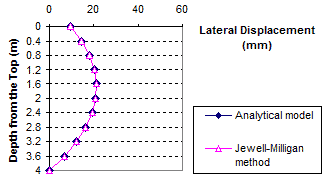
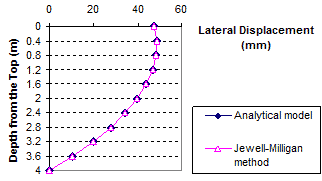
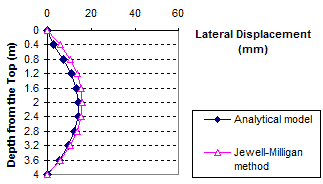
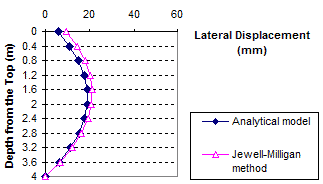
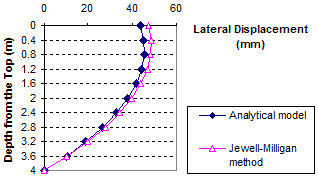
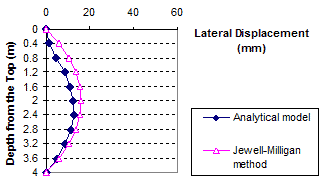
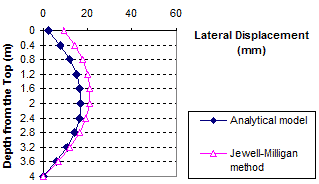
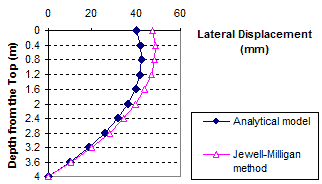
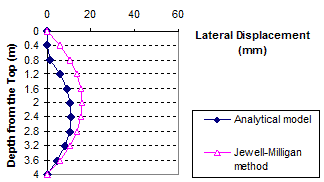
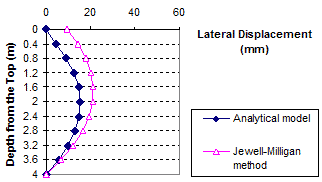
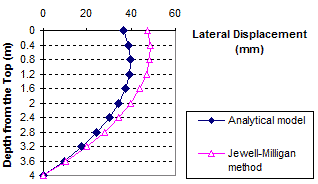
The results of the comparisons between the analytical model and the Jewell-Milligan method are shown in figure 83 through figure 94 for different weights of facing blocks (unit weight of block γb= 0, 0.06, 0.13, and 0.19 kip/ft3 (0, 10, 20, and 30 kN/m3)), each with different values of surcharge pressure (q = 0, 0.7, and 3.4 kip/ft (0, 10, or 50 kN/m)). The value q = 0.7 kip/ft (10 kN/m) represents a typical surcharge for highway design. These figures indicate that for all facing conditions (i.e., for different values of γb ), the effect of surcharge on wall movement is significant. The deformed shape of the wall face is different at q = 0 and 3.4 kip/ft (0 and 50 kN/m). At q = 0 kip/ft (0 kN/m), the wall bulges at mid-height, but as the surcharge increases, the top of the wall face begins to move outward. At q = 3.4 kip/ft (50 kN/m), the largest wall movement occurs near the top of the wall.
1 m = 3.28 ft
1 mm = 0.039 inches
Figure 83. Graph. Lateral displacement calculated by the Jewell-Milligan method and the analytical model, γb = 0 kip/ft3 (0 kN/m3), q = 0 kip/ft (0 kN/m)
1 m = 3.28 ft
1 mm = 0.039 inches
Figure 84. Graph. Lateral displacement calculated by the Jewell-Milligan method and the analytical model, γb = 0 kip/ft3 (0 kN/m3), q = 0.7 kip/ft (10 kN/m)
1 m = 3.28 ft
1 mm = 0.039 inches
Figure 85. Graph. Lateral displacement calculated by the Jewell-Milligan method and the analytical model, γb = 0 kip/ft3 (0 kN/m3), q = 3.4 kip/ft (50 kN/m)
1 m = 3.28 ft
1 mm = 0.039 inches
Figure 86. Graph. Lateral displacement calculated by the Jewell-Milligan method and the analytical model, γb = 0.06 kip/ft3 (10 kN/m3), q = 0 kip/ft (0 kN/m)
1 m = 3.28 ft
1 mm = 0.039 inches
Figure 87. Graph. Lateral displacement calculated by the Jewell-Milligan method and the analytical model, γb = 0.06 kip/ft3 (10 kN/m3), q = 0.7 kip/ft (10 kN/m)
1 m = 3.28 ft
1 mm = 0.039 inches
Figure 88. Graph. Lateral displacement calculated by the Jewell-Milligan method and the analytical model, γb = 0.06 kip/ft3 (10 kN/m3), q = 3.4 kip/ft (50 kN/m)
1 m = 3.28 ft
1 mm = 0.039 inches
Figure 89. Graph. Lateral displacement calculated by the Jewell-Milligan method and the analytical model, γb = 0.13 kip/ft3 (20 kN/m3), q = 0 kip/ft (0 kN/m)
1 m = 3.28 ft
1 mm = 0.039 inches
Figure 90. Graph. Lateral displacement calculated by the Jewell-Milligan method and the analytical model, γb = 0.13 kip/ft3 (20 kN/m3), q = 0.7 kip/ft (10 kN/m)
1 m = 3.28 ft
1 mm = 0.039 inches
Figure 91. Graph. Lateral displacement calculated by the Jewell-Milligan method and the analytical model, γb = 0.13 kip/ft3 (20 kN/m3), q = 3.4 kip/ft (50 kN/m)
1 m = 3.28 ft
1 mm = 0.039 inches
Figure 92. Graph. Lateral displacement calculated by the Jewell-Milligan method and the analytical model, γb = 0.19 kip/ft3 (30 kN/m3), q = 0 kip/ft (0 kN/m)
1 m = 3.28 ft
1 mm = 0.039 inches
Figure 93. Graph. Lateral displacement calculated by the Jewell-Milligan method and the analytical model, γb = 0.19 kip/ft3 (30 kN/m3), q = 0.7 kip/ft (10 kN/m)
1 m = 3.28 ft
1 mm = 0.039 inches
Figure 94. Graph. Lateral displacement calculated by the Jewell-Milligan method and the analytical model, γb = 0.19 kip/ft3 (30 kN/m3), q = 3.4 kip/ft (50 kN/m)
As shown in figure 83 through figure 85, when the facing block is weightless (i.e., unit weight γb = 0 kip/ft3 (0 kN/m3)), the analytical model gives nearly identical lateral wall movement to the Jewell-Milligan method. This is to be expected because facing rigidity is ignored in the Jewell-Milligan method. The figures show that as the facing blocks becomes heavier (i.e., unit weight increases), the wall movement becomes smaller. When a heavy facing block ( γb = 0.19 kip/ft3 (30 kN/m3)) is used, the maximum lateral wall movement can be as much as 35 percent smaller than a wall with negligible facing rigidity.
A full-scale experiment of a GRS wall with modular block facing is one of a series of laboratory experiments conducted by Hatami and Bathurst and was referred to as “wall 1” by the authors.(16,17) The parameters of the GRS wall are as follows:
Because the analytical model requires that the direct shear friction angle be used in model calculations and assumes a vertical wall face, the direct shear friction angle of the soil and the facing batter factor were determined before using the analytical model to evaluate the lateral movement of the facing.
The direct shear friction angle was calculated as shown in figure 95.
![]()
Figure 95. Equation. Direct shear friction angle
The empirical facing batter factor, Φfb, was calculated from Allen and Bathurst, with facing batter of 8 degrees, as shown in figure 96.(60)

Figure 96. Equation. Empirical facing batter factor.
Where:
Kabh = The horizontal component of the active Earth pressure coefficient accounting for wall face batter.
Kavh = The horizontal component of the active Earth pressure coefficient for a vertical wall.
d = Constant coefficient.
Allen and Bathurst found that the value of d = 0.5 would yield the best fit for available Tmax data and recommended using d = 0.5 for determining Φfb.(60)
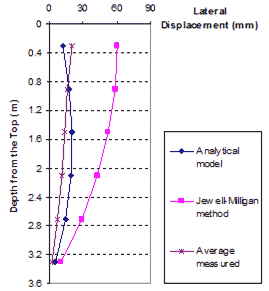
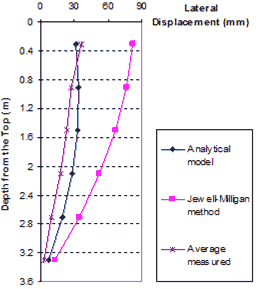
Figure 97 and figure 98 show lateral movement of the GRS wall under surcharge pressures of 3.4 and 4.8 kip/ft (50 and 70 kN/m), respectively, for the mean value of measured displacement, the Jewell-Milligan method, and the analytical model.(17) The figures show that the lateral movement calculated by the analytical model is in close agreement with the measured values. Lateral wall movement given by the analytical model agrees much better with the measured values than that calculated by the Jewell-Milligan method for both surcharge pressures. The lateral movement obtained by the Jewell-Milligan method was as much as 3.5 times as large as the measured movement. Note that the analytical model, not unlike the Jewell-Milligan method, produced a displacement profile that had lower bending stiffness than the measured profile. However, considering that the analytical model is a simplified model, the simulation is adequate.
1 m = 3.28 ft
1 mm = 0.039 inches
Figure 97. Graph. Measured lateral displacements with Jewell-Milligan method and analytical model, q = 3.4 kip/ft (50 kN/m)
1 m = 3.28 ft
1 mm = 0.039 inches
Figure 98. Graph. Measured lateral displacements with Jewell-Milligan method and analytical model, q = 4.8 kip/ft (70 kN/m)
3.4 SUMMARY
An analytical model was developed to predict the profile of lateral movement of a GRS wall with modular block facing. The connection forces in the reinforcement can also be determined by a simple equation. The equation for the lateral movement can also be used in design where the required reinforcement strength can be determined for a prescribed value of maximum allowable lateral wall movement for a given backfill condition. The analytical model has been verified through comparisons with the Jewell-Milligan method. The Jewell-Milligan method is a special case of the analytical model for GRS walls with negligible facing rigidity. Comparisons were also made with a full-scale experiment of a GRS wall with modular block facing. The analytical model offers a simple and improved tool for predicting lateral movement of a GRS wall with modular block facing.