U.S. Department of Transportation
Federal Highway Administration
1200 New Jersey Avenue, SE
Washington, DC 20590
202-366-4000
Federal Highway Administration Research and Technology
Coordinating, Developing, and Delivering Highway Transportation Innovations
 | REPORT |  |
| This report is an archived publication and may contain dated technical, contact, and link information |
|
| Publication Number: FHWA-HRT-10-077 Date: July 2013 |
Publication Number: FHWA-HRT-10-077 Date: July 2013 |
The understanding of GSGC behavior in reinforced soil structures has been lacking. As a result, current design methods have considered the geosynthetic layers simply as added tensile elements and have failed to account for the interaction between soil and geosynthetics. A series of GSGC laboratory tests were designed and conducted to examine the behavior of a GSGC with varying spacing and strength of reinforcement, provide test data for verifying the analytical model for calculating strength properties of a GRS composite as described in chapter 5, and provide test data for calibration of an FE model for a GRS mass. The GSGC tests were conducted at TFHRC in McLean, VA.
4.1 DIMENSIONS OF THE PLANE-STRAIN GSGC TEST SPECIMENA soil mass reinforced by layers of geosynthetic reinforcement is not a uniform mass. To investigate the behavior of GSGCs by conducting laboratory tests, it is necessary to determine the proper dimensions of the test specimen so that the test provides an adequate representation of GSGC behavior.
A number of factors were considered prior to determining the test specimen dimensions of the GSGC test, including the following:
Using Plaxis Version 8.2, a series of FE analyses were conducted to examine the effect of specimen dimensions on the resulting global stress-strain and volume change relationships of the composites. The objective of the FE analyses was to determine proper dimensions of a GSGC that will produce load-deformation behavior sufficiently close to that of a large mass of soil-geosynthetic composite, referred to as the reference composite.
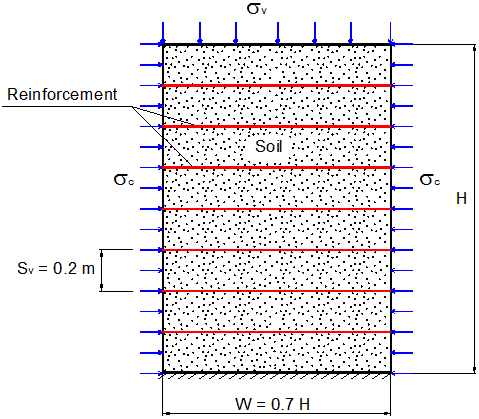
Figure 99 shows the typical geometric and loading conditions of the GSGC tests. The reference GSGC is taken as a reinforced soil mass with dimensions of 23 ft (7.0 m) high and 16 ft (4.9 m) wide in a plane-strain condition. Four different dimensions of GSSCs were analyzed with varying specimen heights (23, 6.6, 3.3, and 1.6 ft (7.0, 2.0, 1.0 and 0.5 m), while the width of the test specimen was kept as 0.7 × H. In these analyses, the soil was a dense sand. The sand was reinforced by a medium-strength woven geotextile (Geotex® 4×4) at 0.7 ft (0.2 m) vertical spacing. Table 2 lists the conditions and properties of the soil and reinforcement used in the analyses.
1 m =3.28 ft
Figure 99. Illustration. Typical geometric and loading conditions of a GSGC.
Table 2. Conditions and properties of the backfill and reinforcement used in FE analyses.
| Element | Description |
| Soil | A dense sand where unit weight = 17 kN/m3; cohesion = 5 kPa; angle of internal friction ( Φ ) = 38 degrees; angle of dilation ( Ψ ) = 8 degrees; soil modulus (E50 ) = 40,000 kPa; and Poisson’s ratio = 0.3 |
| Reinforcement | Geotex® 4×4 axial stiffness (EA) = 1,000 kN/m; ultimate strength (Tult) = 70 kN/m; and reinforcement spacing = 0.2 m |
| Confining pressure | Constant confining pressures of 0 and 30 kPa |
|
1 kN/m3 = 0.006 kip/ft3 |
|
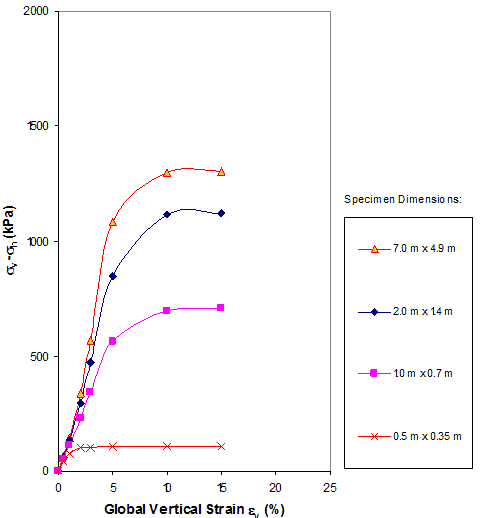
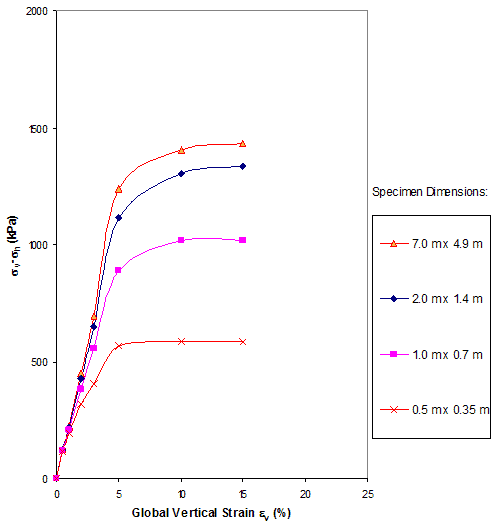
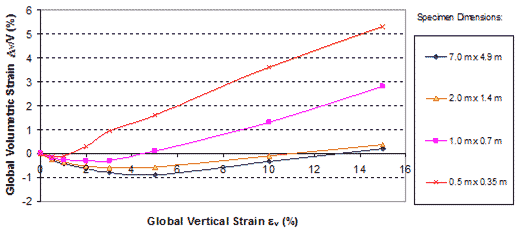
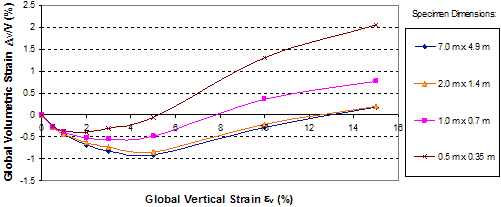
The global stress-strain curves obtained from the analyses are shown in figure 100 and figure 101 for confining pressures ( σc ) of 0 and 4.4 psi (0 and 30 kPa), respectively (a confining pressure of 4.4 psi (30 kPa) is representative of the lateral stress at the mid-height of a 23-ft (7.0-m)-high wall). The corresponding global volume change curves are shown in figure 102 and figure 103. The global vertical strain ( εv ) was calculated by figure 104.
1 kPa = 0.145 psi
1 m = 3.28 ft
Figure 100. Graph. Global stress-strain curves for GSGCs of different dimensions under a confining pressure of 0 psi (0 kPa).
1 kPa = 0.145 psi
1 m = 3.28 ft
Figure 101. Graph. Global stress-strain curves for GSGCs of different dimensions under a confining pressure of 4.4 psi (30 kPa).
1 m = 3.28 ft
Figure 102. Graph. Global volume change curves for GSGCs of different dimensions under a confining pressure of 0 psi (0 kPa).
1 m = 3.28 ft
Figure 103. Graph. Global volume change curves for GSGCs of different dimensions under a confining pressure of 4.4 psi (30 kPa).
![]()
Figure 104. Equation. Global vertical strain
Where:
ΔH = Total vertical displacement of the specimen.
H = Initial height of the specimen.
Figure 100 and figure 101 indicate that a composite with a height of 6.6 ft (2.0 m), width of 4.6 ft (1.4 m), and confining pressure of 4.4 psi (30 kPa) yielded stress-strain and volume change relationships that were sufficiently close to those of the reference composite. Specimen sizes with heights of 3.3 and 1.6 ft (1.0 and 0.5 m) appeared too small to provide an adequate representation of the reference composite.
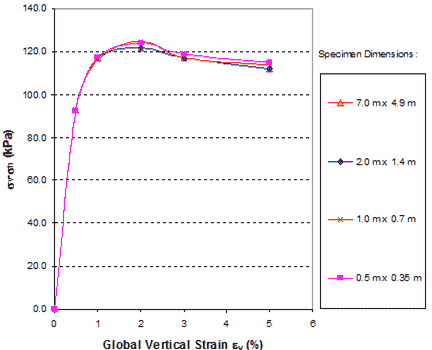
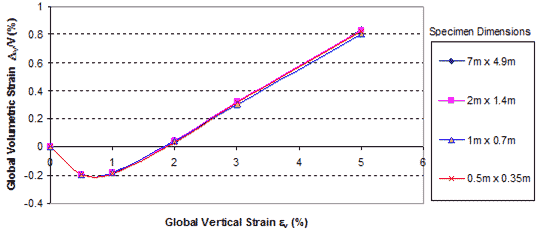
For comparison, additional analyses were conducted on unreinforced soil. Figure 105 and figure 106 show the global stress-strain curves and global volume change curves of the soil masses without any reinforcement for the different specimen dimensions. The results indicate that a specimen height as small as 1.6 ft (0.5 m) will yield nearly the same stress-strain and volume change relationships as the reference soil mass of height 23 ft (7.0 m) when reinforcement is not present.
1 kPa = 0.145 psi
1 m = 3.28 ft
Figure 105. Graph. Global stress-strain curves of unreinforced soil under a confining pressure of 4.4 psi (30 kPa).
1 m = 3.28 ft
Figure 106. Graph. Global volume change curves of unreinforced soil under a confining pressure of 4.4 psi (30 kPa).
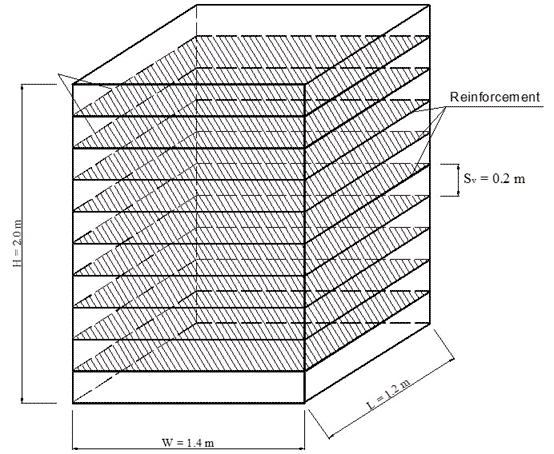
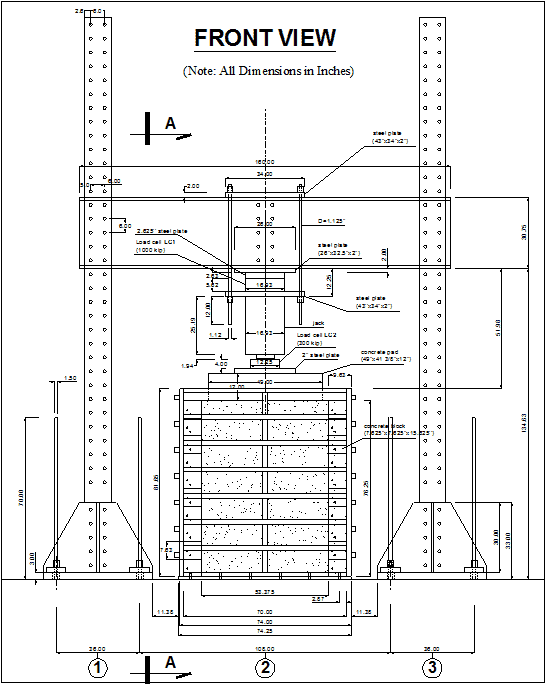
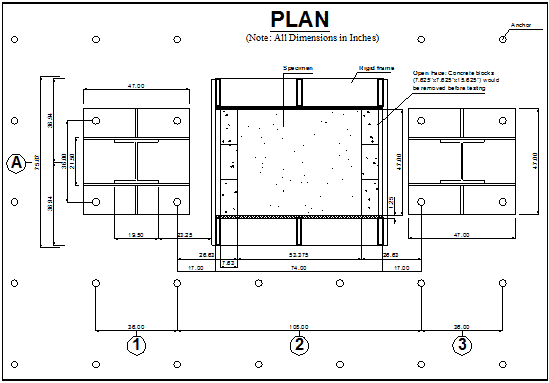
Based on the results of the FE analyses, a specimen height of 6.6 ft (2.0 m) and depth of 4.6 ft (1.4 m) with 0.7-ft (0.2-m) reinforcement spacing was selected for the GSGC tests. The actual specimen dimensions for the GSGC tests are shown in figure 107. Figure 108 and figure 109 show the front and plan views of the GSGC test setup.
1 m = 3.28 ft
Figure 107. Illustration. Specimen dimensions for the GSGC tests.
1 mm = 0.039 inches
Figure 108. Illustration. Front view of the test setup.
1 mm = 0.039 inches
Figure 109. Illustration. Plan view of the test setup.
To maintain a plane-strain condition for the GSGC specimens throughout the tests, two major factors were considered: (1) the test bin needed to be sufficiently rigid to have negligible lateral deformation in the longitudinal direction (i.e., the length direction) and (2) the friction between the backfill and the side panels of the test bin needed to be minimized to nearly zero.
Five GSGC masses were tested inside a test bin. The test bin was designed to experience little deformation for a surcharge pressure up to 410 psi (2,800 kPa). The test bin is shown in figure 110.
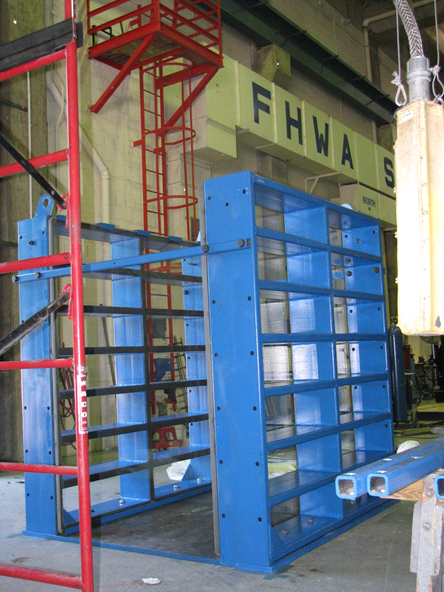
Figure 110. Photo. Test bin.
Two transparent Plexiglas® panels were attached inside the steel tubing frame to form the side surfaces of the test bin. To minimize the friction between the Plexiglas® and the backfill in these surfaces, a lubrication layer was created on the inside surfaces of the Plexiglas® panels. The lubrication layer consisted of a 0.02-inch (0.5-mm)-thick latex membrane and an approximately 0.04-inch (1 mm)-thick lubrication agent (Dow Corning® 4 Electrical Insulating Compound NSF 6). This procedure has been used successfully in many plane-strain tests conducted by Tatsuoka and his associates at University of Tokyo and by the lead author of this paper in many large-scale experiments. (See references 64–68.) The friction angle between the lubricant layer and the Plexiglas®, as determined by direct shear test, was less than 1 degree.
4.3 TEST MATERIALThe backfill and geotextile reinforcement employed in the tests are described in the following sections.
The backfill was a crushed diabase from a source near Washington, DC. Before conducting the GSGC tests, a series of laboratory tests was performed to determine the properties of the backfill, including the following:
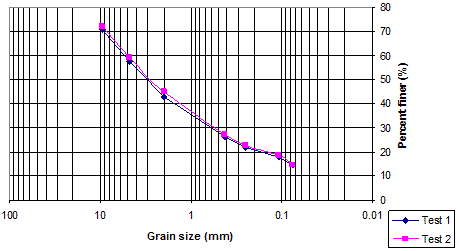
A summary of some index properties is given in table 3. The grain size distribution of the soil is shown in figure 111. Two gradation tests were performed, and the results agreed well with each other.
Table 3. Summary of index properties of backfill.
| Classification | Well-Graded Gravel: Soil Classification A-1a per AASHTO M-15 and Soil Classification GW-GM per ASTM D 2487(69,70) |
| Maximum dry unit weight | 0.15 kip/ft3 (24.1 kN/m3) |
| Optimum moisture content | 5.2 percent |
| Specific gravity of soil solids | 3.03 |
1 mm = 0.039 inches
Figure 111. Graph. Grain size distribution of backfill.
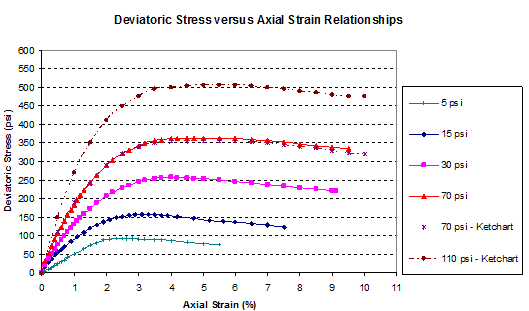
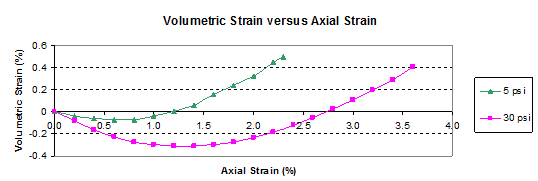
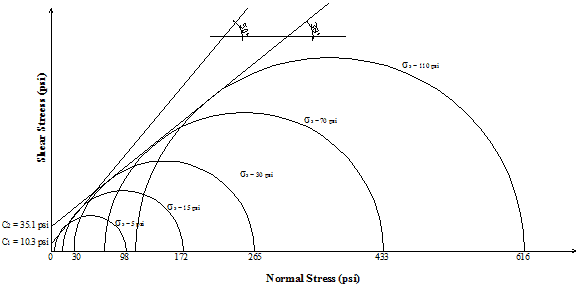
Four triaxial tests were conducted at confining pressures of 5, 15, 30, and 70 psi (34, 103, 207, and 482 kPa), and the results were compared with those performed at the University of Colorado Denver on the same soil. The soil specimen was approximately 6 inches (152 mm) in diameter and 12 inches (305 mm) in height. The shapes of a typical specimen before and after failure are shown in figure 112 and figure 113, respectively. Figure 114 and figure 115 present the stress-strain and volume change curves of the tests. The stress-strain curves obtained by Ketchart and Wu are included for comparison and to furnish a more complete set of data.(68) The stress-strain relationships agree well in trend with those by Ketchart and Wu.(68) The Mohr-Coulomb failure envelopes of the backfill are shown in figure 116. For confining pressures between 0 and 30 psi (0 and 103 kPa), the strength parameters are c = 10.3 psi (71.0 kPa) and Φ = 50 degrees. For confining pressures between 30 and 110 psi (103 and 758 kPa), the strength parameters are c = 35.1 psi (242 kPa) and Φ = 38 degrees.
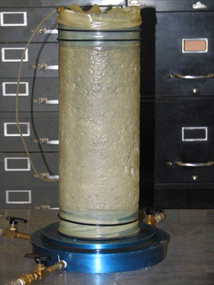
Figure 112. Photo. Typical triaxial test specimen before test.
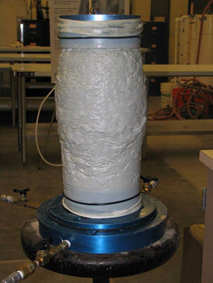
Figure 113. Photo. Typical triaxial test specimen after test.
1 kPa = 0.145 psi
Figure 114. Graph. Triaxial test results: stress-strain curves of backfill at 0.15 kip/ft3 (24.1 kN/m3) dry density and 5.2 percent moisture.
1 kPa = 0.145 psi
Figure 115. Graph. Triaxial test results: volume change curves of backfill at confining pressures of 5 and 30 psi (34.45 and 103.35 kPa).
1 kPa = 0.145 psi
Figure 116. Graph. Mohr-Coulomb failure envelopes of backfill.
The geosynthetic used in the experiments was Geotex® 4×4 manufactured by Propex® (formally known as Amoco 2044). This geosynthetic is a woven polypropylene geotextile. Table 4 shows its strength properties as provided by the manufacturer.
Table 4. Summary of Geotex® 4×4 properties.
| Property | Test Method | Machine Direction (i.e., Wrap Direction) |
Cross Direction (i.e., Fill Direction) |
| Tensile strength (grab) |
ASTM D4632(71) | 0.6 kip (2.67 kN) |
0.5 kip (2.22 kN) |
| Wide-width tensile ultimate strength |
ASTM D4595(72) | 400 lb/inch (70 kN/m) |
400 lb/inch (70 kN/m) |
| Wide-width strength at 5 percent strain |
ASTM D4595(72) | 121 lb/inch (21 kN/m) |
217 lb/inch (38 kN/m) |
| Wide-width ultimate elongation |
ASTM D4595(72) | 10 percent | 10 percent |
| Puncture | ASTM D4833(73) | 170 lb (0.8 kN) | |
| Trapezoid tearing strength |
ASTM D4533(74) | 250 lb (1.11 kN) | |
Two types of geosynthetics were used for the experiments: a single sheet of Geotex® 4×4 and a double sheet Geotex® 4×4 (by gluing two sheets together using 3M® Super 77 spray adhesive). The double sheet was used to create a geosynthetic that was approximately twice as stiff (and as strong) while maintaining the same interface condition as that of the single-sheet geosynthetic. Geotex® 4×4 geotextile has been used in the construction of hundreds of GRS walls and in many full-scale experiments, including the FHWA GRS pier, Havana Yard Test abutment and pier, Blackhawk preloaded GRS bridge abutment, and National Cooperative Highway Research Program test abutments. (See references 6 and 75–77.)
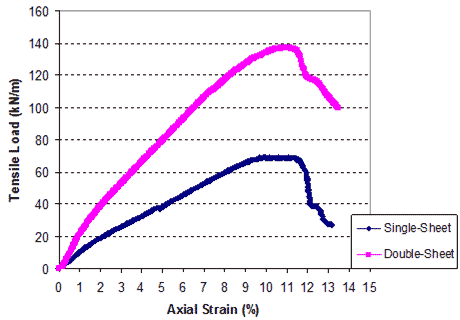
Uniaxial tension tests were performed on both types of geosynthetic to determine the load-deformation behavior using a specimen 12 inches (305 mm) wide and 6 inches (152 mm) long (see figure 117). The stiffness and strength of the two geosynthetics are shown in table 5, and load-deformation curves are shown in figure 118. The stiffness and strength of the double-sheet Geotex® 4×4 were approximately twice as much as those of the single-sheet Geotex® 4×4 with the breakage strain almost the same.
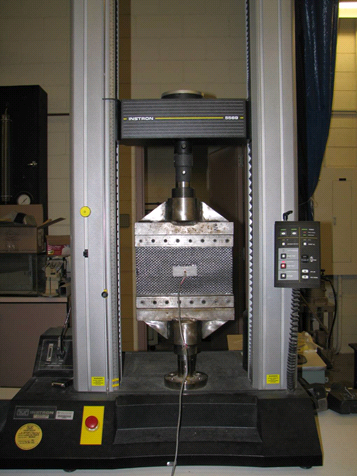
Figure 117. Photo. Uniaxial tension test of Geotex® 4×4
Table 5. Properties of Geotex® 4×4 in fill direction.
| Geosynthetic | Wide-Width Tensile Strength per ASTM D4595(72) | |
| Stiffness (kN/m) at 1 Percent Strain |
Ultimate Strength (kN/m) (Percent at Break) |
|
| Single-sheet Geotex® 4×4 | 1,000 | 70 (12 percent) |
| Double-sheet Geotex® 4×4 | 1,960 | 138 (12 percent) |
1 kN/m = 0.069 kip/ft |
||
1 kN/m = 68.52 lbf/ft
Figure 118. Graph. Load deformation curves of the geosynthetics.
Blocks used for the facing of the GSGC mass during specimen preparation were hollow concrete blocks with dimensions of 15.625 by 7.625 by 7.625 inches (397 by 194 by 194 mm) and an average weight of 40 lb/block (18.1 kg/block).
4.4 TEST PROGRAMThe test program comprised five GSGC tests. Their test conditions are shown in table 6. The plate compactor used for the tests (MBW GP1200) had a weight of 120 lb (54 kg), plate dimensions of 12 by 21 inches (305 by 533 mm), centrifugal force of 1,500 lbf (6,700 N), rotation speed of 5,000 vibrations/min, and moving speed of 70 ft/min (21 m/min).
Table 6. Test program for GSGC tests.
| Test Designation | Geosynthetic Reinforcement | Confining Pressure (kPa) |
Wide-Width Strength of Reinforcement (kN/m) |
Reinforcement Spacing, Sv (m) |
| Test 1 | None | 34 | None | No reinforcement |
| Test 2 | Geotex® 4×4 | 34 | 70 | 0.2 |
| Test 3 | Double-sheet Geotex® 4×4 | 34 | 140 | 0.4 |
| Test 4 | Geotex® 4×4 | 34 | 70 | 0.4 |
| Test 5 | Geotex® 4×4 | 0 (unconfined) | 70 | 0.2 |
1 kPa = 0.145 psi |
||||
4.5 TEST CONDITIONS AND INSTRUMENTATION
The vertical loads were applied to the test specimens by using a 1,000,000-lb- (454,000-kg)-capacity loading frame with a 1,000,000-lb (454,000-kg) hydraulic jack. Loads were measured by load cells and by hydraulic jack pressure gauges. For test 1, two load cells of 100,000 and 300,000 lb (45,400 and 136,200 kg) were used to measure the loads. For tests 2 through 5, a 1,000,000-lb (454,000-kg) load cell was used to measure the loads. A 12-inch (305-mm)-thick concrete pad was placed on top of the specimen before loading. Vertical loads were applied in equal increments with 10 min of elapsed time between increments to allow for equilibrium. The elapsed time also allowed manual recording of displacements of the test specimen. The vertical loads were applied until a failure condition was reached to determine the strength of the composite specimen. The applied pressures on the composite specimens were determined from the applied vertical loads divided by the surface areas of the composite specimens.
The confining pressure on the test specimens was applied by vacuuming. The entire surface area of the test specimen was vacuum-sealed with a 0.02-inch (0.5-mm)-thick latex membrane. A prescribed confining pressure of 5 psi (34 kPa) was applied for tests 1 through 4 by connecting the latex membrane to a suction device through two 0.234-inch (6-mm)-diameter flexible plastic tubes. Only test 5 was conducted without confining pressure.
The specimens were instrumented to monitor their performance during tests. The instruments used include the following:
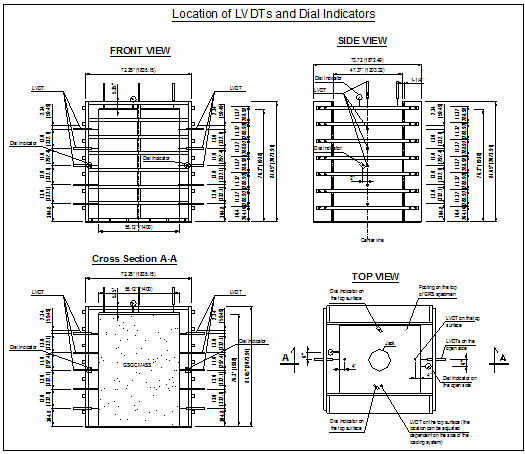
Figure 119. Illustration. Locations of LVDTs and digital dial indicators.
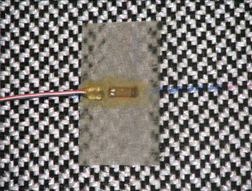
Figure 120. Photo. Strain gauge on Geotex® 4×4 geotextile before applying protection tape.
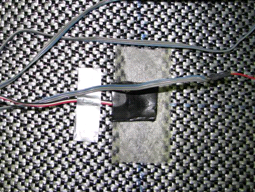
Figure 121. Photo. Strain gauge on Geotex® 4×4 geotextile after applying protection tape.
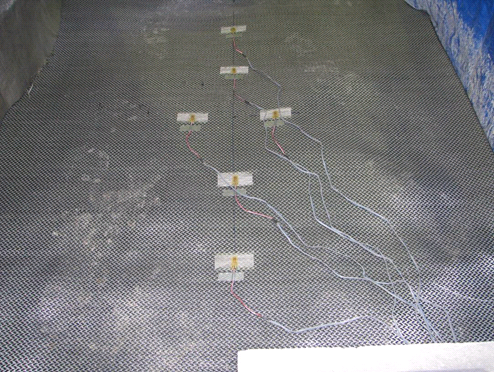
Figure 122. Photo. Strain gauges mounted on Geotex® 4×4 geotextile.
Due to the presence of the lightweight geotextile patch, calibration of the strain gauge was needed. The calibration tests were performed to relate the strain obtained from the strain gauge to the actual strain of the reinforcement. Figure 123 and figure 124 show the calibration curves along the fill direction of Geotex® 4×4 geotextile for the single-sheet and double-sheet specimens, respectively.
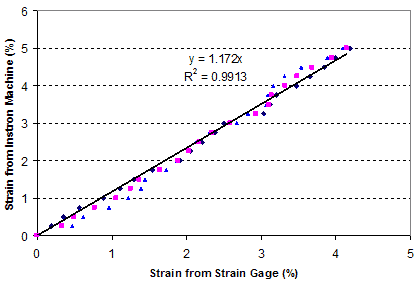
Figure 123. Graph. Calibration curve for single-sheet Geotex® 4×4.
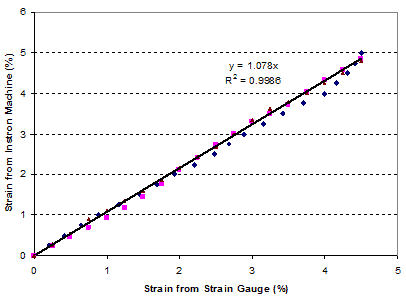
Figure 124. Graph. Calibration curve for double-sheet Geotex® 4×4.
The preparation procedure of a typical composite mass with the dimensions of 6.6 by 4.6 by 3.9 ft (2.0 by 1.4 by 1.2 m) is as follows:
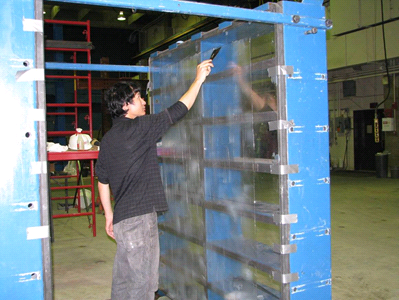
Figure 125. Photo. Applying grease on Plexiglas® surfaces.
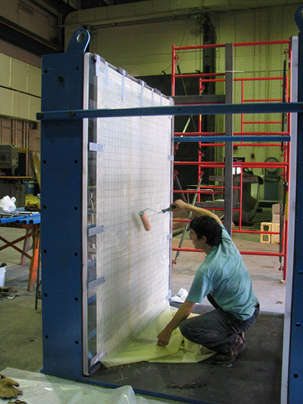
Figure 126. Photo. Attaching membrane.
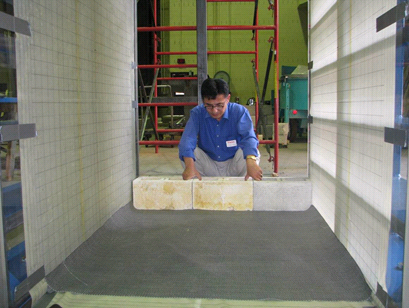
Figure 127. Photo. Placement of the first course of facing block.
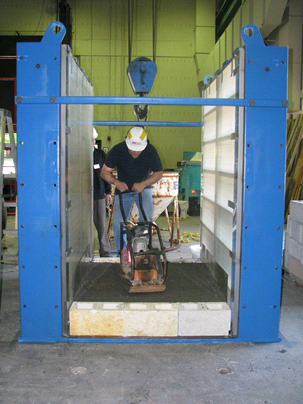
Figure 128. Photo. Compacting the first lift of backfill.
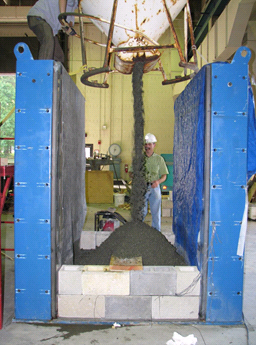
Figure 129. Photo. Placing backfill for the second lift.
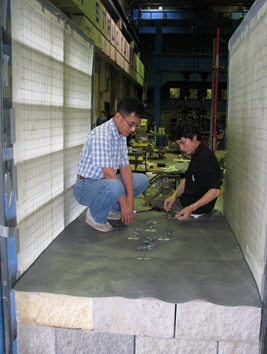
Figure 130. Photo. Placing a reinforcement sheet.
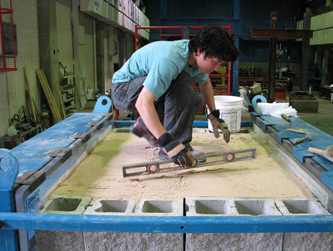
Figure 131. Photo. Completion of compaction of the composite mass and leveling the top surface with 0.2-inch (5-mm)-thick sand layer.
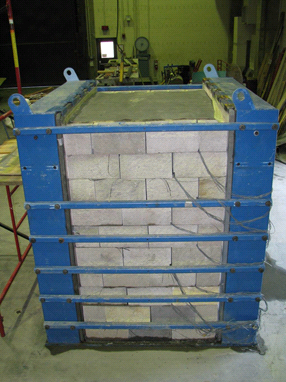
Figure 132. Photo. Completed composite mass with a geotextile sheet on the top surface.
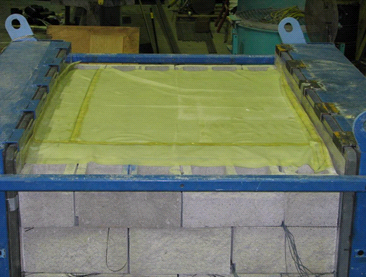
Figure 133. Photo. Top surface of the composite mass covered with a sheet of membrane.
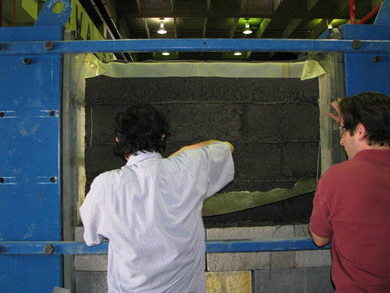
Figure 134. Photo. Removing facing blocks and trimming off excess geosynthetic reinforcement.
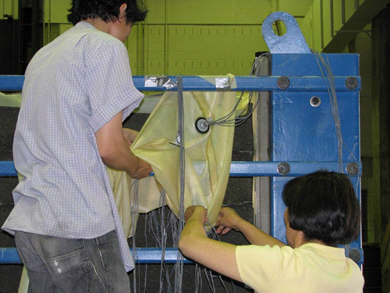
Figure 135. Photo. Inserting strain gauge cables through the membrane sheet.
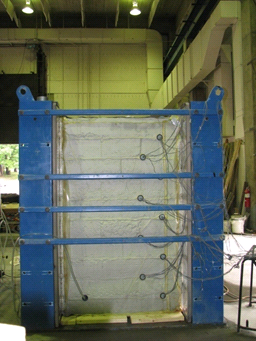
Figure 136. Photo. Vacuuming the composite mass with a low pressure.
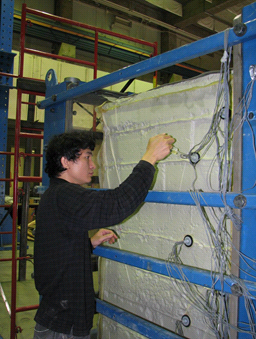
Figure 137. Photo. Sealing the connection between cable and membrane with epoxy to prevent air leaks.
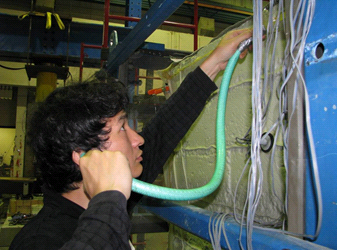
Figure 138. Photo. Checking air leaks under vacuuming.
Table 7. Dimensions of the GSGC specimens before loading.
| Test | Height, inches (m) |
Width, inches (m) |
Length, inches (m) |
| Test 1 | 76.25 (1.937) | 57.00 (1.448) | 47.00 (1.194) |
| Test 2 | 76.35 (1.939) | 54.00 (1.372) | 46.75 (1.187) |
| Test 3 | 76.35 (1.939) | 53.00 (1.346) | 46.75 (1.187) |
| Test 4 | 76.30 (1.938) | 58.75 (1.492) | 46.75 (1.187) |
| Test 5 | 76.35 (1.939) | 49.00 (1.245) | 46.75 (1.187) |
Figure 139 shows the LVDTs to monitor the lateral movement of a test specimen. The locations of the selected points for the tests are depicted in figure 140. The measured dry unit weights of five tests are shown in figure 141.
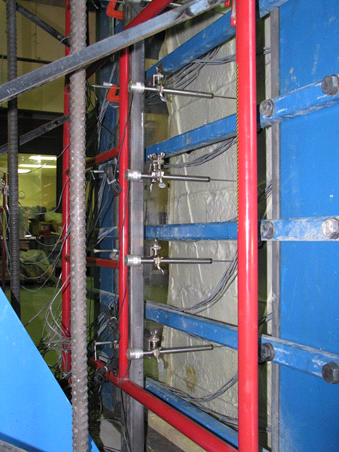
Figure 139. Photo. The LVDTs on an open side of test specimen.
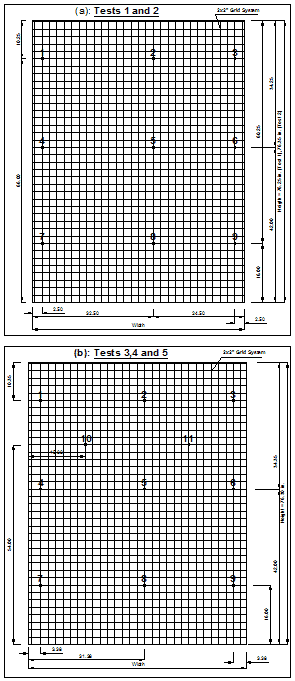
1 mm = 0.039 inches
Figure 140. Illustration. Locations of selected points to trace internal movement of tests 1–5.
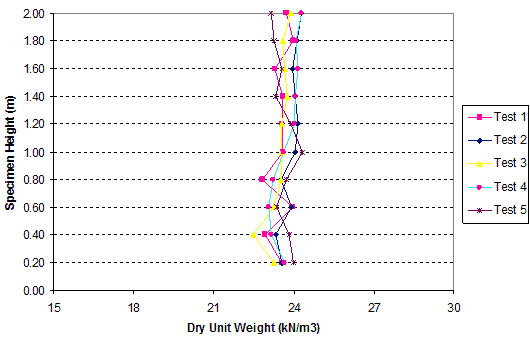
1 m = 3.28 ft
1 kN/m3 = 0.006 kip/ft3
Figure 141. Graph. Soil dry unit weight results during specimen preparation.
4.6 TEST RESULTS
Test 1 is perhaps the largest plane-strain test for soil with a confining pressure. It was conducted as the baseline for the other four GSGC tests.
The loading sequence of the soil mass was as follows:
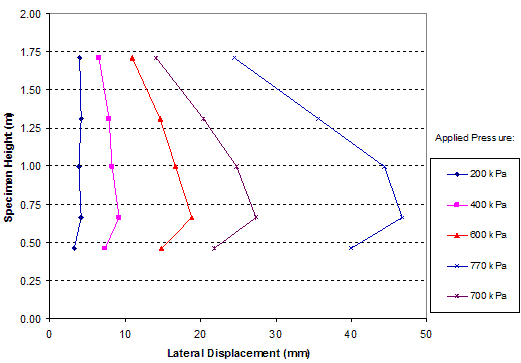
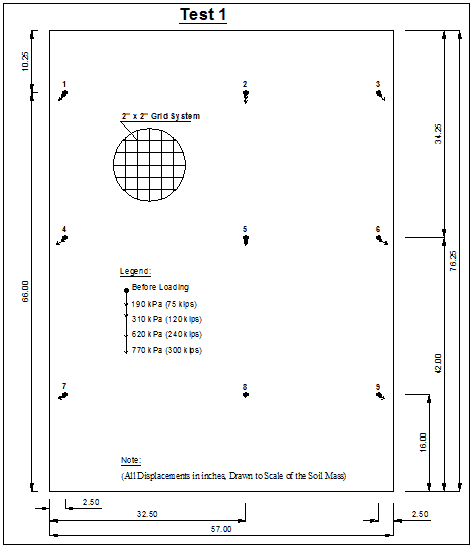
The soil mass at failure is shown in figure 142. Figure 143 shows the global vertical stress-strain relationship, and figure 144 shows the volume change relationships of the soil mass. The average lateral displacements on the open faces of the soil mass under different vertical stresses, measured by LVDTs, are presented in figure 145. The internal displacements of the soil at selected points under vertical applied pressures of 28, 45, 90, and 110 psi (190, 310, 620, and 770 kPa) are shown in figure 146. The test 1 results for unreinforced soil are summarized in table 8.
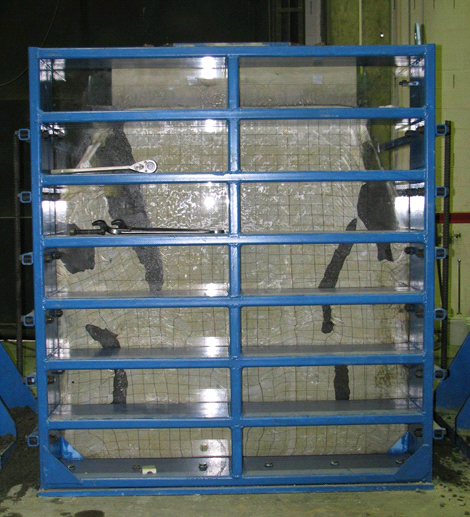
Figure 142. Photo. Soil mass at failure of test 1.
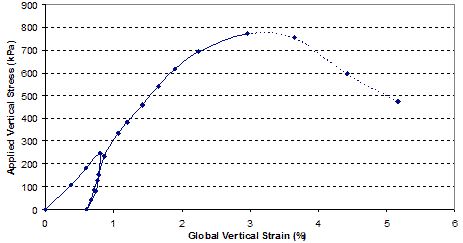
1 kPa = 0.145 psi
Figure 143. Graph. Test 1 unreinforced soil mass global vertical stress/vertical strain relationship.
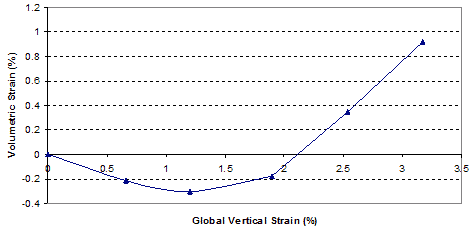
Figure 144. Graph. Test 1 unreinforced soil mass global volume change strain relationship.
1 m = 3.28 ft
1 kPa = 0.145 psi
Figure 145. Graph. Lateral displacements on the open face of test 1.
1 N = 0.00022 kip
1 mm = 0.039 inches
Figure 146. Illustration. Internal displacements of test 1.
Table 8. GSGC test 1 result summary.
| Parameter | Measurement | |
| Test condition | Geosynthetic reinforcement | None |
| Wide-width strength of reinforcement | None | |
| Reinforcement spacing | No reinforcement | |
| Confining pressure | 34 kPa | |
Test results |
Applied stress at vertical strain of 1 percent | 335 kPa |
| Ultimate applied pressure | 770 kPa | |
| Vertical strain at failure | 3 percent | |
| Maximum lateral displacement of the open face at failure | 47 mm | |
| Stiffness at 1 percent vertical strain (Eat 1%) | 33,500 kPa | |
| Stiffness for unloading-reloading (Eur) | 87,100 kPa | |
| 1 mm = 0.039 inches 1 kPa = 0.145 psi |
||
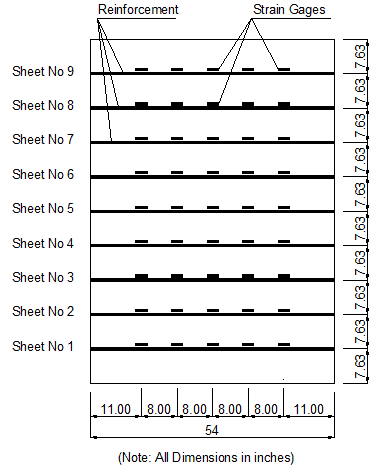
In the second test, the GSGC mass was reinforced by nine sheets of single-sheet Geotex® 4×4 with spacing of 0.7 ft (0.2 m). The soil layer was compacted at 0.7-ft (0.2-m)-thick lifts. Each reinforcement sheet was mounted with 54 strain gauges.
The failure load in this test was 1,000,000 lb (454,000 kg). All nine reinforcement sheets were ruptured after testing. The composite mass after testing is shown in figure 147. The shear bands of the composite mass after testing are visible through the diagonal lines of the mass (see figure 147 and figure 148). Along the shear bands, the square grids of 2 by 2 inches (51 by 51 mm) were severely distorted after testing (see figure 148). These shear bands correspond exactly with the failure surfaces shown in figure 149.
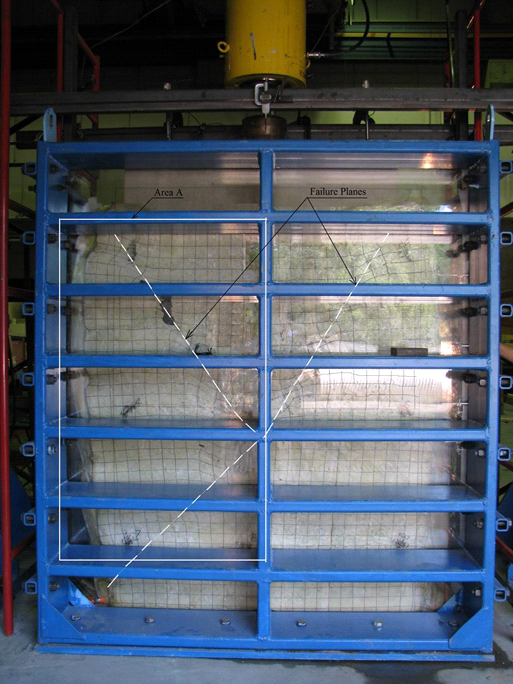
Figure 147. Photo. Composite mass at failure of test 2.
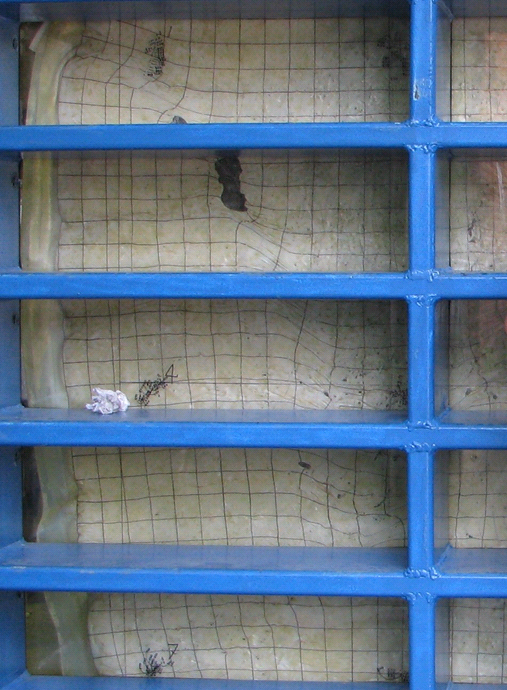
Figure 148. Photo. Close-up of shear bands at failure of area A in figure 147.
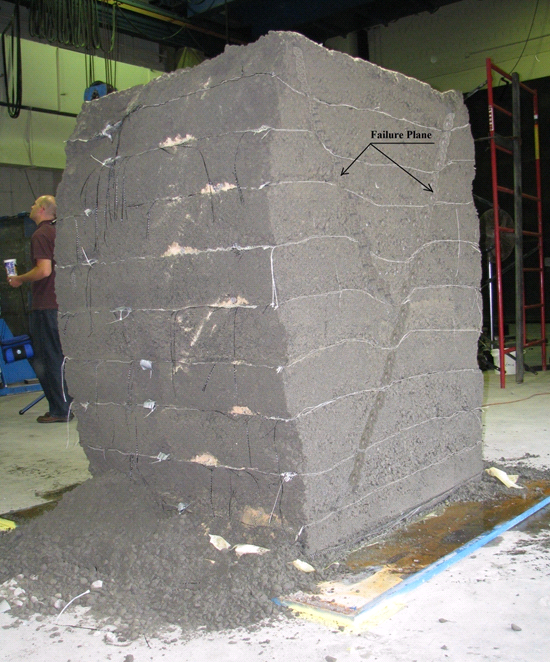
Figure 149. Photo. Failure planes of the composite mass after testing in test 2.
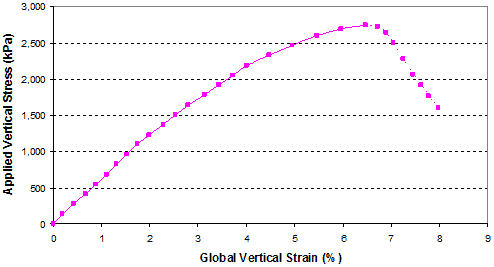
The measured data from test 2 were as follows:
1 kPa = 0.145 psi
Figure 150. Graph. Test 2 reinforced soil mass global vertical stress-vertical strain relationship.
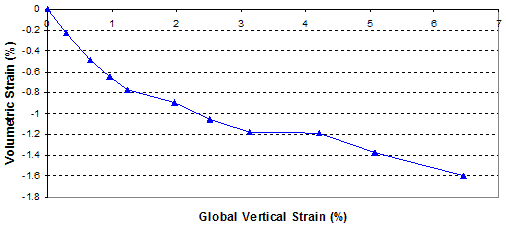
Figure 151. Graph. Test 2 reinforced soil mass global volume change strain relationship.
1 m = 3.28 ft
1 mm = 0.039 inches
1 kPa = 0.145 psi
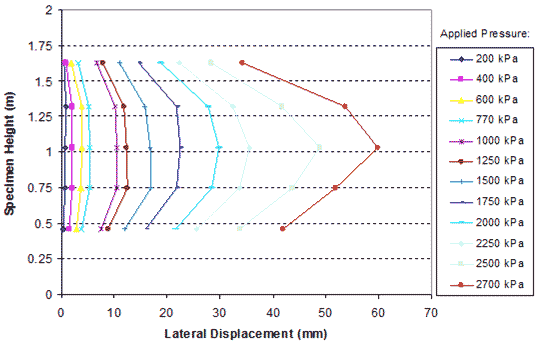
Figure 152. Graph. Lateral displacements on the open face of test 2.
1 mm = 0.039 inches
1 kPa = 0.145 psi
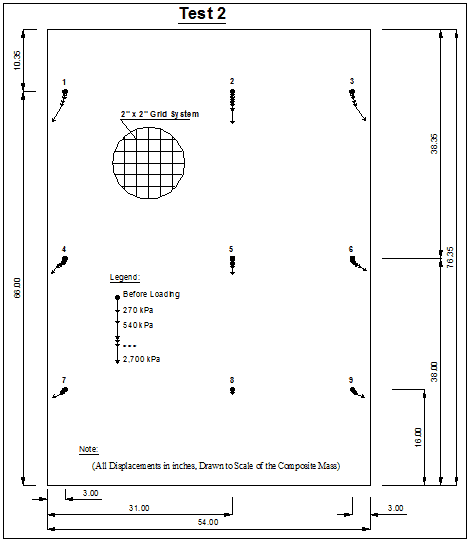
Figure 153. Illustration. Internal displacements of test 2.
1 mm = 0.039 inches
Figure 154. Illustration. Locations of strain gauges on geosynthetic sheets in test 2.
1 m = 3.28 ft
1 kPa = 0.145 psi
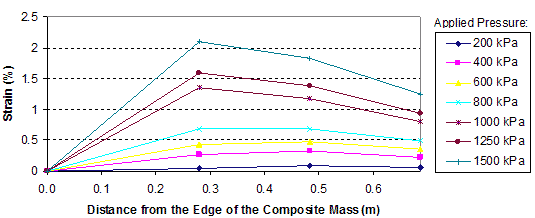
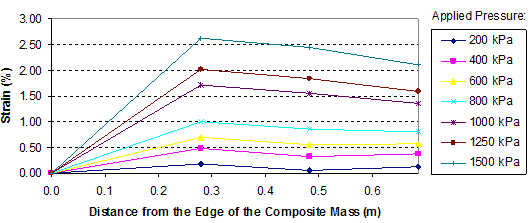
Figure 155. Graph. Reinforcement strain distribution of the composite mass in layer 1 of test 2 0.7 ft (0.2 m) from the base.
1 m = 3.28 ft
1 kPa = 0.145 psi
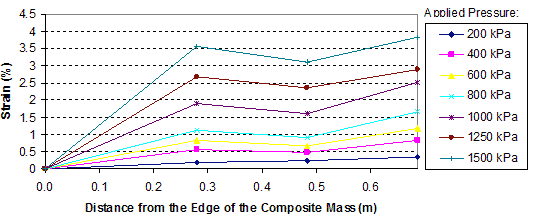
Figure 156. Graph. Reinforcement strain distribution of the composite mass in layer 2 of test 2 1.3 ft (0.4 m) from the base.
1 m = 3.28 ft
1 kPa = 0.145 psi
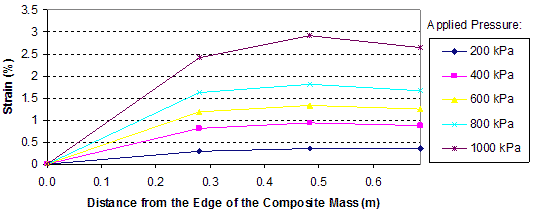
Figure 157. Graph. Reinforcement strain distribution of the composite mass in layer 3 of test 2 2 ft (0.6 m) from the base.
1 m = 3.28 ft
1 kPa = 0.145 psi
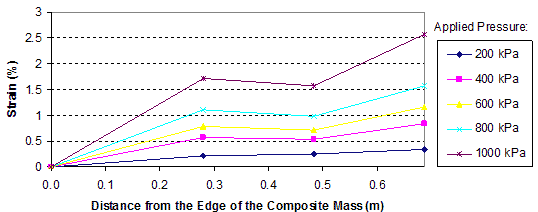
Figure 158. Graph. Reinforcement strain distribution of the composite mass in layer 4 of test 2 2.6 ft (0.8 m) from the base.
1 m = 3.28 ft
1 kPa = 0.145 psi
Figure 159. Graph. Reinforcement strain distribution of the composite mass in layer 5 of test 2 3.3 ft (1.0 m) from the base.
1 m = 3.28 ft
1 kPa = 0.145 psi
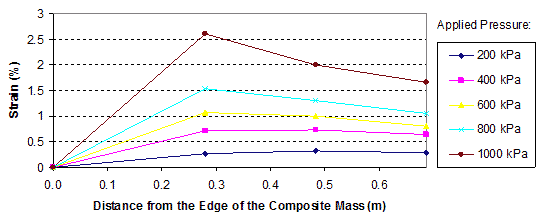
Figure 160. Graph. Reinforcement strain distribution of the composite mass in layer 6 of test 2 3.9 ft (1.2 m) from the base.
1 m = 3.28 ft
1 kPa = 0.145 psi
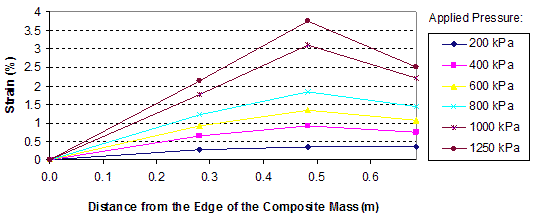
Figure 161. Graph. Reinforcement strain distribution of the composite mass in layer 7 of test 2 4.6 ft (1.4 m) from the base.
1 m = 3.28 ft
1 kPa = 0.145 psi
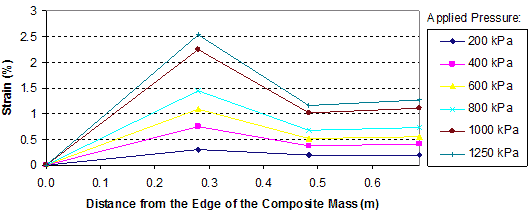
Figure 162. Graph. Reinforcement strain distribution of the composite mass in layer 8 of test 2 5.2 ft (1.6 m) from the base.
1 m = 3.28 ft
1 kPa = 0.145 psi
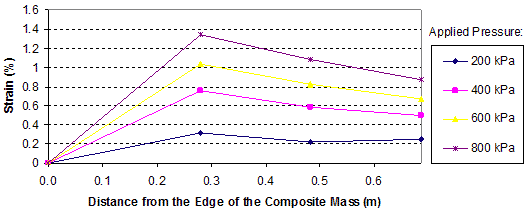
Figure 163. Graph. Reinforcement strain distribution of the composite mass in layer 9 of test 2 5.9 ft (1.8 m) from the base.
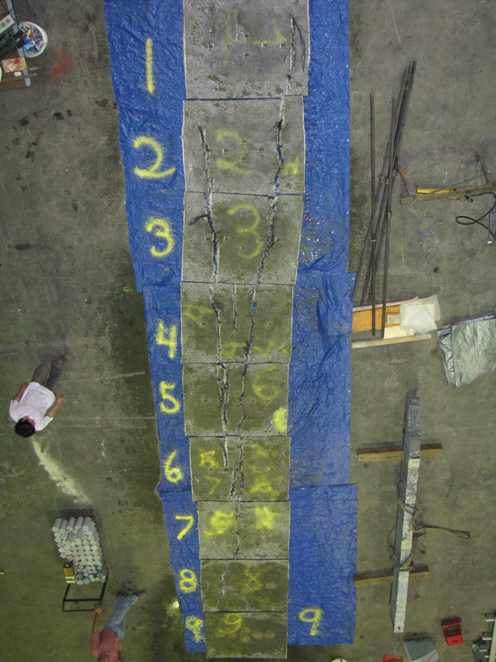
Figure 164. Photo. Aerial view of the reinforcement sheets exhumed from the composite mass after test 2 (numbers indicate sheet number).
1 mm = 0.039 inches
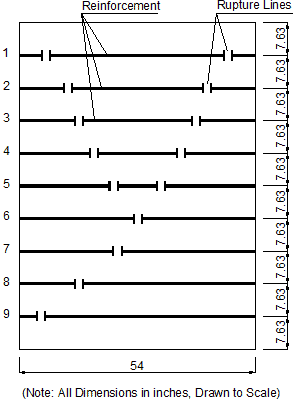
Figure 165. Illustration. Locations of rupture lines of reinforcement in test 2 based on figure 164.
The results of test 2 are summarized in table 9.
Table 9 . GSGC test 2 results summary.
| Parameter | Measurement | |
| Test condition | Geosynthetic reinforcement | Geotex® 4×4 |
| Wide-width strength of reinforcement | 70 kN/m | |
| Reinforcement spacing | 0.2 m | |
| Confining pressure | 34 kPa | |
Test results |
Ultimate applied pressure | 2,700 kPa |
| Vertical strain at failure | 6.5 percent | |
| Maximum lateral displacement of the open face at failure | 60 mm | |
| Stiffness at 1 percent vertical strain (Eat 1%) | 61,600 kPa | |
| Maximum strain in reinforcement at ruptured | 12 percent | |
| Maximum measured strain in reinforcement | 4.0 percent | |
| 1 kN/m = 0.069 kip/ft 1 m = 3.28 ft 1 kPa = 0.145 psi 1 mm = 0.039 inches |
||
In this test, the GSGC mass was reinforced by four double sheets of Geotex® 4×4 at a 1.31-ft (0.4-m) spacing. The strength and stiffness of the double-sheet reinforcement were nearly doubled compared to those of the single-sheet reinforcement used in test 2. The GSGC mass after testing is shown in figure 166.
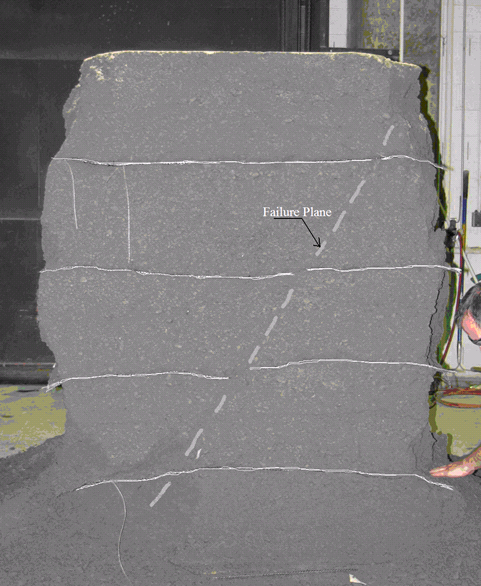
Figure 166. Photo. Composite mass after testing of test 3.
The measured data of test 3 were as follows:
1kPa = 0.145 psi
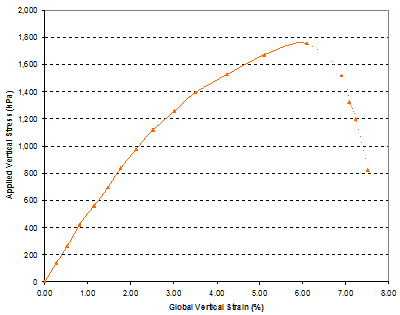
Figure 167. Graph. Global stress-strain relationship of test 3.
1 m = 3.28 ft
1 mm = 0.039 inches
1 kPa = 0.145 psi
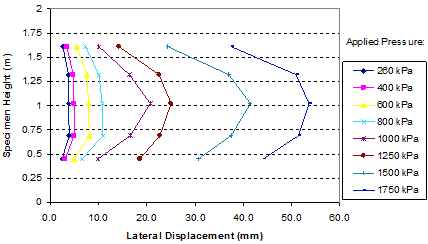
Figure 168. Graph. Lateral displacements on the open face of test 3.
1 mm = 0.039 inches
1 kPa = 0.145 psi
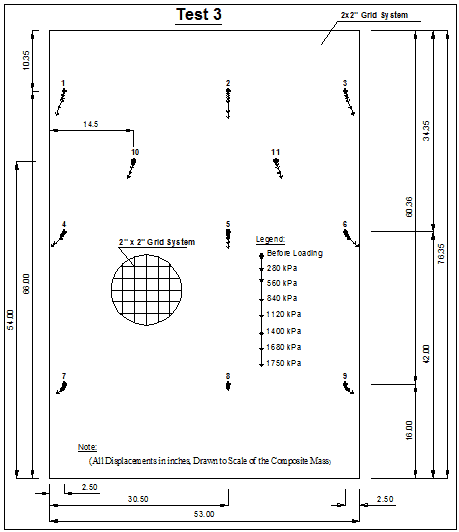
Figure 169. Illustration. Internal displacements of test 3.
1 mm= 0.039 inches
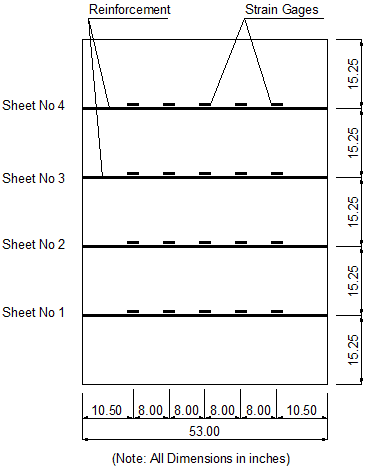
Figure 170. Illustration. Location of strain gauges on geosynthetic sheets in test 3.
1 m = 3.28 ft
1 kPa = 0.145 psi
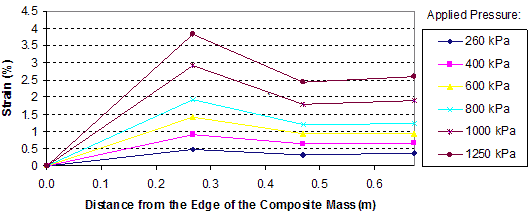
Figure 171. Graph. Reinforcement strain distribution of the composite mass in layer 1 of test 3 1.3 ft (0.4 m) from the base.
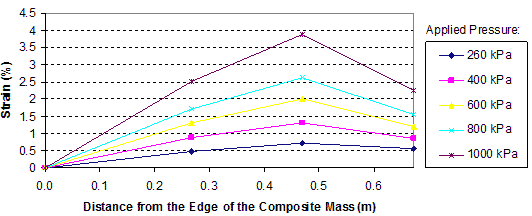
1 m = 3.28 ft
1 kPa = 0.145 psi
Figure 172. Graph. Reinforcement strain distribution of the composite mass in layer 2 of test 3 2.6 ft (0.8 m) from the base.
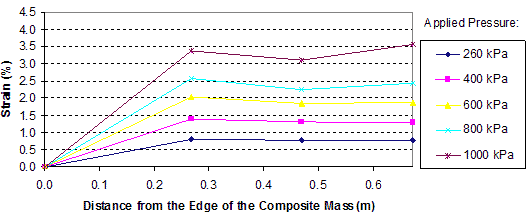
1 m = 3.28 ft
1 kPa = 0.145 psi
Figure 173. Graph. Reinforcement strain distribution of the composite mass in layer 3 of test 3 3.9 ft (1.2 m) from the base.
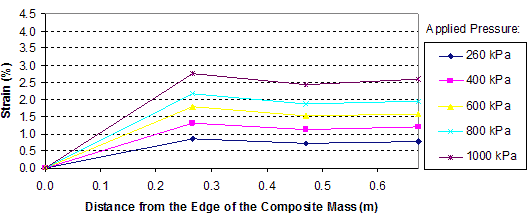
1 m = 3.28 ft
1 kPa = 0.145 psi
Figure 174. Graph. Reinforcement strain distribution of the composite mass in layer 4 of test 3 5.2 ft (1.6 m) from the base.
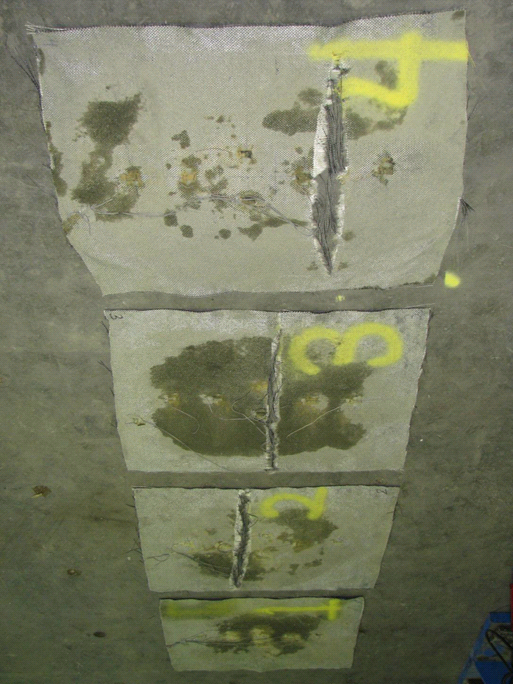
Figure 175. Photo. Aerial view of the reinforcement sheets exhumed from the composite mass after test 3 (numbers indicate sheet number).
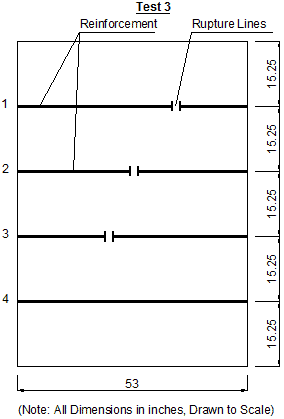
1 mm = 0.039 inches
Figure 176. Illustration. Locations of rupture lines of reinforcement in test 3 based on figure 175.
The results of test 2 are summarized in table 10.
Table 10. Test 3 result summary.
| Parameter | Measurement | |
| Test conditions | Geosynthetic reinforcement | Geotex® 4×4 |
| Wide-width strength of reinforcement | 140 kN/m | |
| Reinforcement spacing | 0.4 m | |
| Confining pressure | 34 kPa | |
| Test results | Ultimate applied pressure | 1,750 kPa |
| Vertical strain at failure | 6.1 percent | |
| Maximum lateral displacement of the open face at failure | 54 mm | |
| Stiffness at 1 percent vertical strain (Eat 1%) | 48,900 kPa | |
| Maximum strain in reinforcement at rupture | 12 percent | |
| Maximum measured strain in reinforcement | 4.0 percent | |
| 1 kN/m = 0.069 kip/ft 1 m = 3.28 ft 1 mm = 0.039 inches 1 kPa = 0.145 psi |
||
The reinforcement used in this test was a single sheet of Geotex® 4×4 at spacing of 1.3 ft (0.4 m). The composite mass after testing is shown in figure 177 and figure 178. The failure surfaces can be seen clearly in the figures.
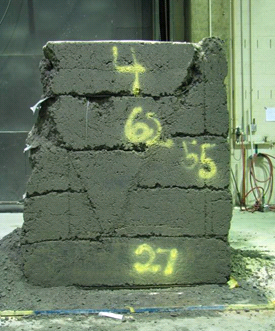
Figure 177. Photo. Front view of failure planes of the composite mass after test 4.
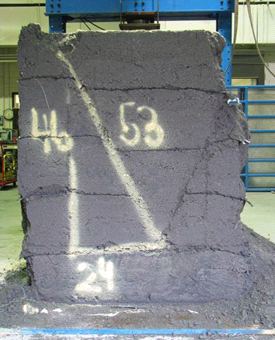
Figure 178. Photo. Back view of failure planes of the composite mass after test 4.
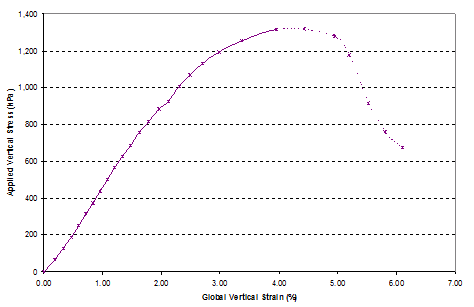
The measured data for test 4 are as follows:
1 kPa = 0.145 psi
Figure 179. Graph. Global stress-strain relationship of test 4.
1 m = 3.28 ft
1 mm = 0.029 inches
1 kPa = 0.145 psi
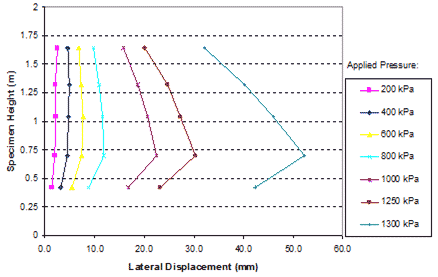
Figure 180. Graph. Lateral displacements on the open face of test 4.
1 mm = 0.039 inches
1 kPa = 0.145 psi
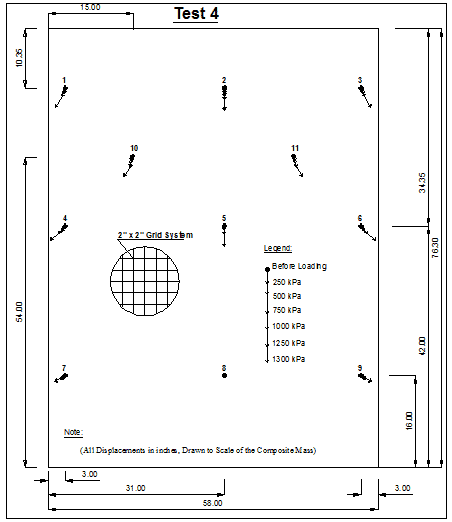
Figure 181. Illustration. Internal displacements of test 4.
1 mm = 0.039 inches
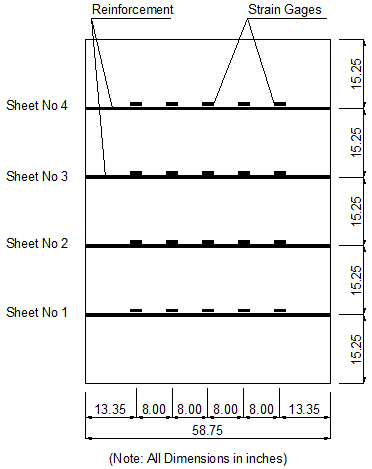
Figure 182. Illustration. Locations of strain gauges on geosynthetic sheets in test 4.
1 m = 3.28 ft
1 kPa = 0.145 psi
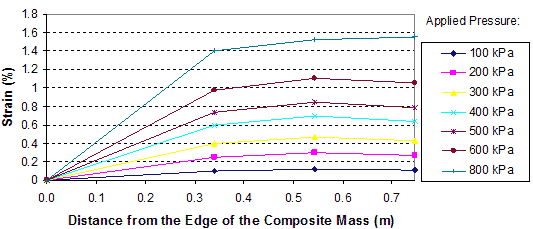
Figure 183. Graph. Reinforcement strain distribution of the composite mass in layer 1 of test 4 1.3 ft (0.4 m) from the base.
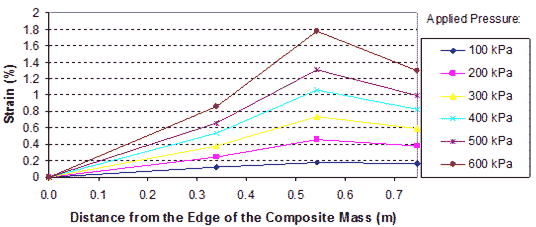
1 m = 3.28 ft
1 kPa = 0.145 psi
Figure 184. Graph. Reinforcement strain distribution of the composite mass in layer 2 of test 4 2.6 ft (0.8 m) from the base.
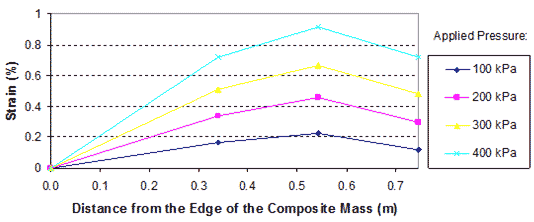
1 m = 3.28 ft
1 kPa = 0.145 psi
Figure 185. Graph. Reinforcement strain distribution of the composite mass in layer 3 of test 4 3.9 ft (1.2 m) from the base.
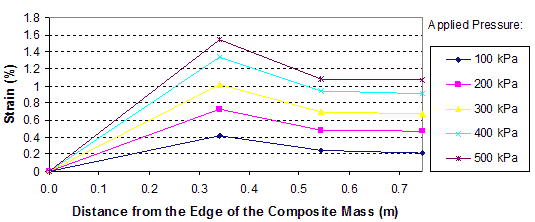
1 m = 3.28 ft
1 kPa = 0.145 psi
Figure 186. Graph. Reinforcement strain distribution of the composite mass in layer 4 of test 4 5.2 ft (1.6 m) from the base.
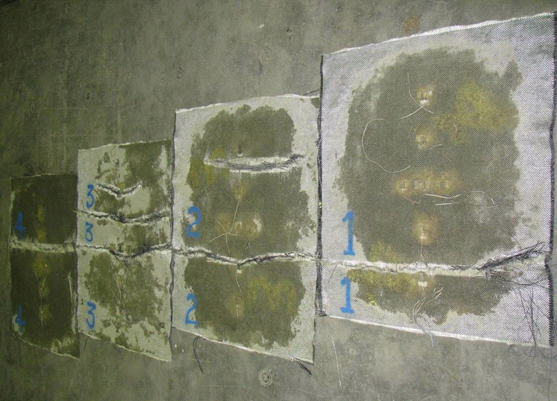
Figure 187. Photo. Aerial view of the reinforcement sheets exhumed from the composite mass after test 4 (numbers indicate sheet number).
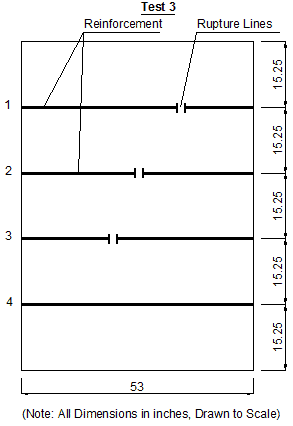
1 mm = 0.039 inches
Figure 188. Illustration. Locations of rupture lines of reinforcement in test 4 based on figure 187.
The test 4 results are summarized in table 11.
Table 11. GSGC test 4 result summary.
| Parameter | Measurement | |
| Test conditions | Geosynthetic reinforcement | Geotex® 4×4 |
| Wide-width strength of reinforcement | 70 kN/m | |
| Reinforcement spacing | 0.4 m | |
| Confining pressure | 34 kPa | |
| Test results | Ultimate applied pressure | 1,300 kPa |
| Vertical strain at failure | 4.0 percent | |
| Maximum lateral displacement of the open face at failure | 53 mm | |
| Stiffness at 1 percent vertical strain (Eat 1%) | 46,600 kPa | |
| Maximum strain in reinforcement at rupture | 12 percent | |
| Maximum measured strain in reinforcement | 2.0 percent | |
| 1 kN/m = 0.069 kip/ft 1 m = 3.28 ft 1 mm = 0.039 inches 1 kPa = 0.145 psi |
||
The configuration of this test was the same as test 2. The reinforcement was single-sheet Geotex® 4×4 at a spacing of 0.6 ft (0.2 m). Confining pressure was not applied for this test. Without applying confining pressure, the soil on the open faces fell off continuously with increasing applied pressure. The composite mass and failure surfaces after testing are shown in figure 189 through figure 191.
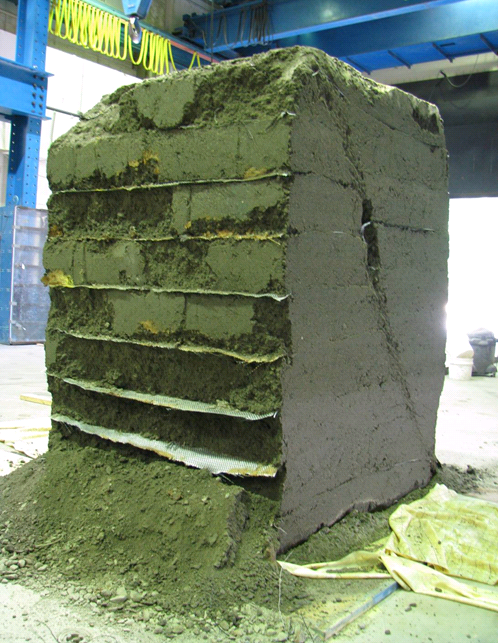
Figure 189. Photo. Composite mass at failure of test 5.
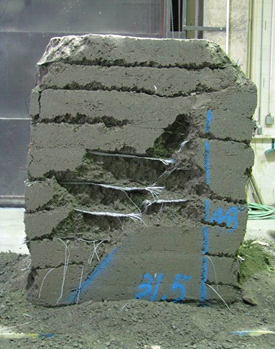
Figure 190. Photo. Front view of failure planes of the composite mass after test 5.
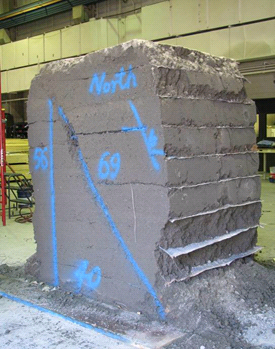
Figure 191. Photo. Back view of failure planes of the composite mass after test 5.
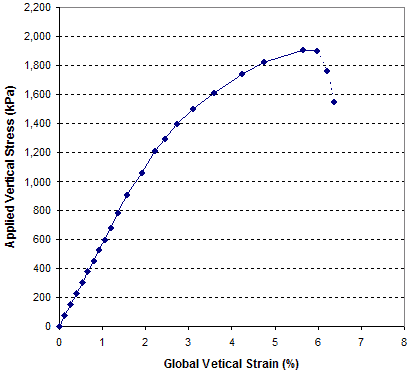
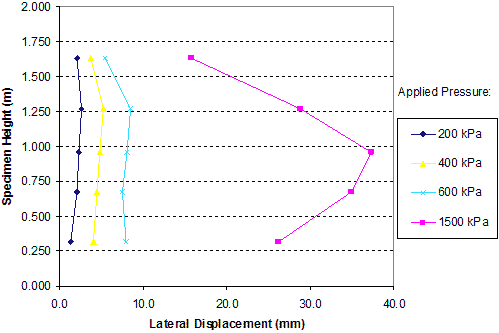
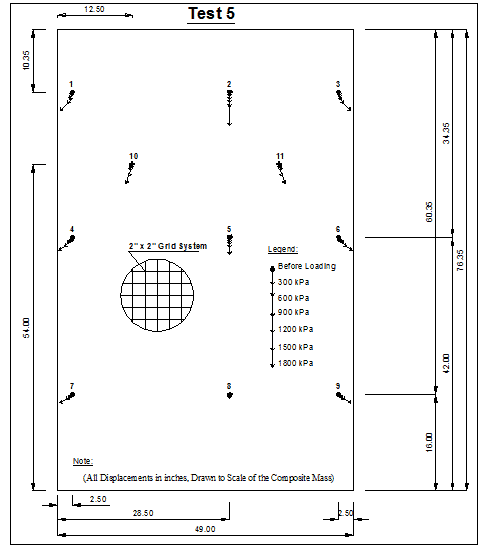
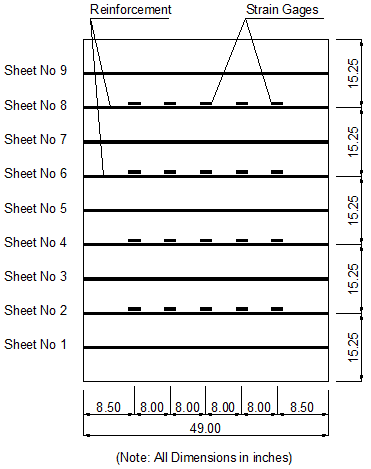
The measured data of test 5 are as follows:
1 kPa = 0.145 psi
Figure 192. Graph. Global stress-strain relationship of test 5.
1 m = 3.28 ft
1 mm = 0.039 inches
1 kPa = 0.145 psi
Figure 193. Graph. Lateral displacements on the open face of test 5.
1 mm = 0.039 inches
1 kPa = 0.145 psi
Figure 194. Illustration. Internal displacements of test 5.
1 mm = 0.039 inches
Figure 195. Illustration. Locations of strain gauges on geosynthetic sheets in test 5.
1 m = 3.28 ft
1 kPa = 0.145 psi
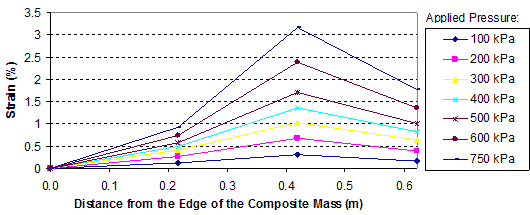
Figure 196. Graph. Reinforcement strain distribution of the composite mass in layer 1 of test 5 1.3 ft (0.4 m) from the base.
1 m = 3.28 ft
1 kPa = 0.145 psi
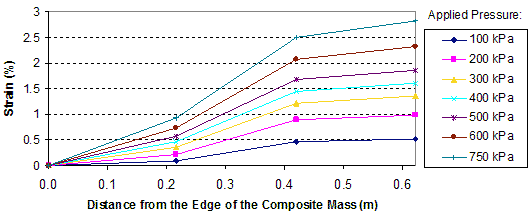
Figure 197. Graph. Reinforcement strain distribution of the composite mass in layer 2 of test 5 2.6 ft (0.8 m) from the base.
1 m = 3.28 ft
1 kPa = 0.145 psi
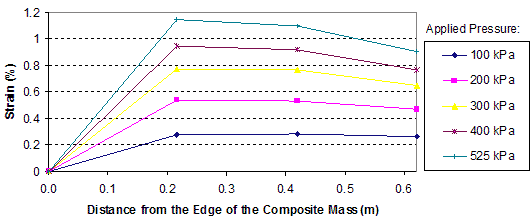
Figure 198. Graph. Reinforcement strain distribution of the composite mass in layer 3 of test 5 3.9 ft (1.2 m) from the base.
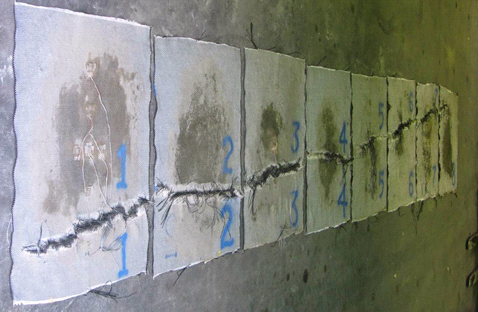
Figure 199. Photo. Aerial view of the reinforcement sheets exhumed from the composite mass after test 5 (numbers indicate sheet number).
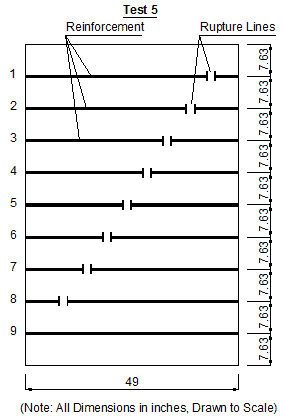
1 mm = 0.039 inches
Figure 200. Illustration. Locations of rupture lines of reinforcement in test 5 based on figure 199.
The test results of test 5 are summarized in table 12.
Table 12. GSGC test 5 result summary.
| Parameter | Measurement | |
| Test conditions | Geosynthetic reinforcement | Geotex® 4×4 |
| Wide-width strength of reinforcement | 70 kN/m | |
| Reinforcement spacing | 0.2 m | |
| Confining pressure | 0 | |
| Test results | Ultimate applied pressure | 1,900 kPa |
| Vertical strain at failure | 6.0 percent | |
| Maximum lateral displacement of the open face at failure | Not measured | |
| Stiffness at 1 percent vertical strain (Eat 1%) | 52,900 kPa | |
| Maximum strain in reinforcement at rupture | 12 percent | |
| Maximum measured strain in reinforcement | 3.2 percent | |
| 1 kN/m = 0.069 kip/ft 1 m = 3.28 ft 1 kPa = 0.145 psi |
||
4.7 DISCUSSION OF THE RESULTS
The results of the GSGC tests are discussed in terms of the following:
Table 13 shows the result comparisons between an unreinforced soil mass (test 1) and a soil mass reinforced by Geotex® 4×4 at a 0.7-ft (0.2-m) spacing (test 2). The reinforced soil was much stronger than the unreinforced soil. The ultimate applied pressure for the GSGC mass was about 3.5 times as large as the strength of the soil mass without reinforcement. The stiffness of the unreinforced soil mass was 50 percent of that for the reinforced soil mass. In addition, the reinforced soil mass was much more ductile than the unreinforced soil mass. The global vertical strain was 6.5 percent at failure for test 2, whereas it was only 3.0 percent for test 1.
Table 13. Comparison between test 1 and test 2.
| Parameter | Test 1 | Test 2 (T, Sv ) |
| Geosynthetic reinforcement | None | Geotex® 4×4 |
| Wide-width strength of reinforcement | None | Tf = 70 kN/m |
| Reinforcement spacing | No reinforcement | Sv = 0.2 m |
| Confining pressure | 34 kPa | 34 kPa |
| Ultimate applied pressure | 770 kPa | 2,700 kPa |
| Vertical strain at failure | 3 percent | 6.5 percent |
| Maximum lateral displacement of the open face at failure | 47 mm | 60 mm |
| Stiffness at 1 percent vertical strain (Eat 1%) | 33,500 kPa | 61,600 kPa |
| Stiffness for unloading-reloading (Eur) | 87,100 kPa | Not applied |
| 1 kN/m = 0.069 kip/ft 1 m = 3.28 ft. 1 kPa = 0.145 psi 1 mm = 0.039 inches |
||
Comparing the results of tests 2 and 3 demonstrates the relationship between reinforcement spacing and reinforcement strength (see table 14). As noted in section 2.1, the current design methods are based on the concept that reinforcement spacing and reinforcement strength play an equal role in the performance of a GRS mass. In other words, a GRS wall with reinforcement strength Tf at spacing Sv will behave the same as the one with reinforcement strength of 2 × Tf at spacing 2 × Sv. The results of tests 2 and 3 demonstrate that this assumption is incorrect. Even with the same Tf / Sv ratio (7.3 kip/ft2 (350 kN/m2)) in tests 2 and 3, the stiffness and strength of test 2 (with Tf and Sv = 0.7 ft (0.2 m)) was much higher than that of test 3 (with 2Tf and Sv = 1.3 ft (0.4 m)). The strength of the composite mass in test 3 was only 65 percent of the strength in test 2. These results suggest that reinforcement spacing plays a more important role than strength of reinforcement in a reinforced soil mass.
Table 14. Comparison between test 2 and test 3 with the same Tf /Sv
| Parameter | Test 2 (T, Sv ) | Test 3 (2T, 2Sv ) |
| Wide-width strength of reinforcement (Tf) | 70 kN/m | 140 kN/m |
| Reinforcement spacing (Sv ) | 0.2 m | 0.4 m |
| Tf /Sv | 350 kPa | 350 kPa |
| Confining pressure | 34 kPa | 34 kPa |
| Ultimate applied pressure | 2,700 kPa | 1,750 kPa |
| Vertical strain at failure | 6.5 percent | 6.1 percent |
| Maximum lateral displacement of the open face at failure | 60 mm | 54 mm |
| 1 kN/m = 0.069 kip/ft 1 m = 3.28 ft. 1 kPa = 0.145 psi 1 mm = 0.039 inches |
||
The effects of reinforcement spacing can be seen by comparing the results of tests 2 and 4 (see table 15). All test conditions in the two tests were the same except the reinforcement spacing. The spacing was 1.3 ft (0.4 m) in test 4 and 0.65 ft (0.2 m) in test 2. The results demonstrate the importance of reinforcement spacing on the behavior of a GRS mass. With reinforcement spacing of 0.7 ft (0.2 m), the strength of the GRS mass was about twice as high as the one with the 1.3-ft (0.4-m) spacing. The corresponding increase in stiffness at 1 percent strain was about 30 percent. The GRS mass at the 0.7-ft (0.2‑m) spacing also exhibited significantly higher ductility than at the 1.3-ft (0.4‑m) spacing.
Table 15. Comparison between test 2 and test 4.
| Parameter | Test 2 (T, Sv ) | Test 4 (T, 2Sv ) |
| Wide-width strength of reinforcement (Tf ) | 70 kN/m | 70 kN/m |
| Reinforcement spacing (Sv ) | 0.2 m | 0.4 m |
| Tf /Sv | 350 kPa | 175 kPa |
| Confining pressure | 34 kPa | 34 kPa |
| Ultimate applied pressure | 2,700 kPa | 1,300 kPa |
| Vertical strain at failure | 6.5 percent | 4.0 percent |
| Maximum lateral displacement of the open face at failure | 60 mm | 53 mm |
| Stiffness at 1 percent vertical strain (Eat 1% ) | 61,600 kPa | 46,600 kPa |
| 1 kN/m = 0.069 kip/ft 1 m = 3.28 ft. 1 kPa = 0.145 psi 1 mm = 0.039 inches |
||
The effects of reinforcement strength can be seen by comparing the results of tests 3 and 4 (see table 16). All test conditions in the two tests were identical except that reinforcement strength in test 3 was almost twice as high as that in test 4. The results indicate that the increase in strength of the GRS mass due to doubling the reinforcement strength was about 35 percent. This increase was much smaller than doubling the reinforcement spacing, where the increase in strength of the GRS mass was over 100 percent. The increase in stiffness at 1 percent strain due to doubling the reinforcement strength was only about 5 percent, compared to about a 30 percent increase due to doubling the reinforcement spacing.
Table 16. Comparison between test 3 and test 4.
| Parameter | Test 3 (T, Sv ) | Test 4 (T, 2Sv ) |
| Wide-width strength of reinforcement (Tf ) | 140 kN/m | 70 kN/m |
| Reinforcement spacing (Sv ) | 0.4 m | 0.4 m |
| Tf /Sv | 350 kPa | 175 kPa |
| Confining pressure | 34 kPa | 34 kPa |
| Ultimate applied pressure | 1,750 kPa | 1,300 kPa |
| Vertical strain at failure | 6.1 percent | 4.0 percent |
| Maximum lateral displacement of the open face at failure | 54 mm | 53 mm |
| Stiffness at 1 percent vertical strain (Eat 1%) | 48,900 kPa | 46,600 kPa |
| 1 kN/m = 0.069 kip/ft 1 m = 3.28 ft. 1 kPa = 0.145 psi 1 mm = 0.039 inches |
||
The effects of confining pressure can be seen by comparing the test results of tests 2 and 5 (see table 17). All test conditions in the two tests were identical except that the confining pressure in test 2 was 4.9 psi (34 kPa) and test 5 was conducted without confinement. The results indicate that the increase in strength due to the confining pressure was about 40 percent. The increase in stiffness at 1 percent strain due to the confining pressure was about 15 percent.
Table 17. Comparison between test 2 and test 5.
| Parameter | Test 2 (T, Sv ) | Test 5 (T, Sv ) |
| Wide-width strength of reinforcement (Tf ) | 70 kN/m | 70 kN/m |
| Reinforcement spacing (Sv ) | 0.2 m | 0.2 m |
| Tf /Sv | 350 kPa | 350 kPa |
| Confining pressure | 34 kPa | 0 |
| Ultimate applied pressure | 2.700 kPa | 1,900 kPa |
| Vertical strain at failure | 6.5 percent | 6.0 percent |
| Maximum lateral displacement of the open face at failure | 60 mm | Not measured |
| Stiffness at 1 percent vertical strain (Eat 1%) | 61.600 kPa | 52,900 kPa |
| 1 kN/m = 0.069 kip/ft 1 m = 3.28 ft. 1 kPa = 0.145 psi 1 mm = 0.039 inches |
||
Table 18 shows a comparison of the composite strength properties of the five GSGC tests as obtained from the measured data and calculated from Schlosser and Long’s method by assuming the friction angle remains the same as unreinforced soil (i.e., the same Φ value as in test 1).(25) The apparent cohesion, cR, from Schlosser and Long’s method is calculated as shown in figure 201.(25)
Table 18. Comparison of strength properties of five GSGC tests.
| Parameter | Test 1 (unreinforced) |
Test 2 (T, Sv ) |
Test 3 (2T, 2Sv ) |
Test 4 (T, 2Sv ) |
Test 5 (T, Sv ) |
| Wide-width strength of reinforcement, Tf (kN/m) | 70 | 140 | 70 | 70 | |
| Reinforcement spacing, Sv (m) | 0.2 | 0.4 | 0.4 | 0.2 | |
| Tf /Sv (kPa) | 350 | 350 | 175 | 350 | |
| Confining pressure (kPa) | 34 | 34 | 34 | 34 | 0 |
| Apparent cohesion, cR, (kPa) by Schlosser and Long’s method | 550 | 550 | 310 | 550 | |
| Ultimate applied pressure (kPa) from measured data | 770 | 2,700 | 1,750 | 1,300 | 1,900 |
| Ultimate applied pressure (kPa) by Schlosser and Long’s method | 3,250 | 3,250 | 1,930 | 3,030 | |
| Difference in ultimate pressure between measured data and Schlosser and Long’s method (percent) | 20 | 86 | 48 | 59 | |
| 1 kN/m = 0.069 kip/ft 1 m = 3.28 ft. 1 kPa = 0.145 psi Note: Blank cells indicate parameters for which there were no measurements. |
|||||
![]()
Figure 201. Equation. Apparent cohesion from Schlosser and Long.(25)
Where:
c = Cohesion of the backfill.
Tf = Strength of reinforcement.
Sv = Reinforcement spacing.
Kp = Coefficient of passive Earth pressure.
The values calculated from Schlosser and Long’s method were higher than the measured values by 20 to 86 percent.