U.S. Department of Transportation
Federal Highway Administration
1200 New Jersey Avenue, SE
Washington, DC 20590
202-366-4000
Federal Highway Administration Research and Technology
Coordinating, Developing, and Delivering Highway Transportation Innovations
| REPORT |
| This report is an archived publication and may contain dated technical, contact, and link information |
|
| Publication Number: FHWA-HRT-11-045 Date: November 2012 |
Publication Number: FHWA-HRT-11-045 Date: November 2012 |
The title of this document is "Standard Specification for Method of Test for the Determination of Asphalt Cement’s Resistance to Ductile Failure Using Double Edge Notched Tension Test (DENT)."
This test method covers the determination of asphalt cement’s resistance to ductile failure using a DENT test. The test is conducted after thermal conditioning to determine the EWF, the plastic work of fracture, and an approximate CTOD at a specified temperature and rate of loading. This method is provided as a provisional test method. The test is a working document; continuous refinement to the test method may be expected.
The following documents are referenced in this specification:
The following terminology is used in this specification:
The following equipment is used in this specification:

1 mm = 0.039 inches
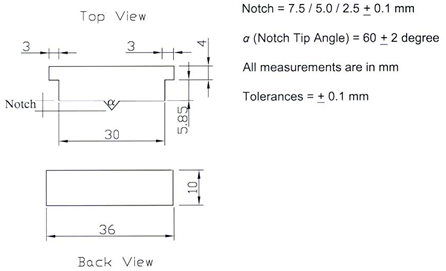
Figure 186. Illustration. DENT inserts.
Prepare the DENT samples according to the Preparation of Apparatus and Molding of Test Specimens procedure in AASHTO T 300 with the following exceptions and additional requirements:
The following steps constitute the procedures for testing:
1. Condition the samples on the base plates at 77 ±0.9 °F (25 ± 0.5 °C) for 3 h ±5 min in their molds in a temperature controlled bath under a minimum of 1 inch (25 mm) of water.
2. Once conditioned, prepare the sample for testing by removing the sample from the base plate without causing excessive deformation or stress concentrations to the sample. Keep the sample always under the surface of the water, detach the DENT inserts, and load it through the holes in the end pieces onto the testing apparatus’ loading pins. The sample shall be loaded so there is a minimum of 1 inch (25 mm) of water below and above the sample. Allow the sample to sit and equilibrate for a minimum of 5 min before starting the test.
3. Run the test according to AASHTO T 300 but at a displacement rate of 4 ±0.02 inches/min (100 ±2.5 mm/min) in a bath maintained at 77 ±0.9 °F (25 ± 0.5 °C) until ductile failure is reached or a stroke length of 39.4 inches (1,000 mm) is reached.
4. If ductile failure is not achieved before the stroke length of 39.4 inches (1,000 mm) is reached, the test shall be stopped and retested at a lower displacement rate. Reheat the sample material in a manner that minimizes damage to the material (see Preparation of Sample section). Condition and retest according to steps 1–3 at a displacement rate of 2 ±0.01 inches/min (50 ±2.5 mm/min).
5. Record actual sample ligament length, ℓ, displacement rate, water bath temperature, and load every 0.3 s for the entire test time.
6. Repeat steps 1–5 on the duplicate and then on all the other ligament length samples.
The following calculations should be performed following testing:
1. Using numerical integration techniques, calculate the average Wt for each ligament length where Wtfor each sample is computed based on figure 187.

(units kJ)
Figure 187. Equation. Total work of fracture calculated from integration of load and displacement data.
Where tf is the time when ductile failure or the maximum stroke length is reached, whichever comes first. (Note: Any negative load readings or negative Wt values and any Wt obtained after tf are not to be included in the calculation. Although it is not always noticeable, additional data are often recorded for the run after failure. For example, when the load is very small and then increases slightly or the load is very small and remains constant, the data are a residual load on the device. Check each of the data records to ensure that these residual and any prestart values are zeroed so they are not included in the total Wt.)
2. Calculate wt for each ligament length for each average Wt where wt is the (average Wt)/(Bℓ) (units J/m2).
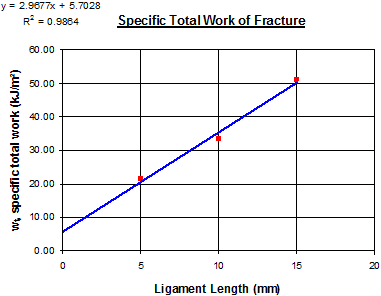
3. Plot wt for the three ligamentlengths, ℓ and use the method of least squares to fit a regression line through the data. See figure 188 for an example.

1 kJ = 23,730 lb-ft2/sec2
1 mm = 0.0309 inches
Figure 188. Graph. Example wt versus ligament length plot for determining EWF.
Obtain values for we and the term ![]() , where we is the specific EWF (i.e., wt for ℓ = 0.0) and
, where we is the specific EWF (i.e., wt for ℓ = 0.0) and ![]() is the slope of the best fit straight line, for
is the slope of the best fit straight line, for ![]() . (Note: An individual
. (Note: An individual ![]() value does not need to be calculated. As background for the user of this test,
value does not need to be calculated. As background for the user of this test, ![]() , where h is the height of an assumed elliptic shape of the plastic zone and L is the ligament length.)
, where h is the height of an assumed elliptic shape of the plastic zone and L is the ligament length.)
4. Determine ![]() , where
, where ![]() = Ppeak / (Bℓ) and Ppeak is the average peak load obtained for the sample tested with the smallest ligament length (i.e., the average maximum load for the 0.2-inch (5-mm) ligament samples).
= Ppeak / (Bℓ) and Ppeak is the average peak load obtained for the sample tested with the smallest ligament length (i.e., the average maximum load for the 0.2-inch (5-mm) ligament samples).
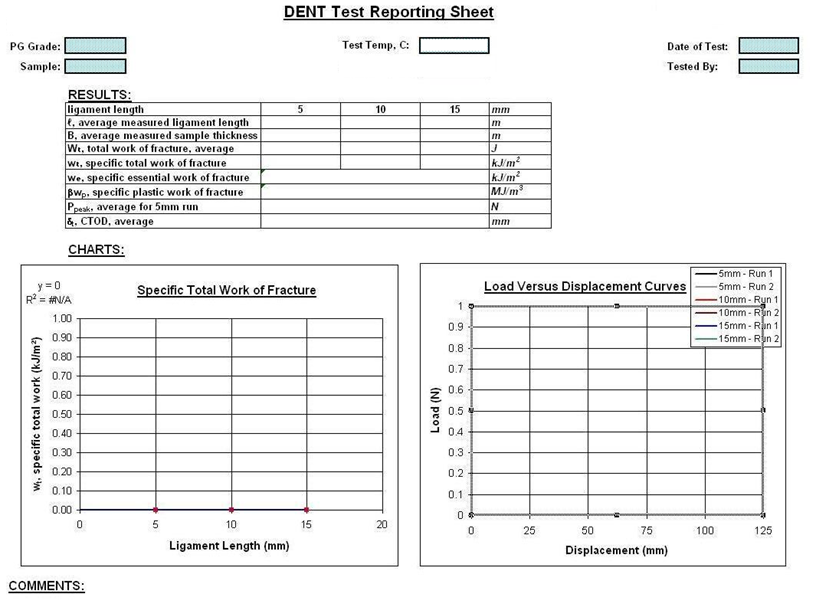
Report the following on a form similar to figure 189: we, ![]() ,
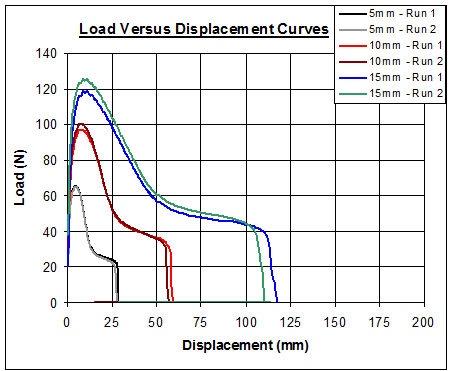
, ![]() , Ppeak, best fit line for the wt versus ligament lengths plot. For each ligament length, plot the average actual sample ligament length, the average actual sample thickness, average Wt, wt, and load versus displacement curves, as in figure 190.
, Ppeak, best fit line for the wt versus ligament lengths plot. For each ligament length, plot the average actual sample ligament length, the average actual sample thickness, average Wt, wt, and load versus displacement curves, as in figure 190.

Figure 189. Chart. Example reporting sheet.

1 N = 0.225 lbf
1 mm = 0.0309 inches
Figure 190. Graph. Typical load-displacement curves for EWF test.