U.S. Department of Transportation
Federal Highway Administration
1200 New Jersey Avenue, SE
Washington, DC 20590
202-366-4000
Federal Highway Administration Research and Technology
Coordinating, Developing, and Delivering Highway Transportation Innovations
| REPORT |
| This report is an archived publication and may contain dated technical, contact, and link information |
|
| Publication Number: FHWA-HRT-15-074 Date: September 2016 |
Publication Number: FHWA-HRT-15-074 Date: September 2016 |
This chapter presents the results of the 3D-Move software calibration using data collected from installed sensors at the MnROAD facility during the September 2013 TSDD field trials. The objective of this calibration was to enable the use of the 3D-Move software in the development of methodologies and/or procedures for incorporating TSDD measurements into network-level PMS applications. This software was chosen because it is ideally suited to evaluate and compare pavement responses measured with TSDDs. It estimates the dynamic pavement responses at any given point within the pavement structure using a continuum-based finite layer approach.
The dynamic pavement surface deflections measured by TSDDs are affected by many factors, which include pavement layer characteristics (e.g., thickness, stiffness, and damping properties), vehicle loading (e.g., tire configuration and contact stress distribution), and vehicle speed. Since rate-dependent (viscoelastic) material properties can be accommodated by 3D-Move, it is an ideal tool to study pavement response as a function of vehicle speed through the direct use of the frequency sweep test data (dynamic modulus and damping) of AC mixture.
The applicability and versatility of the 3D-Move approach has been reported in literature.(35,31) Measured pavement responses with the existing and newly installed geophones and accelerometers during MnROAD trials provided a great opportunity to validate the applicability of 3D-Move due to loading from TSDDs. This chapter focuses on details relating to the 3D-Move calibration effort.
One of the major tasks of this project was to simulate pavement surface deflections using numerical models with a focus on understanding the parameters that affect the TSDD measurements. Those parameters include changes in TSDD vehicle speed, pavement layer properties (e.g., age and moisture), and vehicle loading (e.g., tire configuration, load, and inflation pressure). To accomplish this, calibration of the analytical tool that simulates TSDDs was required (i.e., it is critical to verify that the analytical tool and the corresponding software are used correctly to assess pavement responses and that they provide reliable results). Toward this end, calibration of 3D-Move relative to TSDDs was undertaken first, and the calibrated software was subsequently used in the simulations of pavement responses.
As noted earlier in this report, during the September 2013 TSDD field trials, data were collected from the embedded geophones and accelerometers (which were installed as a part of this project) as well as also by the two TSDDs. The measured velocity time histories from the geophones along with the computed displacement time histories (referred to as “project measurements”) are important since they are the basic measurements made by the TSDDs and subsequently used for pavement condition evaluations. In addition, the MnROAD facility had existing sensors (subsequently referred as MnROAD sensors) capable of measuring earth pressures and pavement strain responses under vehicle loading (i.e., dynamic). Those MnROAD sensor data were included in the project database (see section 5.7). The resulting data were used to create a comprehensive database of independently measured pavement responses (i.e., stresses, strains, and displacements) from different sources, including MnROAD sensors, project sensors, and TSDDs.
The material properties that are appropriate for the conditions (e.g., temperature and moisture) that existed at the time of TSDD trials are critical inputs to 3D-Move. Some pavement layer properties are sensitive to temperature changes, while others are affected by moisture changes. Consequently, some of the TSDD trials were conducted at different times of the day (e.g., early morning and late afternoon). A study of the effects of moisture changes was not possible within the project schedule. Data from FWD testing that was conducted prior to the TSDD field trials were available. An iterative procedure that involved selecting numerous case scenarios where 3D-Move computed responses for a wide range of inputs were compared with those actually measured at the MnROAD facility. The main variables relative to the 3D-Move inputs were the pavement layer configuration and material properties. These material properties must be reasonable and consistent with available data (e.g., FWD measurements). It is important that the appropriate case scenarios should bracket the measured responses in a consistent manner covering all independent measurements (i.e., stresses, strains and displacements).
The 3D-Move program was developed at UNR to evaluate pavement response. The program can account for important pavement response factors such as the moving traffic-induced complex 3D contact stress distributions (normal and shear) of any shape, vehicle speed, and viscoelastic material characterization for the pavement layers. The finite-layer approach used in the formulation of the program treats each pavement layer as a continuum and uses the Fourier transform technique; therefore, it can handle complex surface loadings such as multiple loads and non-uniform tire pavement contact stress distribution. This approach is suitable to analyze tire imprints of any shape, including those generated by wide-base tires.(32,33,2) The finite-layer method is much more computationally efficient than the moving load models based on the finite element method.(51,52) This is because often times, the pavements are horizontally layered, and pavement responses are required only at a few selected locations. For such problems, the finite layer approach of 3D-Move is ideally suited. The frequency domain solutions along with complex modulus formulation adopted in 3D-Move enables a direct use of the frequency sweep test data of AC mixture in the analysis.
A number of field calibrations (e.g., Penn State University test track, MnROAD, and UNR Off-Road Vehicle study) that compared a variety of independently-measured pavement responses (i.e., stresses, strains, and displacements) with those computed by 3D-Move have been reported in the literature.(35,31) ViscoRoute, which is a semi-analytical dynamic multi-layer model, is currently the only other available software capable of handling loaded areas with uniform contact vertical pressure.(10) It is an ideal program that can be compared with 3D-Move in terms of incorporating viscoelastic properties in its formulation. Hajj et al. compared computed maximum transverse strains by 3D-Move and ViscoRoute at the bottom of thin and thick AC layers.(36) The computed responses were found to be within 6 percent in the 60 cases considered. These verification studies demonstrate the validity, applicability, and versatility of the 3D-Move approach. Since details of 3D-Move are available in the literature, they are not addressed in this report. (See references 35, 31–33, and 2.) However, details concerning the application of 3D-Move to this project (e.g., inputs and response outputs) are presented next.
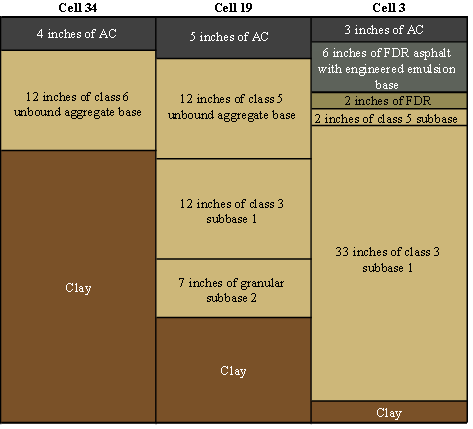
Cells 3 and 19 in the MnROAD mainline and cell 34 in the MnROAD LVR were selected to evaluate the accuracy of the TSDDs and hence are referred to as the “accuracy cells.” All three cells consisted of AC pavements. As described in chapter 5, each cell was instrumented with four geophones and one accelerometer during the project. These cells were also previously instrumented during construction by MnROAD with sensors such as strain gauges, pressure cells, LVDTs, moisture gauges, TCs, and tipping buckets. In the calibration process, only load-induced measured response values of strains, stresses, and displacements from the referenced sensors at the three accuracy cells were compared with those computed with 3D-Move.
The characterization of the material properties for the three accuracy cells is an important step in the calibration process.
The required 3D-Move inputs for the surface layer (AC considered viscoelastic) were as follows:
The required 3D-Move inputs for unbound layers (base and subgrade, which were considered LE) were as follows:
MnROAD maintains a database containing laboratory and field-testing results on soils, aggregates, asphalt mixtures, asphalt binders, concrete mixtures, and other materials. The database also contains cell-specific information, including layer thickness, type of layers, and cross sections of cells at time of construction and subsequent treatments. Figure 124 shows the pavement structure for the three MnROAD accuracy cells. As shown in table 29, FWD testing was done a few days prior to the TSDD field trials, which facilitated the characterization of existing material properties for the pavement layers in the accuracy cells.
1 inch = 25.4 mm
Figure 124. Illustration. Pavement structure of MnROAD accuracy cells.
| Device | Accuracy Cell Date and Time | ||
|---|---|---|---|
| Cell 3 | Cell 19 | Cell 34 | |
| FWD | 9/16/2013 at 2 p.m. | 9/20/2013 at 2 p.m. | 9/5/2013 at 3 p.m. |
| TSD | 9/26/2013 at 12:30 p.m. | 9/26/2013 at 10 a.m. | 9/24/2013 at 3 p.m. |
| RWD | 9/23/2013 at 2:30 p.m. | 9/23/2013 at 9 a.m. | 9/23/2013 at 5 p.m. |
Table 30 shows the backcalculated layer moduli for the accuracy cells, which were estimated using the widely used program MODULUS.(53) Other outputs of the program include standard deviation of the backcalculated moduli computed from multiple FWD drop data. These backcalculated moduli may be considered appropriate for the site at the time of FWD testing. The AC layer moduli shown in table 30 had to be adjusted to actual temperature at the time of the TSDD testing for the purposes of the 3D-Move simulations. The procedure used for temperature adjustment is detailed in the subsection, Pavement Material Properties at the Time of TSDD Trials, later in this chapter.
| Cell | Material | Thickness (inches) | Average Modulus (ksi) | Standard Deviation (ksi) | COV (Percent) |
|---|---|---|---|---|---|
| 3 | AC | 3 | 554 | 34 | 14.0 |
| Base | 43 | 68.8 | 13.6 | 19.8 | |
| Subgrade | 122.4 | 17.7 | 2.2 | 12.3 | |
| 19 | AC | 5 | 301 | 65 | 22.0 |
| Base | 31 | 32 | 5.8 | 18.0 | |
| Subgrade | 18.1 | 6.1 | 0.6 | 10.2 | |
| 34 | AC | 4 | 299 | 67 | 22.0 |
| Base | 12 | 15.7 | 3.1 | 19.9 | |
| Subgrade | 46.3 | 8.5 | 0.9 | 10.2 |
1 inch = 25.4 mm
1 ksi = 6.89 MPa
The properties of the unbound layers (base and subgrade) were generally unaffected by temperature (as long as there was no freezing), but moisture could play a significant role. However, the FWD and TSDD testing were performed within a short period of each other, and a careful review of climate at the site revealed that no significant changes in moisture (i.e., no rain or snow) occurred. Therefore, the FWD backcalculated moduli for the unbound layers at the three MnROAD accuracy cells were used without adjustments in the 3D-Move runs.
Evaluation of AC Pavement Temperature During FWD Testing
Accurate estimates of the AC layer temperatures at the time of FWD testing were necessary since AC stiffness is significantly affected by temperature. Accordingly, adjustments to the AC stiffness to reflect actual temperatures at the time of TSDD testing were needed. A TC tree device was used for the MnROAD accuracy cells to measure temperature within the pavement layers. A typical MnROAD TC tree is 6 ft (1.83 m) long. Sensor depths were selected during construction to provide a temperature profile within the AC, base, and subbase layers. Table 31 shows the TC sensor depths from the surface at the MnROAD accuracy cells, while table 32 shows the AC layer temperatures recorded by the TC device at the three cells.
| Cell 3 | Cell 19 | Cell 34 | |||
|---|---|---|---|---|---|
| Sensor | Depth (inches) | Sensor | Depth (inches) | Sensor | Depth (inches) |
| 101 | 0.5 | 101 | 0.5 | 201 | 0.5 |
| 102 | 1.5 | 102 | 1.5 | 202 | 1.6 |
| 103 | 2.5 | 103 | 2.5 | 203 | 2.5 |
| 104 | 3.5 | 104 | 3.5 | 204 | 3.5 |
| 105 | 5 | 105 | 4.5 | 205 | 7 |
| 106 | 7 | 106 | 6 | 206 | 9 |
| 107 | 9 | 107 | 9 | 207 | 11 |
| 108 | 11 | 108 | 12 | 208 | 13 |
| 109 | 13 | 109 | 15 | 209 | 15 |
| 110 | 15 | 110 | 18 | 210 | 20 |
| 111 | 24 | 111 | 24 | 211 | 24 |
| 112 | 28 | 112 | 30 | 212 | 30 |
| 113 | 36 | 113 | 36 | 213 | 36 |
| 114 | 48 | 114 | 48 | 214 | 48 |
| 115 | 60 | 115 | 60 | 215 | 60 |
| 116 | 72 | 116 | 72 | 216 | 72 |
1 inch = 25.4 mm
Note: Bolded cells indicate the sensors were located within the AC layer.
| Cell | Day | Hour | Temperature at Location from Surface (ºF) | ||||||||
|---|---|---|---|---|---|---|---|---|---|---|---|
| Sensor 101 | Sensor 102 | Sensor 103 | Sensor 104 | Sensor 105 | Sensor 201 | Sensor 202 | Sensor 203 | Sensor 204 | |||
| 3 | 9/16/13 | 14 | 126 | 93 | 90 | 84 | N/A | N/A | N/A | N/A | N/A |
| 19 | 9/20/13 | 14 | 84 | ** | 135* | 73 | 72 | N/A | N/A | N/A | N/A |
| 34 | 9/5/13 | 15 | N/A | N/A | N/A | N/A | N/A | ** | 108 | ** | ** |
1 °F = 1.8° C + 32
*Possible incorrect data.
**Missing data.
N/A = Not applicable.
As shown in table 32, there are missing and possibly incorrect data from the MnROAD TC devices. Although AC temperature depth coverage seemed adequate for cell 3, which had the lowest thickness of 3 inches (76.2 mm), coverage in the other cells were not. For example, in cell 19, there are four data points, but one of them (sensor 103) was unreliable. For cell 34, only one data point is available. Accordingly, an alternate robust and defensible approach was adapted to estimate temperatures within the AC layers during FWD testing and also during the TSDD field trials. Towards this end, the BELLS equation was selected for a number of reasons, including its extensive calibration using data from the Long-Term Pavement Performance (LTPP) Program.(40,54)
The BELLS equation was used to predict temperatures within the AC layer for cells 19 and 34 at locations other than those for which field measurements were available. The BELLS equation is given by the following:
![]()
Figure 125. Equation. BELLS equation.
Where:
Td= Pavement temperature at depth d.
IR = Pavement surface temperature.
d = Depth at which pavement temperature is to be predicted.
1-day = Average air temperature the day before testing.
hr18= Time of day, in a 24-h clock system, calculated using an 18-h AC and temperature rise-and-fall time cycle.
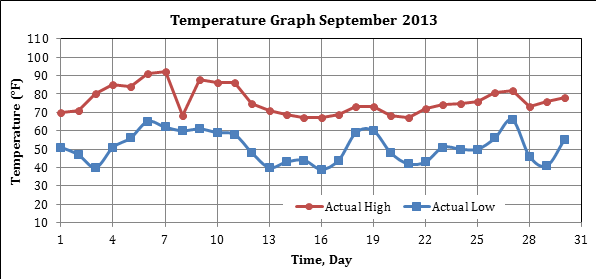
Figure 126 shows the variation of air temperature in Monticello, MN, which is close to the MnROAD facility, during September 2013, which is when the FWD testing and TSDD field trials under consideration took place.
1 °F = 1.8 °C + 32
Figure 126. Graph. September 2013 temperature variations in Monticello, MN.
Figure 126 was used to find the average air temperature of the day before FWD testing, which was 66 °F (18.9 °C) on September 19, 2013, and 69 °F (20.6 °C) on September 4, 2013, for cells 19 and 34, respectively. Appropriate surface temperatures were determined based on the data available from the top-most sensor (sensor 101 in cell 19 and sensor 202 in cell 34) of the TC device and matching the prediction by the BELLS equation. Having estimated the required surface temperatures, the BELLS equation was used to predict the variation of temperature with depth within the AC layer at both cells in question. Table 33 and table 34 show the estimated temperatures within AC layer for cells 19 and 34 at the time of FWD testing.
| Matched Surface Temperature (°F) | Time | Depth (inches) | 1-Day Temperature (°F) | Temperature from BELLS Equation (°F) |
|---|---|---|---|---|
| 87.3 | 2 p.m. | 0.5 | 65.5 | 84.2 |
| 2 p.m. | 1.5 | 65.5 | 82.4 | |
| 2 p.m. | 2.5 | 65.5 | 80.6 | |
| 2 p.m. | 3.5 | 65.5 | 78.8 | |
| 2 p.m. | 4.5 | 65.5 | 78.8 |
1 °F = 1.8 °C + 32
1 inch = 25.4 mm
| Matched Surface Temperature (°F) | Time | Depth (inches) | 1-Day Temperature (°F) | Temperature from BELLS Equation (°F) |
|---|---|---|---|---|
| 119.3 (48.5) | 3 p.m. | 0.5 | 68.9 | 116.6 |
| 3 p.m. | 1.6 | 68.9 | 107.6 | |
| 3 p.m. | 2.5 | 68.9 | 104 | |
| 3 p.m. | 3.5 | 68.9 | 102.2 |
1 °F = 1.8 °C + 32
1 inch = 25.4 mm
The data presented in table 32 to table 34 were then used to estimate representative average AC layer temperatures at the time of FWD testing for cells 3, 19, and 34, which resulted in temperatures of 99, 81, and 108 °F (37.2, 27.2, and 42.2 °C), respectively.
Pavement Material Properties at the Time of TSDD Trials
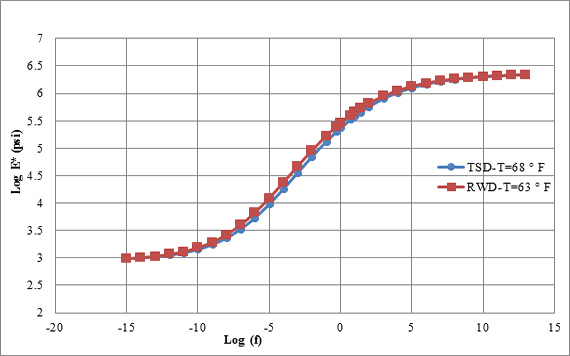
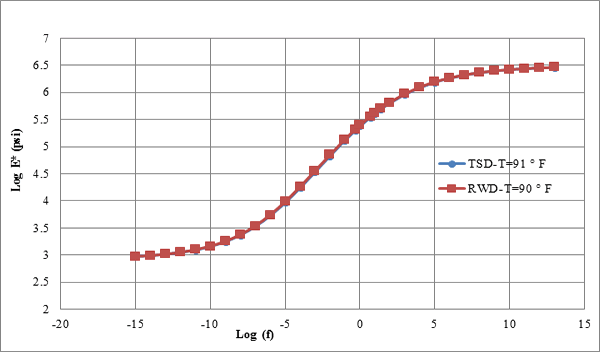
The 3D-Move program requires viscoelastic characterization (frequency dependent) of the AC layers to evaluate pavement responses as a function of vehicle speed. Since the TSDD field trials were conducted under different temperature conditions, a master curve approach was adopted so that the AC layer modulus versus frequency relationship could be determined at any given temperature.
The FWD backcalculated AC layer modulus was appropriate for the temperature at the time of testing and a loading frequency of about 30 Hz.(55) Using this AC layer modulus and frequency as an anchoring point, the AC master curve (i.e., modulus versus frequency) could be established.
The first step in the development of the AC master curves was determining the representative AC layer temperatures during TSDD testing. The same procedure used to determine the AC layer temperatures during FWD testing was used to estimate the average AC layer temperatures during TSDD testing. Table 35 summarizes the average AC layer temperatures at the time of FWD and TSDD testing.
| Cell | Temperature at Time of FWD Testing (°F) | Temperature at Time of TSD Testing (°F) | Temperature at Time of RWD Testing (°F) |
|---|---|---|---|
| 3 | 99 | 91 | 99 |
| 19 | 81 | 68 | 63 |
| 34 | 108 | 91 | 90 |
1 °F = 1.8 °C + 32
Using the average AC layer temperature, damping was estimated using dynamic modulus test data available in the MnROAD database. In those tests, the phase angels of the AC layer at several temperatures and frequencies were measured. In its complex form, the dynamic modulus is given by the following:
![]()
Figure 127. Equation. Complex dynamic modulus.
Where:
E* = Complex dynamic modulus.
E' = Elastic (or storage) modulus.
i = Unit imaginary number.
ζAC= Measure of internal damping of AC.
For viscoelastic layers, E* can be presented as the sum of the real and imaginary components, which is given by the following:
![]()
Figure 128. Equation. Modified modulus equation.
Where:
E" = Damping (or loss) modulus.
The equations may be re-written as follows:
![]()
Figure 129. Equation. Rewritten modulus equation.
Where:
φ= Phase angle.
Table 36 and table 37 show the values of damping associated with the TSDD field trials. The procedure used to obtain these values consisted of fitting a best curve through the available AC dynamic modulus test (phase angle measured at given frequencies) results and then interpolating the phase angles for the temperature corresponding with the TSDD field trials.
| Cell 3 (91 °F) | Cell 19 (68 °F) | Cell 34 (91 °F) | ||||||
|---|---|---|---|---|---|---|---|---|
| Frequency (Hz) | Phase Angle (Degree) | Damping (Percent) | Frequency (Hz) | Phase Angle (Degree) | Damping (Percent) | Frequency (Hz) | Phase Angle (Degree) | Damping (Percent) |
| 0.1 | 36.3 | 36.8 | 0.1 | 34.2 | 33.9 | 0.01 | 29.0 | 27.8 |
| 0.5 | 36.7 | 37.3 | 0.5 | 26.4 | 24.8 | 0.1 | 32.0 | 31.2 |
| 1 | 36.2 | 36.6 | 1 | 23.7 | 21.9 | 1 | 31.6 | 30.7 |
| 5 | 33.2 | 32.7 | 5 | 19.1 | 17.3 | 25 | 27.6 | 26.1 |
| 10 | 34.4 | 34.2 | 10 | 16.9 | 15.1 | N/A | N/A | N/A |
| 25 | 31.6 | 30.7 | 25 | 13.5 | 11.9 | N/A | N/A | N/A |
1 °F = 1.8 °C + 32
N/A = Not available.
| Cell 3 (99 °F) | Cell 19 (63 °F) | Cell 34 (90 °F) | ||||||
|---|---|---|---|---|---|---|---|---|
| Frequency (Hz) | Phase Angle (Degree) | Damping (Percent) | Frequency (Hz) | Phase Angle (Degree) | Damping (Percent) | Frequency (Hz) | Phase Angle (Degree) | Damping (Percent) |
| 0.1 | 36.8 | 37.4 | 0.1 | 32.7 | 32.1 | 0.01 | 29.7 | 28.5 |
| 0.5 | 36.6 | 37.2 | 0.5 | 22.6 | 20.8 | 0.1 | 33.0 | 32.4 |
| 1 | 36.4 | 36.9 | 1 | 19.4 | 17.6 | 1 | 32.5 | 31.9 |
| 5 | 34.7 | 34.6 | 5 | 15.4 | 13.7 | 25 | 28.0 | 26.5 |
| 10 | 36.7 | 37.2 | 10 | 12.4 | 10.9 | N/A | N/A | N/A |
| 25 | 34.6 | 34.5 | 25 | 9.4 | 8.3 | N/A | N/A | N/A |
1 °F = 1.8 °C + 32
N/A = Not available.
Undamaged Modulus of AC Layer:
The procedure used to develop the appropriate AC master curves took into account the following considerations:
One of the most comprehensive AC mixture stiffness models is Witczak's dynamic modulus predictive equation. This model predicts modulus as a function of temperature and frequency based on volumetric AC mix design information. The Witczak-Andrei AC dynamic modulus equation is given by the following:(56)

Figure 130. Equation. Witczak equation.
Where:
ρ200 = Percent passing #200 (0.075 mm) sieve.
ρ4 = Cumulative percent retained on #4 (4.76 mm) sieve.
ρ38 = Cumulative percent retained on 0.375-inch (9.5 mm) sieve.
ρ34 = Cumulative percent retained on 0.75-inch (19 mm) sieve.
Va = Air void, percent by volume.
Vbeff = Effective binder content, percent by volume.
e = Euler's number.
f = Loading frequency, Hz.
η = Viscosity (cP).
The Witczak equation requires input such as gradation and viscosity. The gradation data for the three MnROAD accuracy cells were available from the MnROAD database, while viscosity values were estimated as a function of temperature based on the regression intercept, A, and the regression slope of viscosity temperature susceptibility (VTS) as shown in figure 131.(58)
![]()
Figure 131. Equation. Temperature-viscosity relationship.
Where:
A = Regression intercept.
TR = Temperature at which the viscosity is estimated (Rankine).
AASHTO T315-10 gives guidelines for calculating A and VTS.(59) The dynamic shear rheometer test results are available in the MnROAD databases for the three cells under consideration. The performance grade (PG) for these cells, which were estimated from available data, are PG 70-16, PG 64-22, and PG 58-34 for cells 3, 19, and 34, respectively. Accordingly, the calculated A and VTS values were 10.641 and -3.548 for cell 3, 10.98 and -3.68 for cell 19, and 10.149 and -3.359 for cell 34.
Having determined the A and VTS values, the equation given in figure 130 was used to estimate the undamaged AC modulus as a function of temperature and frequency. The next step entailed the derivation of the existing AC modulus at various frequencies and at the AC layer temperature corresponding to the time of the TSDD testing based on the FWD backcalculated layer moduli. This step is explained next.
The existing AC moduli as a function of frequency was estimated by using the backcalculated AC layer moduli as anchor points and shifting the Witczak-derived AC modulus relationships as shown in figure 132. In this figure, ENDT and tr are the AC modulus and reduced time from the non-destructive testing (NDT), respectively. EPRED is the AC modulus from the prediction equation and δ is the minimum AC modulus.
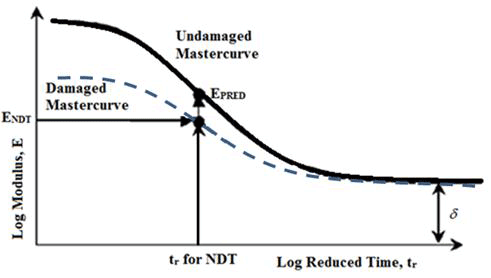
Figure 132. Graph. Development of existing AC modulus master curves from undamaged AC moduli.
The AC existing modulus master curve was obtained by applying the following equation to E* computed from the original master curve:
![]()
Figure 133. Equation. Existing modulus equation.
Where:
E*dam = Existing modulus.
δ= Regression parameter (from master curve), it is also the minimum AC modulus.
dAC = Fatigue damage in AC layer.
As stated earlier, the AC moduli obtained from the backcalculation of FWD deflection data reflect the temperatures at the time of FWD testing as well as for a frequency of about 30 Hz. Figure 132 illustrates the procedure used to derive the AC existing modulus master curves from the undamaged AC moduli.
Accordingly, using Witczak's equation and taking into consideration the fatigue damage factor, a reasonable AC modulus master curve can be generated. Moreover, this approach is similar to that proposed by Seo et al.(60)
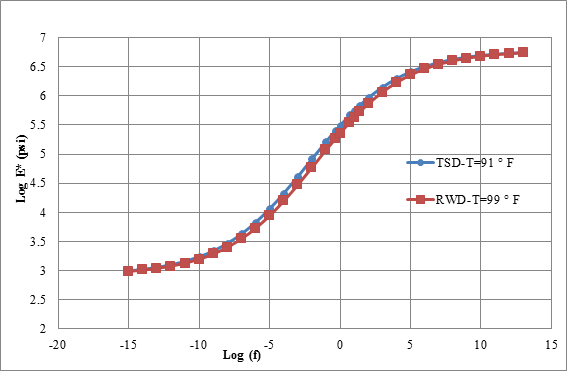
AC modulus master curves for the three MnROAD accuracy cells were developed using the procedure described in the previous subsection. Figure 134 through figure 136 show the resulting master curves for the temperatures associated with the TSDDs field tests. These curves appear realistic, with smooth variation in both the low and high frequencies. Hence, they were used as input to 3D-Move.
1 psi = 6.89 kPa
1 °F = 1.8 °C + 32
Figure 134. Graph. Master curves for cell 3 in TSDD field trials.
1 psi = 6.89 kPa
1 °F = 1.8 °C + 32
Figure 135. Graph. Master curves for cell 19 in TSDD field trials.
1 psi = 6.89 kPa
1 °F = 1.8 °C + 32
Figure 136. Graph. Master curves for cell 34 in TSDD field trials.
This section detailed the procedure that was used to obtain the pavement layer material properties, including viscoelastic characterization of the AC layers. The procedure relied on three data sources for estimating material properties: (1) laboratory testing, which included inspection, sampling, and testing data for various pavement materials used at MnROAD; (2) MnROAD cell specifications, which included layer thickness and type of layers; and (3) FWD deflection test results, which were done a few days before the TSDD field trials. Accordingly, it was possible to estimate the existing material layer properties for the three MnROAD accuracy cells. For unbound materials, layer moduli backcalculated from the FWD deflection measurements (see table 30) were used without modification. Table 38 presents the values used in 3D-Move for the unbound layers properties.
| Cell | Layer | Modulus (ksi) | Thickness (inches) | Poisson's Ratio | Unit Weight (pcf) | Damping Ratio (Percent) |
|---|---|---|---|---|---|---|
| 3 | Base | 68.8 | 43 | 0.35 | 105 | 5 |
| Subgrade | 17.7 | 122.4 | 0.4 | 105 | 5 | |
| 19 | Base | 32 | 31 | 0.35 | 105 | 5 |
| Subgrade | 6.1 | 18.1 | 0.4 | 105 | 5 | |
| 34 | Base | 15.7 | 12 | 0.35 | 110 | 5 |
| Subgrade | 8.5 | 46.3 | 0.4 | 110 | 5 |
1 ksi = 6.89 MPa
1 inch = 25.4 mm
1 pcf = 16 Kg/m3
Table 39 provides the AC layer moduli corresponding to the temperature at the time of the TSDD field trials at frequency of 30 Hz, where standard deviation was obtained from MODULUS backcalculation shown in table 30.
| Parameter | Device | Cell 3 | Cell 19 | Cell 34 |
|---|---|---|---|---|
| Average AC temperatures, °F | RWD | 99 | 63 | 90 |
| TSD | 91 | 68 | 91 | |
| Existing modulus at f = 30 Hz (mean), ksi | RWD | 554 | 550.1 | 522 |
| TSD | 716.8 | 468.5 | 506.5 | |
| Existing modulus at f = 30 Hz (mean minus standard deviation), ksi | RWD | 520 | 431.2 | 404.9 |
| TSD | 672.8 | 367.2 | 392.9 |
1 °F = 1.8° C + 32
1 ksi = 6.89 MPa
Characterization of the applied load is an important input for analyzing pavement structures. During the TSDD field trials, the loads carried by the axles were determined using a static scale owned and operated by MnROAD. Details concerning the axle configuration and contact pressure distribution of the TSD and RWD are presented next.
Because the weights of the devices were measured using a static scale, the 3-D Move results should be used with caution when simulating moving vehicles. Figure 137 illustrates the variation in the rear trailing axle load for a five-axle truck semitrailer traveling 25–30 mi/h (4.25–48.3 km/h). The dynamic load could vary by as much as 33 percent of the static load. This suggests that the variation of axle load, which has a direct influence on the computed deflection response, should be addressed.
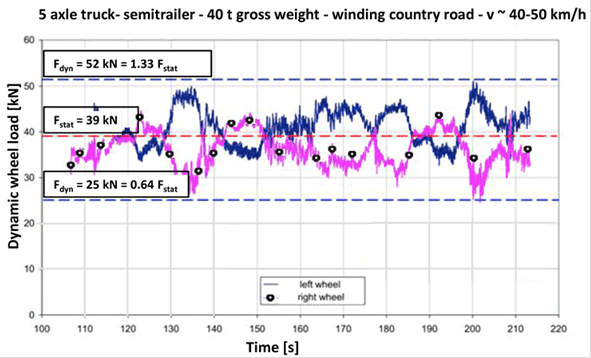
1 mi/h = 1.61 km/h
1 lbf = 0.0044 kN
Figure 137. Graph. Variation of five-axle truck semitrailer.(61)
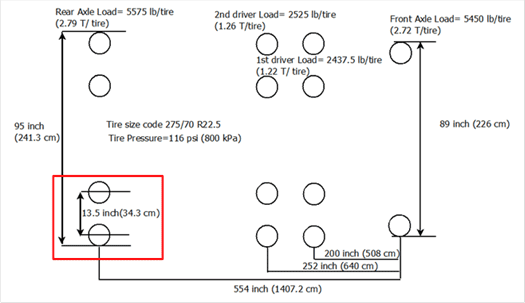
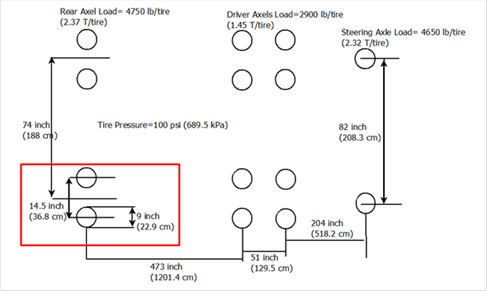
Figure 138 shows TSD axle configuration and axle loads, while figure 139 shows RWD axle configuration and axle loads. Since the deflection measuring sensors for the two TSDDs were mounted close to the dual tire of the rear trailing axles (shown in red box in the figures), the 3D-Move comparisons in this calibration effort focused on the responses generated by those axles. Because data on the pavement-tire contact pressure distribution were not available, the rear axles were modeled as dual circular loads with uniform contact pressure in the 3-D Move analyses. Based on the information presented in figure 137, the static loads measured with the two TSDDs were increased by 25 percent in two 3D-Move scenarios to explore the impact of axle load variations caused by the dynamic interaction with pavements.
1 inch = 25.4 mm
1 T = 0.907 Mg
1 lb = 0.454 kg
1 psi = 6.89 kPa
Figure 138. Illustration. TSD axle configuration and loads.
1 inch = 25.4 mm
1 T = 0.907 Mg
1 lb = 0.454 kg
1 psi = 6.89 kPa
Figure 139. Illustration. RWD axle configuration and loads.
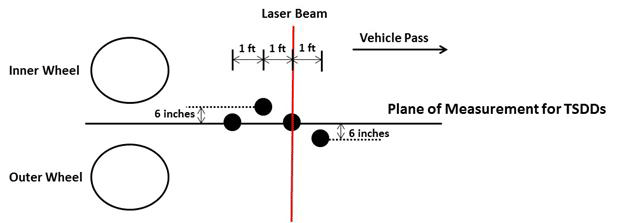
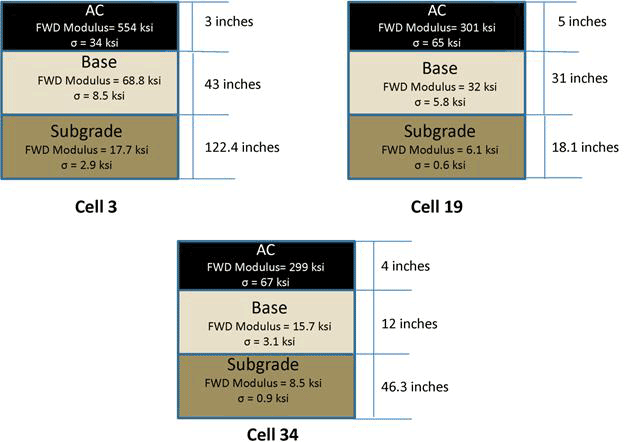
As discussed in chapter 5, four geophones and one accelerometer were installed near the pavement surface at each of the MnROAD accuracy cells. Since the measurement sensors for both TSDDs were located along the midline of the rear axle tires, two geophones (GEO 1 and GEO 3) were located along this midline plane, as shown in figure 140. To estimate the lateral wheel location relative to installed sensors, two video cameras were also used to record each pass of the TSDDs. A laser trigger device was also installed across the travel lane (transverse plane) for timing purposes. The location of the rear wheels relative to the location of the maximum displacement (i.e., lag distance) could be determined by superimposing the data from the laser device and measured displacement bowls. As noted in chapter 5, the geophone data were filtered and analyzed to arrive at the final surface deflection data. The TSDD field trials were conducted at various vehicle speeds, as summarized in table 40. Figure 141 provides a sketch of the pavement sections and average FWD backcalculated layer moduli and the standard deviation of cells 3, 19, and 34. These pavement structures represent pavements with AC thickness varying from 3–5 inches (76.2–127 mm) and a base thickness varying from 12–43 inches (304.8– 1,092.2 mm).
1 inch = 25.4 mm
1 ft = 0.305m
Figure 140. Illustration. Configuration and spacing of embedded project sensors.
Table 40. TSDD accuracy runs at MnROAD.
| Cell | TSDD | Velocity (mi/h) |
|---|---|---|
| 3 | TSD | 30 and 45 |
| RWD | 30, 45, and 60 | |
| 19 | TSD | 30, 45, and 60 |
| RWD | 30, 45, and 60 | |
| 34 | TSD | 30 and 45 |
| RWD | 30 and 45 |
1 mi/h = 1.61 km/h
1 ksi = 6.89 MPa
1 inch = 25.4 mm
σ = Standard deviation.
Figure 141. Illustration. Sketch of pavement structures used for cells 3, 19, and 34.
Initial attempts revealed that surface displacements computed from the 3D-Move analyses with mean tire loads and material properties did not match well with those given by the project sensors. The 3D-Move displacement basins were wider and of a smaller magnitude for all three accuracy cells and passes. Many possible factors might have contributed to this. They include the following:
Accordingly, after an extensive trial and error process, acceptable bracketing of the measured deflection responses was obtained with the following three 3D-Move case scenarios:
Case X was only used for cell 19 to bracket the measured values. As is shown later in this chapter, the 3D-Move predictions based on the above three scenarios bracketed well the measured responses (stresses, strains, and displacements) collected by the project and MnROAD sensors as well as with those measured by TSDDs.
The results from the analyses with 3D-Move using the case scenarios described in the previous section were initially compared with the measured values from the project sensors. TSDD measurements were also included in the comparisons. It should also be noted that TSD provided surface velocities at six points ahead of the wheels, while RWD measured displacement at two points.
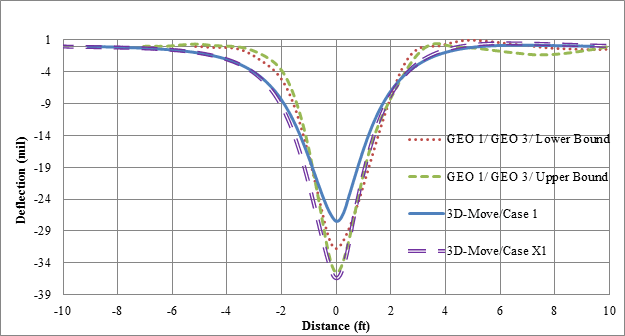
Figure 142 illustrates the comparison of 3D-Move results and measured deflections for cell 34 based on testing done by the TSD at a vehicle velocity of 30 mi/h (48.3 km/h). Since the main focus is the comparison of the deflection bowls (shape and maximum value), the plots were shifted to align so that the maximum displacement locations coincided. Since GEO 1 and GEO 3 are located along a plane parallel to the vehicle direction, they were expected to have similar deflection bowls. Therefore, the responses from these two sensors are shown in the figure. The variation between the deflection bowls given by these two sensors may be viewed as a measure of the overall variability in the measurements made by the project sensors and possibly any spatial variability between 2 ft (0.61 m) of distance between geophones (figure 140). The lower and upper bound of the project sensor data were determined by treating GEO 1 and GEO 3 data as independent datasets in figure 142 and figure 143. In all cases, 3D-Move adequately captured the maximum and shape of measured displacements. Case X1 provided the closest deflection basin to that measured. Figure 143 compares predicted and measured TSD surface velocities (maximum from field trials). While all 3D-Move case results had similar shapes as the measured ones, the case X1 predictions were closer to both project sensors and TSD measurements.
1 mil = 0.025 mm
1 ft = 0.305 m
Figure 142. Graph. 3D-Move predictions and measured deflections for cell 34 in TSD trials (device velocity = 30 mi/h (48.3 km/h)).
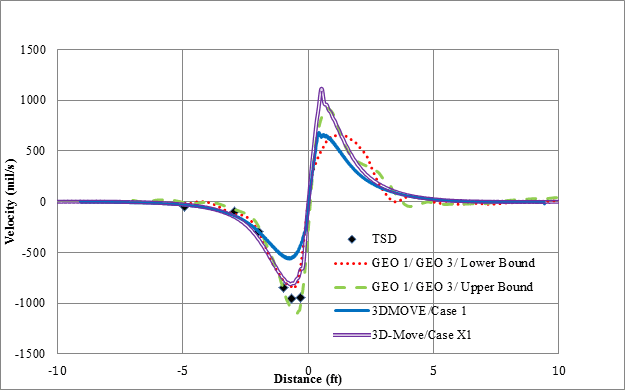
1 mil/s = 0.0254 mm/s
1 ft = 0.305 m
Figure 143. Graph. 3D-Move predictions and measured velocities for cell 34 in TSD trials (device velocity = 30 mi/h (48.3 km/h)).
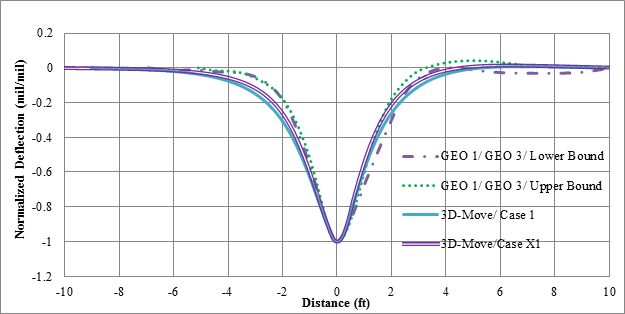
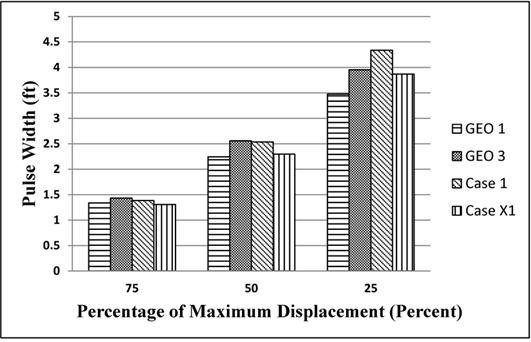
To compare the shapes of the computed and measured basins, normalized deflection basins were used. This was done by dividing each deflection basin by its maximum value. Figure 144, which shows normalized basins, reveals that the differences in shape among the computed and measured deflection basins were small. A comparison between the normalized basins can be achieved by using the widths of the deflection basins at three levels as shown in figure 145. Figure 146 shows the comparison of the pulse widths at various levels of normalized deflection. This figure shows that 3D-Move produced comparable normalized deflection basins. Similar plots were developed for all possible combinations of TSDD speeds and accuracy cells, and they showed the same trends as shown in the example figures (i.e., figure 144 and figure 146 through figure 150) included within this chapter. The data used to generate all of these figures may be obtained directly from FHWA.
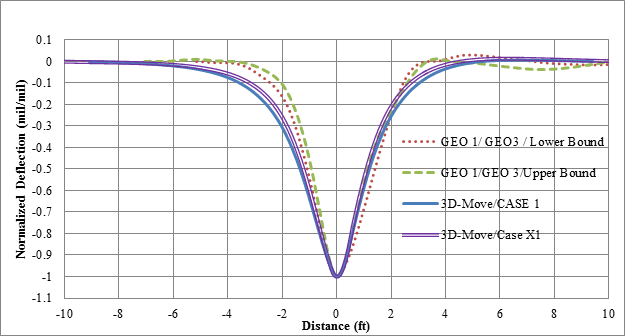
1 mil/mil = 1 mm/mm
1 ft = 0.305 m
Figure 144. Graph. Normalized basins of 3D-Move predictions and measured deflections for cell 34 in TSD trials (device velocity = 30 mi/h (48.3 km/h)).
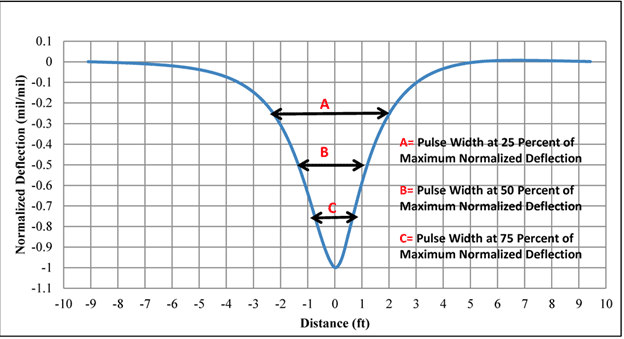
1 mil/mil = 1 mm/mm
1 ft = 0.305 m
Figure 145. Graph. Definition of percentage of maximum displacement.
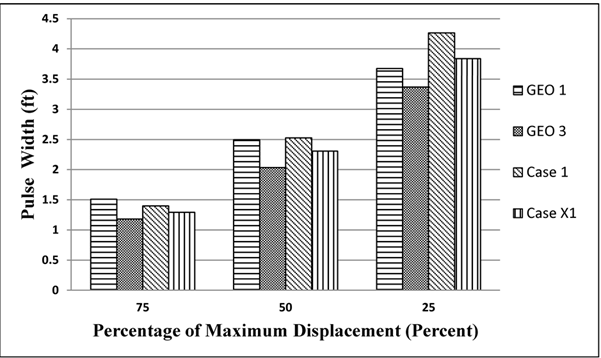
1 ft = 0.305 m
Figure 146. Graph. Comparison of normalized deflection basins at various levels for cell 34 in TSD trials (device velocity = 30 mi/h (48.3 km/h)).
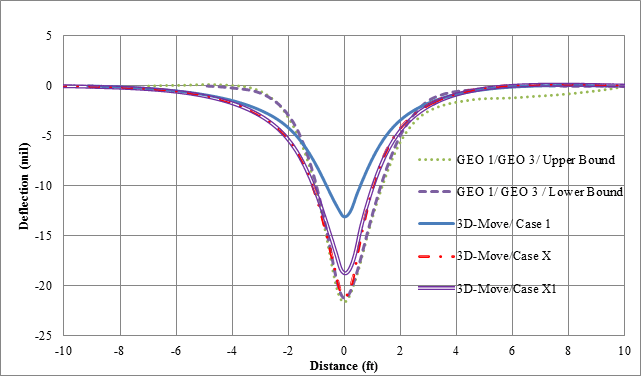
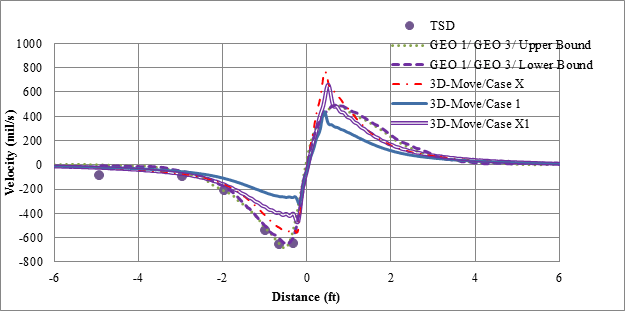
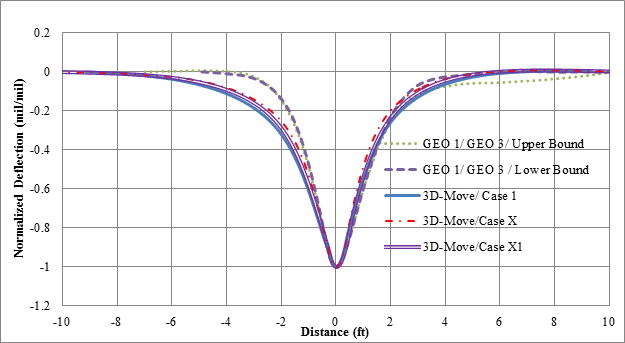
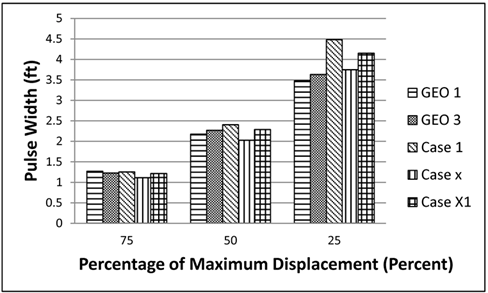
Figure 147 shows the comparison of 3D-Move and measured deflection basins for cell 19 during TSD testing at 30 mi/h (48.3 km/h). Unlike cell 34, case X yielded closer results to those measured. Figure 148 compares the prediction and measured surface velocities. Figure 149 and figure 150 present the comparison of the normalized deflection basins. Again, a close match can be observed between the 3D-Move predictions and those measured.
1 mil = 0.0254 mm
1 ft = 0.305 m
Figure 147. Graph. 3D-Move predictions and measured deflections for cell 19 in TSD trials (device velocity = 30 mi/h (48.3 km/h)).
1 mil/s = 0.0254 mm/s
1 ft = 0.305 m
Figure 148. Graph. 3D-Move predictions and measured velocities for cell 19 in TSD trials (device velocity = 30 mi/h (48.3 km/h)).
1 mil /mil = 1 mm/mm
1 ft = 0.305 m
Figure 149. Graph. Normalized basins of 3D-Move predictions and measured deflections for cell 19 in TSD trials (device velocity = 30 mi/h (48.3 km/h)).
1 ft = 0.305 m
Figure 150. Graph. Comparison of normalized deflection basins at various levels for cell 19 in TSD trials (device velocity = 30 mi/h (48.3 km/h)).
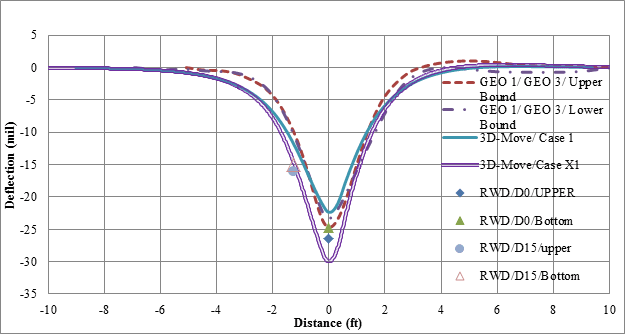
The 3D-Move results were also compared with those from the RWD device. Again as a representative plot, figure 151 shows 3D-Move and measured deflection bowls as well as the two measured deflection values from RWD. 3D-Move results fall within the geophone measured responses, and the RWD measurements were close to the predicted results. The pulse widths of the normalized deflection basins shown in figure 152 and figure 153 were also similar.
1 mil = 0.0254 mm
1 ft = 0.305 m
Figure 151. Graph. 3D-Move predictions and measured deflections for cell 34 for RWD trials (device velocity = 30 mi/h (48.3 km/h)).
1 mil/mil = 1 mm/mm
1 ft = 0.305 m
Figure 152. Graph. Normalized basins of 3D-Move predictions and measured deflections for cell 34 in RWD trials (device velocity = 30 mi/h (48.3 km/h)).
1 ft = 0.305 m
Figure 153. Graph. Comparison of normalized deflection basins at various levels for cell 34 in RWD trials (device velocity = 30 mi/h (48.3 km/h)).
The 3D-Move analyses were conducted using inputs derived based on the following considerations:
Several 3D-Move analyses were undertaken in an attempt to bracket the measured surface deflection data (peak and basin shape). In the process, due consideration was given to the selection of 3D-Move inputs (material properties and loading) so that they were rationally determined and the adjustments were defensible.
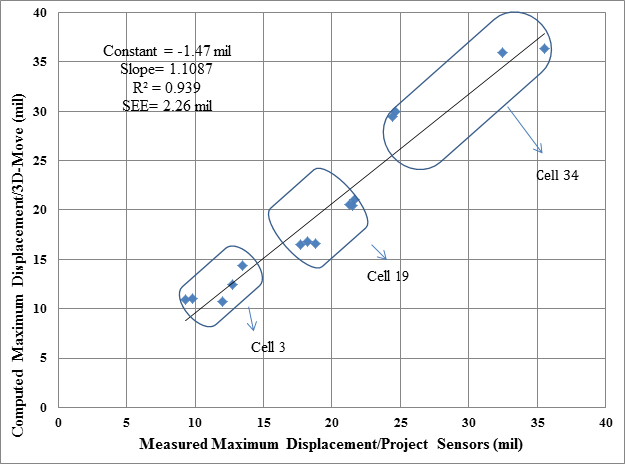
It was shown that 3D-Move results fell within the measured time histories from project geophones. Figure 154 shows the comparison of maximum displacements computed by 3D-Move and those measured by the project sensors for all accuracy runs made with the TSD and RWD. In this comparison, case X1 was used for cells 3 and 34, and case X was used for cell 19. When project sensor measurements were plotted, the largest displacement given by either GEO 1 or GEO 3 (from all field trials) was selected. The figure shows a good match between computed and measured maximum displacements.
1 mil = 0.0254 mm
Figure 154. Graph. 3D-Move computed maximum displacement versus measured displacement for all cells and vehicle velocities during RWD and TSD trials.
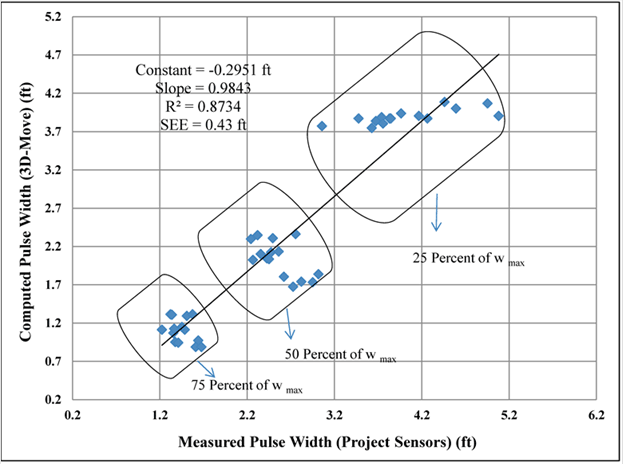
In addition to maximum displacement, it was also important to have a good representation of the deflection bowls since TSDDs use deflections at various points of a bowl to predict pavement layer condition. Figure 155 shows the comparison of the shapes of normalized deflection bowls that gave the maximum deflection with 3D-Move analyses and sensor measurements (GEO 1 and GEO 3). Three levels of the normalized deflection bowls (75, 50, and 25 percent of maximum displacement) are reported. In this figure, wmax is the normalized maximum deflection. Based on this information, it was concluded that 3D-Move can predict the displacement bowl similar to those measured by geophones.
1 ft = 0.305 m
Figure 155. Graph. 3D-Move computed pulse width versus measured pulse for all cells and velocities in RWD and TSD trials.
This subsection provides a comparison between the 3D-Move results and the measured MnROAD sensor data. Unlike the earlier sensor comparisons, which focused on surface deflections, the comparisons presented in this subsection consider stresses and strains at various interior pavement locations. Since the load-induced stresses and strains are critical inputs to pavement performance predictions, this effort is important in the validation of the applicability of the 3D-Move for pavement response predictions to be used in identifying the most promising indices from TSDD measurements that best relate to pavement structure.
The existing instrumentations at the MnROAD facility include normal strain responses in the longitudinal direction and in some cases in the transverse direction as well as vertical pressure histories in unbound base and subgrade layers. The measurements from these sensors can be directly compared with those computed by 3D-Move. However, it is important to recognize that measurements made by these sensors reflect an average value over the entire dimensions of the sensors (e.g., pressure cell measurements reflect an average Earth pressure over a diameter of 9 inches (228.6 mm)). Table 41 presents the sensors that were monitored during the accuracy runs.
| Sensor ID | Cell Number | Facility | Sensor Type | Latitude (Degree) | Â Longitude (Degree) | Depth (inches) |
|---|---|---|---|---|---|---|
| 03LE101 | 3 | ML | Longitudinal SG | 45.27331792 | -93.73110608 | 9.3 |
| 03LE102 | 3 | ML | Longitudinal SG | 45.27332065 | -93.73111185 | 9.4 |
| 03LE103 | 3 | ML | Longitudinal SG | 45.27332372 | -93.73111822 | 9 |
| 03PG103 | 3 | ML | Pressure cell | 45.27329061 | -93.73105228 | 14 |
| 19LE101 | 19 | ML | Longitudinal SG | 45.25624056 | -93.69966629 | 4.9 |
| 19LE104 | 19 | ML | Longitudinal SG | 45.2562641 | -93.69970936 | 4.7 |
| 19PG101 | 19 | ML | Pressure cell | 45.25621817 | -93.69962245 | 18 |
| 19PG103 | 19 | ML | Pressure cell | 45.25625157 | -93.69968785 | 18.2 |
| 34LE202 | 34 | LVR | Longitudinal SG | N/A | N/A | 3.5 |
| 34LE203 | 34 | LVR | Longitudinal SG | N/A | N/A | 3.5 |
| 34PG201 | 34 | LVR | Pressure cell | N/A | N/A | 15.9 |
| 34PG202 | 34 | LVR | Pressure cell | N/A | N/A | 15.9 |
| 34PG203 | 34 | LVR | Pressure cell | N/A | N/A | 15.9 |
1 inch = 25.4 mm
ML = Main line.
SG = Strain gauge.
N/A = Not available.
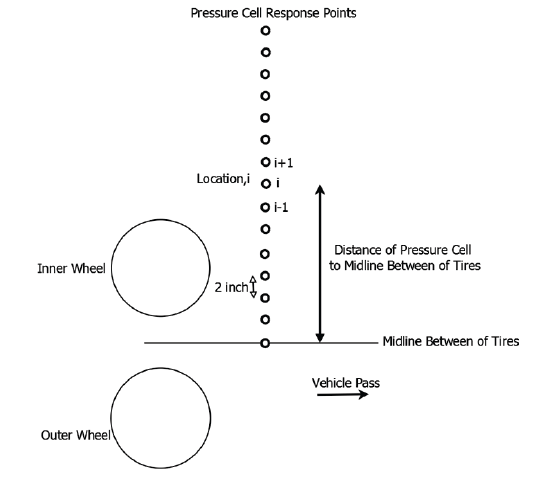
The MnROAD pressure cells measured the average dynamic pressure applied to the entire plate, while the 3D-Move responses were computed point by point (i.e., at any given single location). Therefore, an average estimate of the computed pressure over the entire plate diameter was used for comparison purposes. Since the location of the wheel during the field trials were not known precisely, it was decided to compute 3D-Move responses at many transverse locations as an attempt to bracket the possible variation in the responses as a result of wheel wander. Figure 156 shows the response points considered along the transverse direction in 3D-Move runs. These points are located at 2-inch (50.8-mm) intervals with enough coverage so that the role of the wheel wander can be investigated. The difference between the average pressure on the plate and pressure at the center of the plate was less than 5 percent.
1 inch = 25.4 mm
Figure 156. Illustration. Response points for normal pressure in 3D-Move.
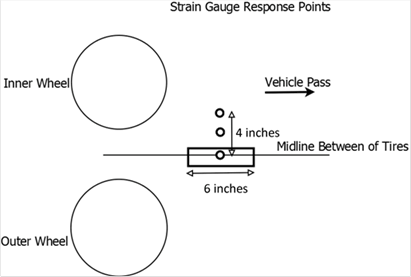
The average MnROAD strain responses were computed over the length of the strain gauges, which were 6 inches (152.4 mm) long. Figure 157 shows the locations used in 3D-Move to determine the role of wheel wander in the comparison of strain responses.
1 inch = 25.4 mm
Figure 157. Illustration. Response points for strain gauges in 3D-Move.
In the 3D-Move versus project sensor comparison, the following same three scenarios for analyses were found to be appropriate:
These cases were used to compare the MnROAD sensor measurements with the 3D-Move responses.
It became apparent from the start that the earth pressures predicted by 3D-Move were substantially greater than those measured by the MnROAD sensors. The differences were larger than what could be realistically attributed to the wheel wander. To reconcile this difference, other sources where earth pressures had been predicted and measured were reviewed. As a first step, the static LE software WESLEA results were evaluated for the TSDDs loading. Unlike 3D-Move, WESLEA cannot provide the response time history nor can it provide the results as a function of vehicle speed. The results of WESLEA were compared only with the responses from the slowest TSDD speed, which was 30 mi/h (48.3 km/h) for both the RWD and TSD. The 3D-Move and WESLEA pressures were compared mainly to determine whether the measured earth pressures were reasonable.
Table 39, which was presented earlier, contains the AC moduli used in the WESLEA analyses. The existing AC moduli at a frequency of 30 Hz were adjusted to the temperature at the time of the TSDDs trials. The FWD backcalculated values were directly used for unbound layers.
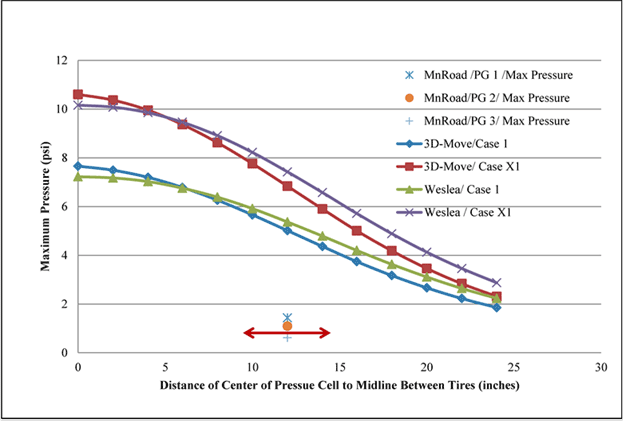
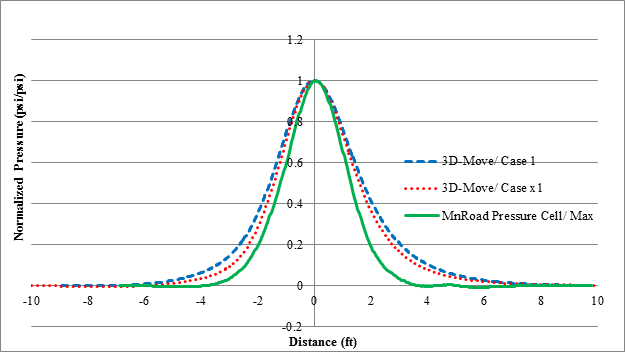
Table 42 and figure 158 show the 3D-Move and WESLEA computed vertical normal pressures along various transverse offsets for the TSD pass along cell 34. The values for each case are close to one another. Minor differences could be attributed to issues related to the viscoelastic characterization of the AC layer and to vehicle speed in 3D-Move. As seen in figure 158, the values measured by the MnROAD sensors were significantly lower (a factor of about 4 to 6). Conversely, the normalized predicted and measured earth pressures shown in figure 159 agree closely, leading to questioning of the correctness of the measurements. These sensors were installed during construction about 5 years before the TSDDs trials, and hence it is possible that the calibration was off or they are damaged. It should also be noted that the earth pressures measured in cell 19 in both TSDDs had substantial negative values, which were unrealistic. This information, coupled with the close match with 3D-Move comparisons with WESLEA, led to the conclusion that the MnROAD earth pressure sensor data were suspect.
| Offset Distance (inches) | Pressure From 3D-Move Case 1 (psi) | Pressure From WESLEA Analyses Case 1 (psi) | Pressure From 3D-Move Case X1 (psi) | Pressure from WESLEA Analyses Case X1 (psi) |
|---|---|---|---|---|
| 0 | 7.7 | 7.2 | 10.6 | 10.2 |
| 2 | 7.5 | 7.2 | 10.4 | 10.1 |
| 4 | 7.2 | 7 | 10 | 9.9 |
| 6 | 6.8 | 6.8 | 9.4 | 9.5 |
| 8 | 6.3 | 6.4 | 8.6 | 8.9 |
| 10 | 5.7 | 5.9 | 7.8 | 8.2 |
| 12 | 5 | 5.4 | 6.8 | 7.4 |
| 14 | 4.4 | 4.8 | 5.9 | 6.6 |
| 16 | 3.7 | 4.2 | 5 | 5.7 |
| 18 | 3.2 | 3.6 | 4.2 | 4.9 |
| 20 | 2.7 | 3.1 | 3.5 | 4.1 |
| 22 | 2.2 | 2.6 | 2.8 | 3.5 |
| 24 | 1.9 | 2.2 | 2.3 | 2.9 |
1 inch = 25.4 mm
1 psi = 6.89 kPa
1 psi = 6.89 kPa
1 inch = 25.4 mm
Figure 158. Graph. 3D-Move versus WESLEA predictions and MnROAD pressure cell for cell 34 in TSD trials (device velocity = 30 mi/h (48.3 km/h)).
1 psi/psi = 1 kPa/kPa
1 ft = 0.305 m
Figure 159. Graph. Normalized basins of 3D-Move predictions and MnROAD pressure cell measurement for cell 34 in TSD trials (device velocity = 30 mi/h (48.3 km/h)).
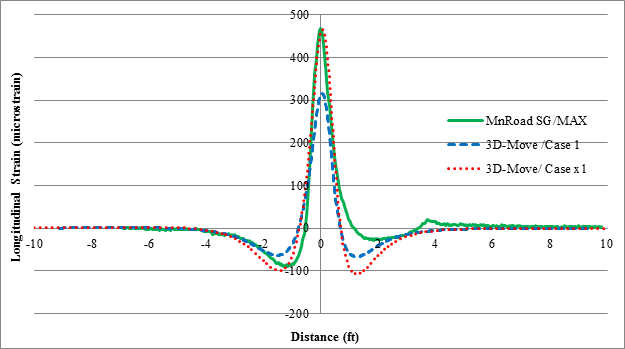
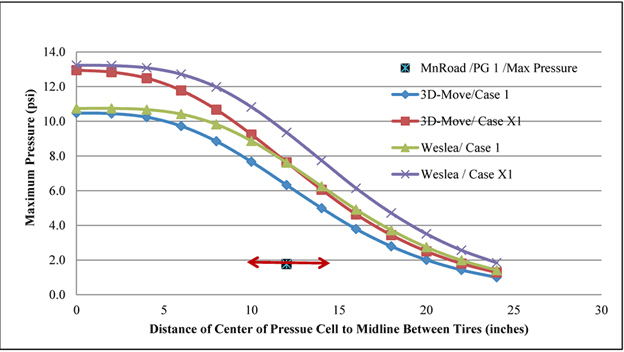
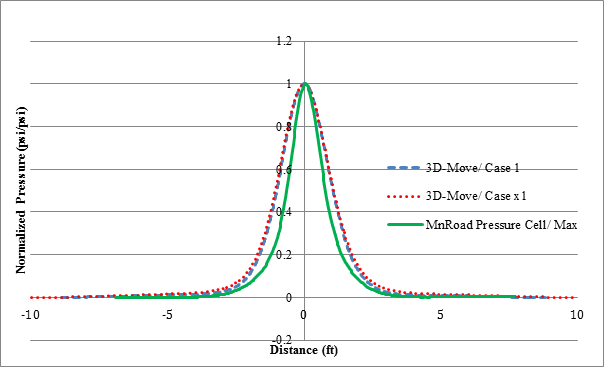
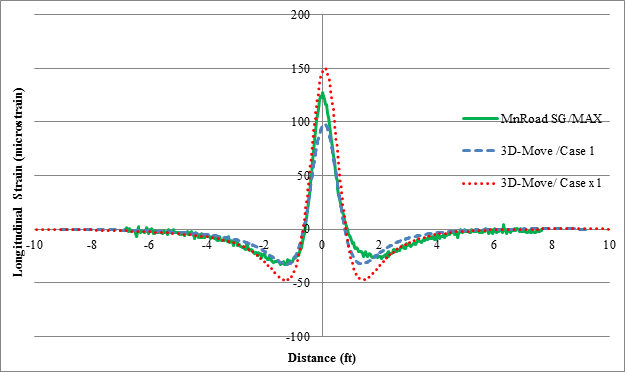
Figure 160 compares the measured and predicted longitudinal strains in cell 34 for the TSD runs. Unlike the case of the earth pressures, the calculated longitudinal strains from 3D-Move matched well with the measured data from the MnROAD strain gauges. Table 43 and figure 161 through figure 163 show the comparison of the measured and calculated vertical pressure, normalized vertical pressure, and longitudinal strains for the RWD runs for cell 3. Similar to the TSD findings, the values for longitudinal strain were predicted closely by 3D-Move.
Similar plots were developed for all possible combinations of TSDD speeds and accuracy cells, and they showed the same trends as shown in the example figures included with in this chapter. The data used to generate all of these figures/tables may be obtained directly from FHWA.
1 ft = 0.305 m
Figure 160. Graph. 3D-Move versus MnROAD strain gauge measurement for cell 34 in TSD trials (device velocity = 30 mi/h (48.3 km/h)).
| Offset Distance (inches) | Pressure From 3D-Move Case 1 (psi) | Pressure From WESLEA Analyses Case 1 (psi) | Pressure From 3D-Move Case X1 (psi) | Pressure From WESLEA Analyses Case X1 (psi) |
|---|---|---|---|---|
| 0 | 10.5 | 10.7 | 12.9 | 13.2 |
| 2 | 10.4 | 10.7 | 12.8 | 13.2 |
| 4 | 10.2 | 10.7 | 12.5 | 13.1 |
| 6 | 9.7 | 10.4 | 11.8 | 12.7 |
| 8 | 8.8 | 9.8 | 10.7 | 12 |
| 10 | 7.7 | 8.9 | 9.2 | 10.8 |
| 12 | 6.3 | 7.6 | 7.6 | 9.4 |
| 14 | 5 | 6.2 | 6.1 | 7.7 |
| 16 | 3.8 | 4.9 | 4.6 | 6.1 |
| 18 | 2.8 | 3.7 | 3.4 | 4.7 |
| 20 | 2 | 2.7 | 2.5 | 3.5 |
| 22 | 1.4 | 2 | 1.8 | 2.6 |
| 24 | 1 | 1.4 | 1.3 | 1.8 |
1 inch = 25.4 mm
1 psi = 6.89 kPa
1 psi = 6.89 kPa
1 inch = 25.4 mm
Figure 161. Graph. 3D-Move versus WESLEA predictions and MnROAD pressure cell for cell 3 in RWD trials (device velocity = 30 mi/h (48.3 km/h)).
1 psi/psi = 1 kPa/kPa
1 ft = 0.305 m
Figure 162. Graph. Normalized basins of 3D-Move predictions and MnROAD pressure cell measurement for cell 3 in RWD trials (device velocity = 30 mi/h (48.3 km/h)).
1 ft = 0.305 m
Figure 163. Graph. 3D-Move versus MnROAD strain gauge measurement from cell 3 in RWD trials (device velocity = 30 mi/h (48.3 km/h)).
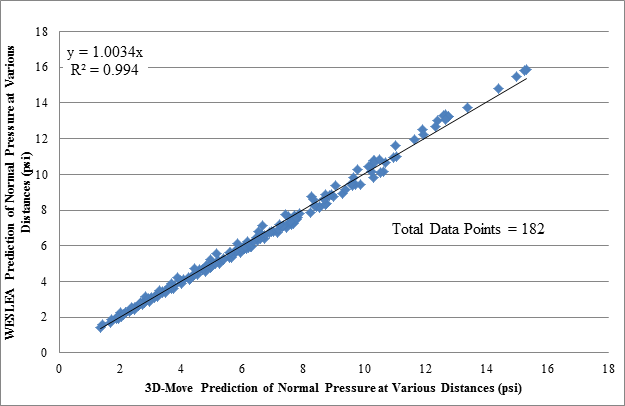
The vertical pressures measured by MnROAD sensors were significantly less by a factor of 4 to 6 than those computed by 3D-Move. The possible transverse wheel wander could not explain the differences. However, the shapes of the pressure histories, when normalized, closely matched with those given by 3D-Move. Figure 164 shows the comparison of 3D-Move prediction of normal pressures and those computed from WESLEA for all accuracy passes and cells. In this graph, only the 3D-Move results computed with the lowest vehicle speed are shown. The 3D-Move normal pressure values were consistent and reasonable with WESLEA predictions, unlike those measured with MnROAD sensors.
The maximum longitudinal strains from the MnROAD measurements and 3D-Move predictions were similar (see figure 165). Accordingly, it can be concluded that 3D-Move is capable of predicting field measured surface displacement histories and interior pavement responses (stresses and strains) and could be used to evaluate pavement responses under TSDD loadings.
1 psi = 6.89 kPa
Figure 164. Graph. Computed normal pressure for 3D-Move versus WESLEA.
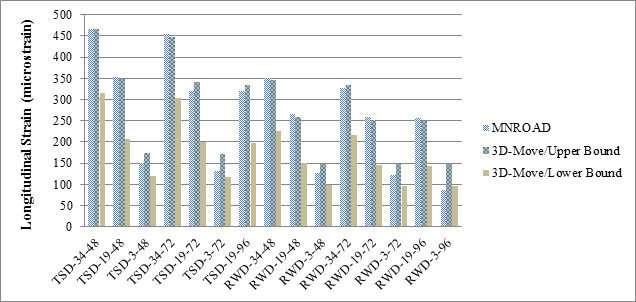
Figure 165. Graph. Maximum longitudinal strains from MnROAD sensors and 3D-Move computations.