U.S. Department of Transportation
Federal Highway Administration
1200 New Jersey Avenue, SE
Washington, DC 20590
202-366-4000
Federal Highway Administration Research and Technology
Coordinating, Developing, and Delivering Highway Transportation Innovations
| REPORT |
| This report is an archived publication and may contain dated technical, contact, and link information |
|
| Publication Number: FHWA-HRT-10-066 Date: October 2011 |
Publication Number: FHWA-HRT-10-066 Date: October 2011 |
To evaluate the effectiveness of preventive maintenance treatments, the performance of pavement sections with various treatments was compared to the performance of pavement sections with different treatments as well as to the control section. To make these comparisons possible, it was necessary to select parameters that reflected the actual performance of the pavement over the monitoring period of the experiment. Performance indicators were based on pavement distresses collected during the surveys, and this chapter describes the parameter selected for the analysis carried out in this study.
Several performance indicators have been utilized in past studies of LTPP experiments. The literature review conducted in this study identified the following list of indicators and the study where they were applied:
Several parameters were evaluated, and the indicator selected for this study was the weighted distress (WD) or average distress value over the total survey period, as calculated using the following equation presented in figure 1:

Figure 1. Equation. Weighted distress.
Where:
WD = Weighted distress average value over the total
survey period.
Di = Distress value measured at the ith survey.
Pi + 1 = Period (in years) between survey i and survey i + 1 (i = 0 is the initial distress level immediately after the
treatment).
n = Total number of surveys for the section.
The weighted average represents the total normalized area (per year) under the distress versus time curve. As such, it is a measure of pavement performance relative to the specific distress over the entire monitoring period. The normalization to total time the section was in service provides a means for comparing survey periods that may be different, which allowed the comparison of performance for both the short term and long term.
A hypothetic example of the calculations is provided below. Table 25 and figure 2 contain IRI measurements for a site surveyed for 8 years. The sections were surveyed five times. WD-IRI represents the weighted average value of IRI measured for five surveys conducted in different years. In an 8-year analysis period, thin overlay outperformed other treatments with a WD-IRI value of 4.80 ft/mi (0.91 m/km). Slurry seal presented the worst performance, with a WD-IRI of 7.66 ft/mi (1.45 m/km) over the 8-year period. It can be noted that sections had similar IRI when the experiment was initiated.
Table 25. Example demonstrating WD-IRI concept.
Time (years) |
Control Section |
Thin Overlay |
Slurry Seal |
Crack Seal |
Chip Seal |
|||||
|---|---|---|---|---|---|---|---|---|---|---|
IRI (m/km) |
WD |
IRI (m/km) |
WD |
IRI (m/km) |
WD |
IRI (m/km) |
WD |
IRI (m/km) |
WD |
|
0 |
0.81 |
0.00 |
0.81 |
0.00 |
0.81 |
0.00 |
0.83 |
0.00 |
0.81 |
0.00 |
2 |
1.00 |
0.91 |
0.84 |
0.83 |
1.11 |
0.96 |
1.16 |
1.00 |
0.86 |
0.84 |
3 |
1.21 |
0.97 |
0.84 |
0.83 |
1.41 |
1.06 |
1.25 |
1.07 |
0.90 |
0.85 |
5 |
1.51 |
1.13 |
0.90 |
0.85 |
1.71 |
1.26 |
1.30 |
1.15 |
0.89 |
0.87 |
8 |
2.02 |
1.37 |
1.11 |
0.91 |
1.81 |
1.45 |
1.60 |
1.26 |
1.71 |
1.03 |
1 ft = 0.305 m
1 mi = 1.61 km
1 ft = 0.305 m
1 mi = 1.61 km
Figure 2. Graph. Example of IRI trends to calculate WD-IRI.
The statistical test selected for the analysis was the Friedman test, a nonparametric test (distribution-free) used to compare paired observations on a subject. It is also called a nonparametric randomized block analysis of variance. Unlike the parametric repeated measures ANOVA or paired t-test, this test makes no assumptions about the distribution of the data (e.g., normality). In addition, unlike the t-test, the Friedman test can be used for multiple comparisons, as is the case for the SPS-3 and SPS-4 experiments with four and two different types of treatments, respectively, in addition to the control section. The Friedman test, like many nonparametric tests, uses the ranks of data rather than their raw values. The test statistic for the Friedman test is a chi-square with n - 1 degrees of freedom, where n is the number of repeated measures.
The performance of pavement sections with preventive maintenance treatments was compared to the performance of similar pavements without the treatment (control sections) as well as between the different treatment types. The Friedman test was applied for all design categories and for each distress. The values used were the WDs normalized for the analysis period. The results indicated whether a statistically significant difference existed between any pair of treatments.
Table 26 provides an example of Friedman test results of the SPS-3 experiment for wet climates. A total of 41 sites were located in wet climatic regions with fatigue cracking measurements available for all treatments with 4 degrees of freedom. Based on the test results, thin overlay and chip seal sections had the lowest sum of ranks, and slurry seal and control sections had the highest sum of ranks. A lower sum of ranks indicated better performance because distresses were generally lower over the monitoring period. Analysis results indicated that the difference in performance of thin overlay and chip seal sections compared to slurry seal and the control sections was significant. Only chip seal performed significantly better than crack seal. The difference between other treatments was not significant. The Friedman test value was 49.12 with p < 0.0001.
Table 26. Friedman results of fatigue cracking for treatments in wet climates.
Thin Overlay |
Slurry Seal |
Crack Seal |
Control Section |
Chip Seal |
|
|---|---|---|---|---|---|
Sum of ranks |
99.50 |
156.50 |
137.50 |
148.50 |
73.00 |
Median |
2.30 |
20.40 |
5.80 |
12.70 |
0.00 |
Average of ranks |
2.43 |
3.82 |
3.35 |
3.62 |
1.78 |
Standard deviation |
22.64 |
54.15 |
63.26 |
103.31 |
8.04 |
Comparisons |
Difference |
p-Value |
|||
Thin overlay versus slurry seal |
57 |
< 0.05 |
|||
Thin overlay versus crack seal |
38 |
not significant |
|||
Thin overlay versus control section |
49 |
< 0.05 |
|||
Thin overlay versus chip seal |
26.5 |
not significant |
|||
Slurry seal versus crack seal |
19 |
not significant |
|||
Slurry seal versus control section |
8 |
not significant |
|||
Slurry seal versus chip seal |
83.5 |
< 0.05 |
|||
Crack seal versus control section |
11 |
not significant |
|||
Crack seal versus chip seal |
64.5 |
< 0.05 |
|||
Control section versus chip seal |
75.5 |
< 0.05 |
|||
The effectiveness of treatments in prolonging flexible pavement life was evaluated using two load-associated distresses (fatigue cracking and rutting) and ride quality as measured in surveys conducted for the SPS-3 experiment. Performance was evaluated as the deterioration measured by fatigue cracking, rutting, and IRI.
Figure 3 through figure 5 illustrate box-whisker plots of WD index for fatigue cracking (WD-fatigue), rutting (WD-rutting), and IRI (WD-IRI). The boundaries of the box present lower and upper quartiles, and the middle line is the median. The whisker marks the minimum and maximum limits of WD. Only surveys providing distress measurements for all treatments were used to draw the graphs, and some outliers were excluded.
As shown in figure 3, thin overlay and chip seal sections exhibited lower fatigue cracking levels compared to slurry seal, crack seal, and the control section. Chip seal also presented the smallest minimum/maximum range. Sections that were treated with crack seal had lower WD-fatigue compared to slurry seal and the control section. The slurry seal alternative seemed to be less effective in mitigating the progression of fatigue cracking over the monitored period.
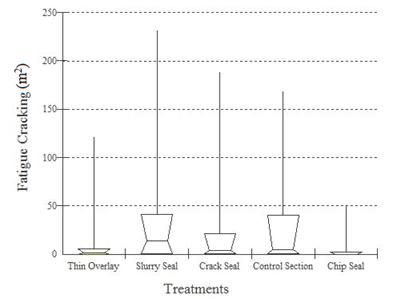
1 ft2 = 0.093 m2
Figure 3. Graph. Box-whisker plot for WD-fatigue of SPS-3 sections.
Rutting levels presented considerable differences between sections that were treated with thin overlay and other sections (see figure 4). Thin overlay was effective in reducing rutting immediately after the treatment, and, as a consequence, those sections presented a lower level of rutting over the analysis period. Although chip seal marginally outperformed the rest of the treatments, it provided little advantage over the remaining treatments.
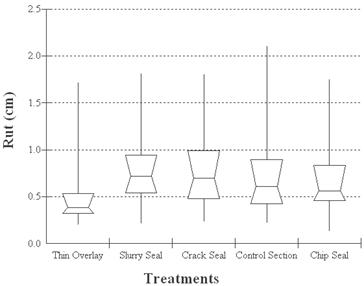
1 inch = 2.54 cm
Figure 4. Graph. Box-whisker plot for WD-rutting of SPS-3 sections.
A similar conclusion was found in terms of IRI performance (see figure 5). As expected, thin overlay was the most effective maintenance option in mitigating IRI over the years. This type of treatment was the most effective in reducing initial roughness immediately after treatment rather than providing a significant structural improvement of the pavement section.
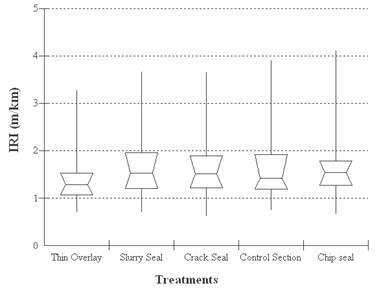
1 ft = 0.305 m
1 mi = 1.61 km
Figure 5. Graph. Box-whisker plot for WD-IRI of SPS-3 sections.
Although the box-whisker plots showed some indication of which treatments performed best, the Friedman test was applied to the WD indexes to identify if the differences were statistically significant. Results from the test runs for all design categories are summarized in table 27.
Table 27. Summary of flexible pavement performance results based on Friedman test.
Condition |
Fatigue Cracking |
Rutting |
IRI |
|||||||||||
|---|---|---|---|---|---|---|---|---|---|---|---|---|---|---|
TH |
SL |
CR |
CO |
TH |
SL |
CR |
CO |
TH |
SL |
CR |
CO |
|||
Temperature |
Freeze |
SL |
TH |
TH |
TH |
|||||||||
CR |
TH |
TH |
||||||||||||
CO |
TH |
TH |
||||||||||||
CH |
CH |
CH |
CH |
TH |
CH |
TH |
||||||||
No- freeze |
SL |
TH |
||||||||||||
CR |
TH |
|||||||||||||
CO |
TH |
|||||||||||||
CH |
CH |
CH |
CH |
TH |
||||||||||
Precipitation |
Wet |
SL |
TH |
TH |
||||||||||
CR |
TH |
|||||||||||||
CO |
TH |
TH |
||||||||||||
CH |
CH |
CH |
CH |
TH |
||||||||||
Dry |
SL |
TH |
||||||||||||
CR |
TH |
|||||||||||||
CO |
TH |
|||||||||||||
CH |
CH |
CH |
CH |
CH |
||||||||||
Subgrade |
Coarse |
SL |
TH |
TH |
||||||||||
CR |
TH |
|||||||||||||
CO |
TH |
|||||||||||||
CH |
CH |
CH |
CH |
TH |
TH |
|||||||||
Fine |
SL |
TH |
||||||||||||
CR |
TH |
|||||||||||||
CO |
TH |
TH |
||||||||||||
CH |
CH |
CH |
CH |
TH |
||||||||||
Traffic |
High |
SL |
TH |
TH |
||||||||||
CR |
TH |
TH |
||||||||||||
CO |
TH |
TH |
TH |
|||||||||||
CH |
CH |
CH |
CH |
TH |
TH |
|||||||||
Low |
SL |
TH |
CO |
|||||||||||
CR |
TH |
|||||||||||||
CO |
CO |
|||||||||||||
CH |
CH |
CH |
CH |
TH |
||||||||||
Pavement Condition |
Poor |
SL |
TH |
TH |
TH |
|||||||||
CR |
TH |
TH |
TH |
|||||||||||
CO |
TH |
TH |
TH |
|||||||||||
CH |
CH |
CH |
CH |
TH |
||||||||||
Fair |
SL |
TH |
||||||||||||
CR |
TH |
|||||||||||||
CO |
TH |
|||||||||||||
CH |
CH |
TH |
||||||||||||
Good |
SL |
TH |
||||||||||||
CR |
TH |
|||||||||||||
CO |
||||||||||||||
CH |
CH |
|||||||||||||
TH = thin overlay, SL = slurry
seal, CR = crack seal, CO = control, and CH = chip seal.
Note: Blank cells indicate that there is no significant difference between the
two treatments being compared.
To compare the treatments, design conditions from the left side of the table and a distress from the top of the table should be selected. Then, one of the treatments from the third column and another one from the top are selected for comparison. If the intersecting cell is empty, there is no significant difference between the two treatments. Otherwise, the cell is filled with the treatment that performed better. For example, the first cell on the left is filled with "TH," indicating that thin overlay is significantly superior to slurry seal with respect to fatigue cracking in freezing climates.
The main objective of the SPS-3 experiment was to provide data to identify the effects of major design factors on the performance of maintenance alternatives. Specifically, the experiment was intended to identify whether different climate conditions, subgrade material, traffic level, or initial pavement condition affect the choice of a preferred treatment. Therefore, the results from different design factors were compared for each type of distress and summarized in the following sections.
Temperature had a significant effect when comparing thin overlay with slurry seal and the control section. Thin overlays outperformed both treatments in freeze zones; however, temperature did not have an additional impact on the performance of other alternatives since chip seal outperformed slurry seal, crack seal, and the control section in both freeze and no-freeze zones. The same conclusion is valid for precipitation. Thin overlay outperformed slurry seal and the control section only in wet regions. There were no other significant differences in the performance of other treatments with respect to precipitation.
Subgrade type affected the performance of thin overlays relative to other treatments. Thin overlay generally performed better than slurry seal when the subgrade was comprised of coarse material. Traffic affected the performance of the thin overlay when compared to slurry seal and the control section. Under higher traffic levels, the performance of thin overlays prevailed over both the control and slurry seal sections; however, differences between thin overlays and chip seal or crack seal were not statistically significant.
The performance of maintenance treatments with respect to the initial pavement condition was evaluated to identify the importance of timing. Timing of treatment application impacted pavement performance. When the pavement was in poor condition, thin overlay performed better than slurry seal, crack seal, and the control section. Chip seal also outperformed crack seal, with a significant statistical difference under such conditions. It is important to note that the comparisons were based on fatigue cracking surveys. In this case, chip seals in general may only mask the cracks and mislead survey measurements rather than actually correct the distress to improve performance.
Generally, thin overlays performed better for rutting when compared to other treatment alternatives and the control section. Temperature was one of the factors that affected performance when comparing chip seal and slurry seal sections. In freezing zones, chip seal outperformed slurry seal. In addition to temperature, only precipitation was statistically influential in rutting when comparing chip seals with thin overlays and slurry seals. Under wet conditions, thin overlays outperformed chip seal, and under dry conditions, chip seal performed better than slurry seal.
Under higher traffic levels, thin overlays performed better than the control section; however, in low traffic, the differences were not statistically significant. Surprisingly, slurry seal performed worse than the control section under low traffic level conditions with respect to rutting. No other design factor affected the performance of the pavement sections in a statistically significant way with respect to rutting.
Temperature condition was an important factor in defining maintenance activities concerning surface smoothness. Thin overlays performed significantly better than slurry seals, crack seals, and chip seals in freezing zones. In no-freeze zones, there were no significant differences among treatments and the control section with respect to IRI. Precipitation did not affect performance among the flexible pavement treatments evaluated. There was no significant difference among treatments under dry and wet conditions.
In pavements with coarse subgrade, thin overlay was superior to chip seal. In pavements with fine subgrade, thin overlays outperformed the control section only. The comparison of the treatments did not show significant differences in any other combination.
Traffic also affected the performance of maintenance treatments when roughness was considered. Thin overlays outperformed crack seals, chip seals, and the control section in roads under higher traffic levels. In low traffic roads, there were no significant differences among the treatments or the control section.
Pavement initial condition affected the performance of the treatments. Thin overlays performed better than crack seals, chip seals, and the control section if the condition of the pavement was poor. There was no significance difference identified when the pavement condition was good.
Table 28 summarizes the results of the statistical analysis for each distress type evaluated. All four treatments were considered. When pavement performance for the treatment was statistically significant compared to the control section, the treatment code was depicted in the cell. If no statistical significance was identified between the treatments and the control section, the cell was left empty. In some cases, two treatments significantly outperformed others, shown as "2d choice" in the table. For example, in freeze zones and with respect to fatigue cracking, chip seal is presented as the first choice and thin overlay is shown as the second choice.
Table 28. Preferred flexible pavement treatments.
Distress |
Preferred Treatment |
Temperature |
Precipitation |
Subgrade |
Traffic |
Pavement Condition |
||||||
|---|---|---|---|---|---|---|---|---|---|---|---|---|
Freeze |
No-freeze |
Dry |
Wet |
Fine |
Coarse |
Low |
High |
Good |
Fair |
Poor |
||
Fatigue Cracking |
1st choice |
CH |
CH |
CH |
CH |
CH |
CH |
CH |
CH |
CH |
CH |
TH |
2d choice |
TH |
- |
- |
TH |
- |
TH |
- |
TH |
- |
- |
CH |
|
Rutting |
1st choice |
TH |
TH |
TH |
TH |
TH |
TH |
TH |
TH |
TH |
TH |
TH |
2d choice |
CH |
- |
CH |
- |
- |
- |
- |
- |
- |
- |
- |
|
Roughness |
1st choice |
TH |
None |
None |
None |
TH |
TH |
None |
TH |
None |
None |
TH |
CH = chip seal and TH = thin
overlay.
- Indicates that no data are available.
Note: None means that neither treatment alternative performed significantly
better than the control section. CH is not included as an option for roughness
because it was never the preferred treatment method.
The effectiveness of the treatments in prolonging the pavement life of rigid pavements was evaluated using three types of distresses and the ride quality measurements available for the SPS-4 experiment. Edge faulting, wheel-path faulting, longitudinal cracking, and roughness measurements were chosen as the basis for the performance assessments. Figure 6 through figure 9 illustrate box-whisker plots of WD for these performance indicators.
As shown in figure 6 and figure 7, the experiment showed similar trends for both edge faulting and wheel-path faulting. Joint/crack sealing performed better by showing lower averages and minimum/maximum ranges as compared to the undersealing treatment and the control section. Undersealing treatments resulted in the highest WDs and greater performance variability with respect to edge faulting and wheel-path faulting.
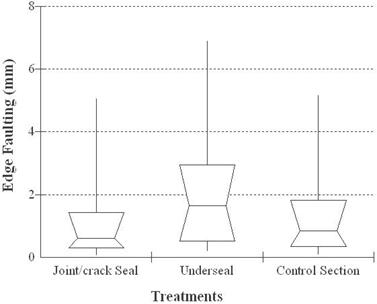
1 inch = 25.4 mm
Figure 6. Graph. Box-whisker plot for WD-edge faulting of SPS-4 sections.
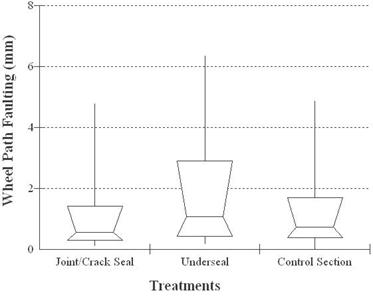
1 inch = 25.4 mm
Figure 7. Graph. Box-whisker plot for WD-wheel-path faulting of SPS-4 sections.
With respect to limiting the propagation of linear cracking, undersealing treatment performed better than the joint/crack sealing and the control section (see figure 8). Joint/crack seal was also better than the control section. Both treatments showed smaller variability as compared to the control section.
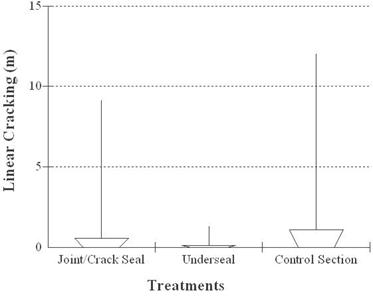
1 ft = 0.305 m
Figure 8. Graph. Box-whisker plot for WD-linear cracking of SPS-4 sections.
The performance of sections treated by joint/crack sealing was close to that for the control section with respect to IRI (see figure 9). However, the control sections presented lower variability in roughness performance. Sections that were undersealed performed worse than the sealed and control sections.
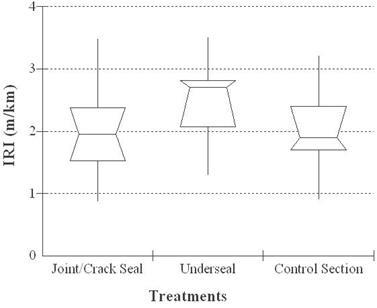
1 ft = 0.305 m
1 mi = 1.61 km
Figure 9. Graph. Box-whisker plot for WD-IRI of SPS-4 sections.
Although the box charts showed indications that joint/crack sealing may be a more effective treatment, the differences were not significant when running the consolidated analysis using the Friedman test. The analysis also was extended to evaluate the impact of specific site conditions. The SPS-4 test sites were grouped according to precipitation, temperature, structure, base material, and subgrade type. Only 10 sites contained measurements from sections treated by undersealing as compared to 34 sites for joint/crack sealed and control sections. As such, the Friedman test was performed in two stages. In the first stage, only the 10 sites with reported measurements for all 3 sections were considered. In the second stage, the undersealing treatment was excluded from the analysis. As a result, the existence of statistical differences between the crack/joint sealing and control sections was investigated using the data from 34 sites.
The results from both analyses showed no statistically significant differences in performance between the treatments and the control section, indicating that benefits from joint/crack sealing and undersealing may be relatively small; however, the sample size for sections with undersealing was small, which may affect the meaningfulness of the results.
Timing of treatment application is an important factor in achieving the best treatment performance. Optimum timing of treatment application can maximize treatment benefits through improved pavement performance while minimizing the overall costs of maintaining the pavement. Performance of preventive maintenance treatments depends on the condition of the pavement at the time of treatment. Different types of treatments are likely to be most effective when applied at certain times in pavement life, providing a cost-effective solution to prolonging pavement life.
The LTPP database was used to obtain information on treatment dates, pretreatment pavement conditions, and post-treatment pavement condition changes over time. The analysis in this section of the report provides an indication for appropriate timing of different maintenance alternatives.
The effects of initial pavement conditions on pavement performance for different treatment alternatives were evaluated by comparing the performances of two groups of pavements: sites with a WD lower than the median distress and sites with a WD higher than the median distress. The performance of the treated sections was evaluated in each group using the Friedman test to investigate the existence of statistically significant differences.
IRI
Figure 10 presents the average rankings of the sites for different treatments. The figure illustrates the average ranking for all sites, including sites initially in poor condition and those initially in fair conditions. As explained earlier, a lower number for ranks indicates better performance. As such, thin overlay had better performance when all sites were included and when the sites were initially in poor conditions. However, the performance of the control section was statistically similar to all treatments with respect to IRI when the sites were initially in better conditions.
Figure 10. Graph. Average rank of SPS-3 sites with respect to IRI.
Table 29 presents the Friedman test results based on application timing. As shown in the table, the median roughness of the SPS-3 sites was 7.34 ft/mi (1.39 m/km). When considering all the sites collectively for the analysis, thin overlay significantly outperformed the control section, crack seal, and chip seal sections. However, when the analysis was run for those sites with IRIs higher than 7.34 ft/mi (1.39 m/km) (higher levels of roughness), the thin overlay treatment significantly outperformed other treatment types and the control section. No statistically significant differences were observed in the performance of treatments when the existing pavement sections had IRI levels lower than 7.34 ft/mi (1.39 m/km). It was concluded that treatments had little effect on the IRI performance if the pavement had a low initial IRI. Conversely, for sections with higher IRIs prior to the treatment, only thin overlays provided significant improvements to IRI performance over the service life of pavements.
Table 29. Friedman test results for SPS-3 sites with respect to IRI.
All Initial Conditions |
IRIinitial  > 1.39 m/km |
IRIinitial  < 1.39 m/km |
|---|---|---|
Thin overlay outperformed the control section |
Thin overlay outperformed the control section |
- |
- |
Thin overlay outperformed slurry seal |
- |
Thin overlay outperformed crack seal |
Thin overlay outperformed crack seal |
- |
Thin overlay outperformed chip seal |
Thin overlay outperformed chip seal |
- |
1 ft = 0.305 m
1 mi = 1.61 km
- Indicates that the Friedman test was not significant for the specific
condition.
Rutting
Figure 11 presents the average performance rankings of treatment types related to rutting. The sites were separated in two groups using the median (0.25 inches (6.4 mm)) for initial rutting of all sites. Using the median helped maximize the power of the comparisons using two groups with the same sample size. Thin overlay had better performance whether the sites were in fair or poor conditions. For both groups (low and high levels of initial rutting), the performance of the sites that were treated by crack sealing and slurry sealing was not any better than the control section that received no treatment. However, the average ranking remained consistent with respect to the application timing. There was not a significant difference in performance of the sites with thin overlays with either low or high levels of initial rutting. This was also true for other treatments.
Figure 11. Graph. Average rank of SPS-3 sites with respect to rutting.
Table 30 presents the Friedman test results based on application timing for rutting. Thin overlay significantly outperformed slurry seal, crack seal, and chip seal for both levels of rutting. Surprisingly, when the pavements had initial rutting lower than 0.25 inches (6.4 mm), the differences in rankings between the control section and the thin overlay were not statistically significant. Also, chip seal was significantly better than the slurry seal when the sites had initial rutting lower than 0.25 inches (6.4 mm); however, the differences were not identified when the pavement sections had higher levels of rutting prior to the treatments.
Table 30. Friedman test results of SPS-3 sites with respect to rutting.
Any Initial Condition |
Ruttinginitial  > 0.25 inches |
Ruttinginitial < 0.25 inches |
|---|---|---|
Thin overlay outperformed the control section |
Thin overlay outperformed the control section |
- |
Control section outperformed slurry seal |
- |
Control section outperformed slurry seal |
Thin overlay outperformed slurry seal |
Thin overlay outperformed slurry seal |
Thin overlay outperformed slurry seal |
Thin overlay outperformed crack seal |
Thin overlay outperformed crack seal |
Thin overlay outperformed crack seal |
Thin overlay outperformed chip seal |
Thin overlay outperformed chip seal |
Thin overlay outperformed chip seal |
Chip seal outperformed slurry seal |
- |
Chip seal outperformed slurry seal |
1 inch = 25.4 mm
- Indicates that the Friedman test was not significant for the specific
condition.
Cracking
Figure 12 presents the average performance rankings of sections with different maintenance treatments and varying levels of fatigue cracking prior to receiving those treatments. Similar to the previous analyses, the sites were grouped according to the median level of cracking prior to treatment for all sites. Chip seal had better cracking performance whether the sections had initial lower or higher levels of cracking. The cracking performance of sections that were treated with crack sealing, slurry sealing, and thin overlay was poorer than the control section when the sites had a level of cracking lower than 21.96 ft2 (2.04 m2). All treatments performed relatively better than the control section when the pavement had cracking higher than 21.96 ft2 (2.04 m2).
Figure 12. Graph. Average rank of SPS-3 sites with respect to cracking based on application timing.
Table 31 presents the Friedman test results based on application timing for cracking. The median level of existing cracking prior to the application of maintenance treatments for all of the sites in initial condition was 21.96 ft2 (2.04 m2). Thin overlay and chip seal significantly outperformed slurry seal, crack seal, and the control section when the existing pavement had more than 21.96 ft2 (2.04 m2) of cracking. Chip seal outperformed slurry seal and crack seal for pavements that had an initial level of cracking lower than 21.96 ft2 (2.04 m2). Under this condition, the control section performed better than slurry seal.
Table 31. Friedman test results for SPS-3 sites with respect to cracking based on application timing.
Any Initial Condition |
Crackinginitial  > 21.96 ft2 |
Crackinginitial  < 21.96 ft2 |
|---|---|---|
Thin overlay outperformed the control section |
Thin overlay outperformed the control section |
- |
Chip seal outperformed the control section |
Chip seal outperformed the control section |
- |
Thin overlay outperformed slurry seal |
Thin overlay outperformed slurry seal |
- |
Thin overlay outperformed crack seal |
Thin overlay outperformed crack seal |
- |
Chip seal outperformed slurry seal |
Chip seal outperformed slurry seal |
Chip seal outperformed slurry seal |
Chip seal outperformed crack seal |
Chip seal outperformed crack seal |
Chip seal outperformed crack seal |
- |
- |
Control section outperformed slurry seal |
1 ft2 = 0.093 m2
- Indicates that the Friedman test was not significant for the specific
condition.
Rigid Pavement Maintenance Application Timing
The same analysis was conducted for rigid pavement sites in the SPS-4 experiment. The number of sites with undersealing treatments and reported distress measurements were limited to 10 or less. As a result, this treatment was excluded from further analysis to achieve meaningful conclusions due to the small sample size.
A Friedman test was applied to joint/crack sealed sections and the control sections to investigate significant differences in performance with respect to the application timing. Roughness, edge faulting, wheel-path faulting, and longitudinal cracking distress measurements were considered. No statistically significant differences were identified between the joint/crack sealing and control sections for any of the measured distresses under fair or poor initial pavement conditions.
Based on the analysis of SPS-3 sites, the following conclusions were made:
The study of SPS-4 sites showed that the performance of the joint/crack sealed sections and undersealed sections was not significantly different than that of the control sections. No meaningful difference between the two treatments was found. The strength of the analysis was weakened by the number of sites that included recorded surveys with undersealing treatments. While there were 34 sites included in the survey measurements for joint/crack sealed sections, only 10 sites had recorded data for undersealed sections.

