U.S. Department of Transportation
Federal Highway Administration
1200 New Jersey Avenue, SE
Washington, DC 20590
202-366-4000


Skip to content
Facebook iconYouTube iconTwitter iconFlickr iconLinkedInInstagram

Federal Highway Administration Research and Technology
Coordinating, Developing, and Delivering Highway Transportation Innovations

 
REPORT
This report is an archived publication and may contain dated technical, contact, and link information
Back to Publication List        
Publication Number:  FHWA-HRT-12-023    Date:  December 2012
Publication Number: FHWA-HRT-12-023
Date: December 2012


Simplified Techniques for Evaluation and Interpretation of Pavement Deflections for Network-Level Analysis

APPENDIX C

FLEXIBLE PAVEMENT STRUCTURAL ANALYSIS

Models Based on Rutting Performance for Flexible Pavements
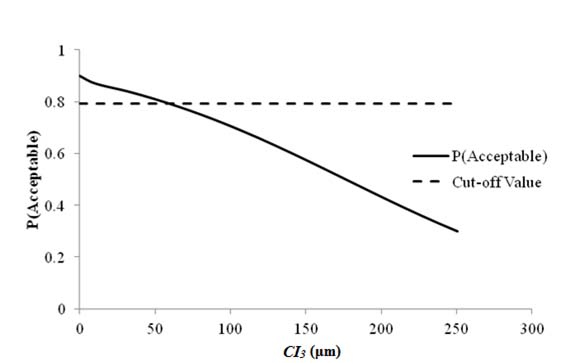
This graph shows a line plot of sensitivity of rutting acceptable probability to deflection parameter CI subscript 3 for flexible pavements. The x-axis represents CI subscript 3 from zero to 11.81 mil (zero to 300 microns), and the y-axis represents the acceptable probability from zero to 1. There are two data series on this plot: the cutoff value, shown as a dashed line, and the acceptable probability, shown as a solid line. The cutoff value is shown by a horizontal dashed line at a probability of 0.792. The solid line starts at a probability of 0.9 for CI subscript 3 equal to zero mil (zero microns). It intersects with the cutoff line at a CI subscript 3 value of around 2.57 mil (66 microns) and decreases almost linearly reaching a probability of 0.3 when CI subscript 3 is 9.75 mil (250 microns).
1 μm = 0.039 mil

Figure 67. Graph. Sensitivity of rutting acceptable probability to deflection parameter CI3 for flexible pavements.
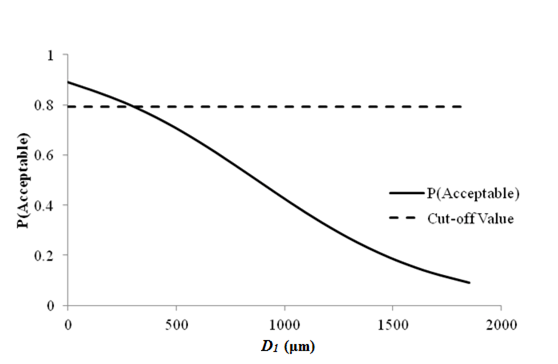
 

This graph shows a line plot of sensitivity of rutting acceptable probability to deflection parameter D subscript 1 for flexible pavements. The x-axis represents D subscript 1 values from zero to 78 mil (zero to 2,000 microns), and the y-axis represents the acceptable probability from zero to 1. There are two data series on this plot: the cutoff value, shown as a dashed line, and the acceptable probability, shown as a solid line. The cutoff value is shown by a horizontal dashed line at a probability of 0.792. The solid line starts at a probability of 0.89 for D subscript 1 value equal to zero mil (zero microns). It intersects with the cutoff line at a D subscript 1 value of about 14.04 mil (360 microns) and decreases almost linearly reaching a probability of about 0.09 when D subscript 1 is about 72.19 mil (1,851 microns).
1 μm = 0.039 mil

Figure 68. Graph. Sensitivity of rutting acceptable probability to deflection parameter D1 for flexible pavements.
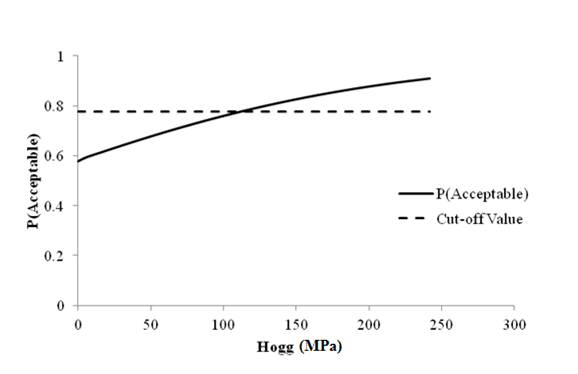
 

This graph shows a line plot of sensitivity of rutting acceptable probability to deflection parameter Hogg for flexible pavements. The x-axis represents Hogg from zero to 43,511.31 psi (zero to 300 MPa), and the y-axis represents the acceptable probability from zero to 1. There are two data series on this plot: the cutoff value, shown as a dashed line, and the acceptable probability, shown as a solid line. The cutoff value is shown by a horizontal dashed line at a probability of 0.777. The solid line starts at a probability of 0.58 with a Hogg value equal to zero psi (zero MPa). It intersects with the cutoff line at a Hogg value of 16,244.22 psi (112 MPa) and increases almost linearly, flattening out the closer it gets to a probability of 1.
1 MPa = 145.03377 psi

Figure 69. Graph. Sensitivity of rutting acceptable probability to deflection parameter Hogg for flexible pavements


Models Based on Fatigue Cracking Performance for Flexible Pavements
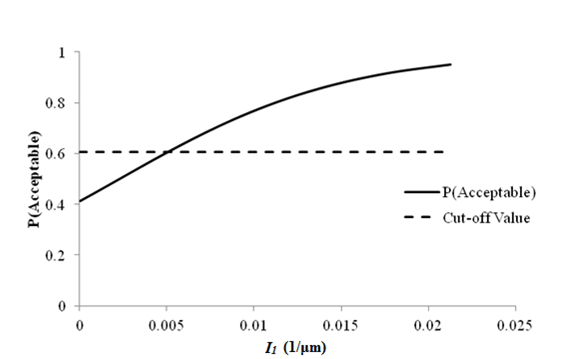
This graph shows a line plot of sensitivity of fatigue cracking acceptable probability to deflection parameter I subscript 1 for flexible pavements. The x-axis represents I subscript 1 from zero to 0.635 1/mil (zero to 0.025 1/microns), and the y-axis represents the acceptable probability from zero to 1. There are two data series on this plot: the cutoff value, shown as a dashed line, and the acceptable probability, shown as a solid line. The cutoff value is shown by a horizontal dashed line at a probability of 0.605. The solid line starts at a probability of 0.414 for an I subscript 1 value equal to zero 1/mil (zero 1/microns). It intersects with the cutoff line at an I subscript 1 value of 0.127 1/mil (0.005 1/microns) and increases until it flattens out as it gets closer to a probability of 1.
1 1/ μm =25.4 1/mil

Figure 70. Graph. Sensitivity of fatigue cracking acceptable probability to deflection parameter I1 for flexible pavements.
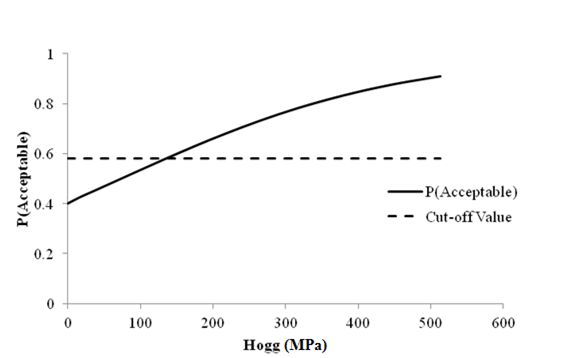
 

This graph shows a line plot of sensitivity of fatigue cracking acceptable probability to deflection parameter Hogg for flexible pavements. The x-axis represents Hogg values from zero to 87,022.2 psi (zero to 600 MPa), and the y-axis represents the acceptable probability from zero to 1. There are two data series on this plot: the cutoff value, shown as a dashed line, and the acceptable probability, shown as a solid line. The cutoff value is shown by a horizontal dashed line at a probability of 0.581. The solid line starts at a probability of 0.4 for Hogg value equal to zero psi (zero MPa). It intersects the cutoff line at a Hogg value around 19,435.05 psi (134 MPa) and increases until it flattens out as the probability increases.
1 MPa = 145.0377 psi

Figure 71. Graph. Sensitivity of fatigue cracking acceptable probability to deflection parameter Hogg for flexible pavements.


RIGID PAVEMENT STRUCTURAL ANALYSIS FOR 9,000-LB (4,086-KG) FWD LOAD

Models Based on Roughness Performance for Rigid Pavements (9,000 lb (4,086 kg))
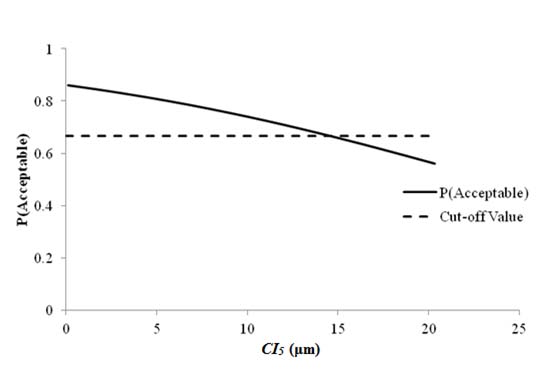
 

This graph shows a plot of sensitivity of roughness acceptable probability to deflection parameter CI subscript 5 for rigid pavements with 9,000-lb (4,086-kg) falling weight deflectometer load. The x-axis represents CI subscript 5 values from zero to 0.975 mil (zero to 25 microns), and the y-axis represents the acceptable probability from zero to 1. There are two data series on this plot: the cutoff value, shown as a dashed line, and the acceptable probability, shown as a solid line. The cutoff value is shown by a horizontal dashed line at a probability of 0.665. The solid line starts at a probability of 0.86 for a CI subscript 5 value equal to zero mil (zero microns). It intersects the cutoff line at a CI subscript 5 value of 0.57 mil (14.6 microns) and decreases almost linearly, reaching a probability of about 0.56 when CI subscript 5 is 0.78 mil (20 microns).
1 μm = 0.039 mil

Figure 72. Graph. Sensitivity of roughness acceptable probability to deflection parameter CIf5 for rigid pavements (9,000 lb (4,086 kg)).
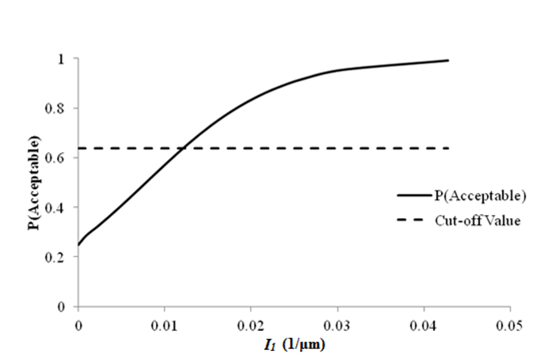
 

This graph shows a line plot of sensitivity of roughness acceptable probability to deflection parameter I subscript 1 for rigid pavements with a 9,000-lb (4,086-kg) falling weight deflectometer load. The x-axis represents I subscript 1 values from zero to 1.27 1/mil (zero to 0.05 1/microns), and the y-axis represents the acceptable probability from zero to 1. There are two data series on this plot: the cutoff value, shown as a dashed line, and the acceptable probability, shown as a solid line. The cutoff value is shown by a horizontal dashed line at a probability of 0.639. The solid line starts at a probability of around 0.25 for an I subscript 1 value equal to zero 1/mil (zero 1/microns). It intersects with the cutoff line at an I subscript 1 value of 0.330 1/mil (0.013 1/microns) and increases until it flattens out as it gets closer to a probability of 1.
1 1/μm = 25.4 1/mil

Figure 73. Graph. Sensitivity of roughness acceptable probability to deflection parameter I1 for rigid pavements (9,000 lb (4,086 kg)).
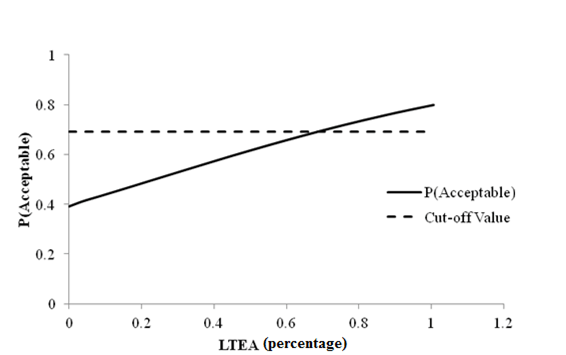
 

This graph shows a line plot of sensitivity of roughness acceptable probability to deflection parameter load transfer efficiency approach (LTEA) for rigid pavements with 9,000-lb (4,086-kg) falling weight deflectometer load. The x-axis represents LTEA values from zero to 1 percent, and the y-axis represents the acceptable probability from zero to 1. There are two data series on this plot: the cutoff value, shown as a dashed line, and the acceptable probability, shown as a solid line. The cutoff value is shown by a horizontal dashed line at a probability of 0.69. The solid line starts at a probability of 0.39 with an LTEA value equal to zero percent. It intersects with the cutoff line at an LTEA value of around 0.7 percent and increases almost linearly until it reaches a probability of about 0.78 with an LTEA value equal to 0.94 percent.
Figure 74. Graph. Sensitivity of roughness acceptable probability to deflection parameter LTEA for rigid pavements (9,000 lb (4,086 kg)).


Models Based on Faulting at Joints Performance for Rigid Pavements (9,000 lb (4,086 kg))
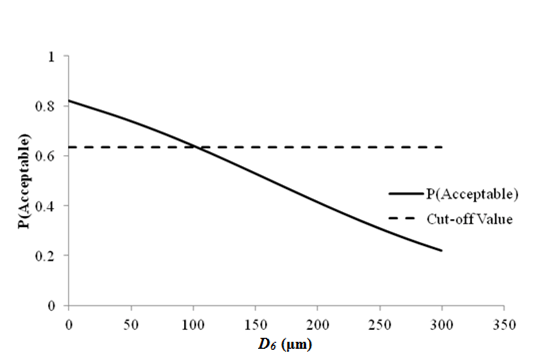
This graph shows a line plot of sensitivity of faulting at joints acceptable probability to deflection parameter D subscript 6 for rigid pavements with 9,000-lb (4,086-kg) falling weight deflectometer load. The x-axis represents D subscript 6 values from zero to 13.65 mil (zero to 350 microns), and the y-axis represents the acceptable probability from zero to 1. There are two data series on this plot: the cutoff value, shown as a dashed line, and the acceptable probability, shown as a solid line. The cutoff value is shown by a horizontal dashed line at a probability of 0.635. The solid line starts at a probability around 0.82 with a D subscript 6 value equal to zero mil (zero microns). It intersects with the cutoff line at a D subscript 6 value of around 3.9 mil (100 microns) and decreases almost linearly, reaching a probability of about 0.22 when D subscript 6 is about 11.7 mil (300 microns).
1 μm = 0.039 mil

Figure 75. Graph. Sensitivity of faulting at joints acceptable probability to deflection parameter D6 for rigid pavements (9,000 lb (4,086 kg)).
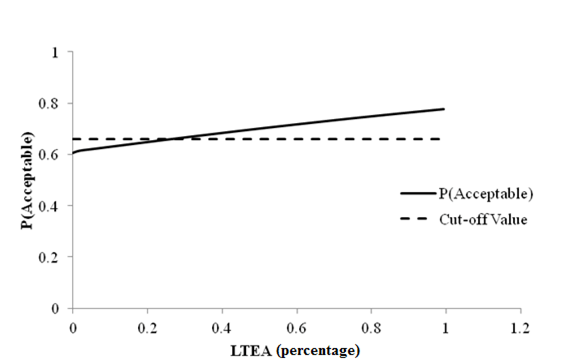
 

This graph shows a line plot of sensitivity of faulting at joints acceptable probability to deflection parameter load transfer efficiency approach (LTEA) for rigid pavements with a 9,000-lb (4,086-kg) falling weight deflectometer load. The x-axis represents LTEA values from zero to 1 percent, and the y-axis represents the acceptable probability from zero to 1. There are two data series on this plot: the cutoff value, shown as a dashed line, and the acceptable probability, shown as a solid line. The cutoff value is shown by a horizontal dashed line at a probability of 0.659. The solid line starts at a probability around 0.61 with an LTEA value equal to zero percent. It intersects with the cutoff line at an LTEA value of 0.25 percent and increases almost linearly until it reaches a probability of about 0.78 with an LTEA value equal to 1 percent.
Figure 76. Graph. Sensitivity of faulting at joints acceptable probability to deflection parameter LTEA for rigid pavements (9,000 lb (4,086 kg)).


Models Based on Transverse Cracking Performance for Rigid Pavements (9,000 lb (4,086 kg))
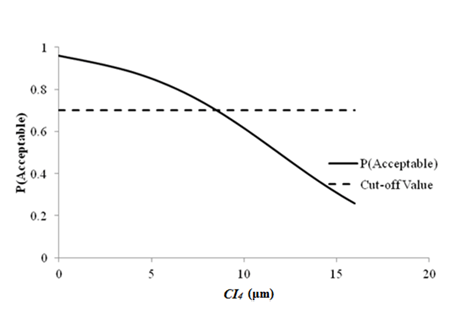
This graph shows a line plot of sensitivity of transverse cracking acceptable probability to deflection parameter CI subscript 4 for rigid pavements with a 9,000-lb (4,086-kg) falling weight deflectometer load. The x-axis represents CI subscript 4 from zero to 0.78 mil (zero to 20 microns), and the y-axis represents the acceptable probability from zero to 1. There are two data series on this plot: the cutoff value, shown as a dashed line, and the acceptable probability, shown as a solid line. The cutoff value is shown by a horizontal dashed line at a probability of 0.7. The solid line starts at a probability around 0.96 with a CI subscript 4 value equal to zero mil (zero microns). It intersects with the cutoff line at a CI subscript 4 value of about 0.312 mil (8 microns) and decreases to a probability of about 0.26 when CI subscript 4 is about 0.624 mil (16 microns).
1 μm = 0.039 mil

Figure 77. Graph. Sensitivity of transverse cracking acceptable probability to deflection parameter CI4 for rigid pavements (9,000 lb (4,086 kg)).
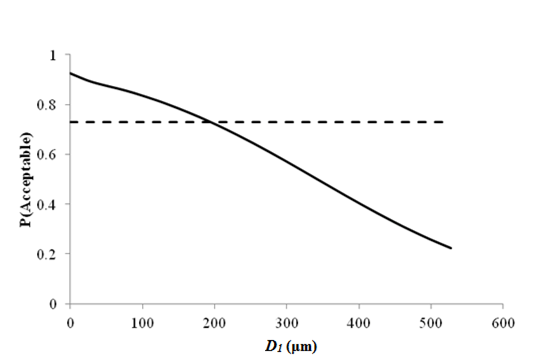
 

This graph shows a line plot of sensitivity of transverse cracking acceptable probability to deflection parameter D subscript 1 for rigid pavements with a 9,000-lb (4,086-kg) falling weight deflectometer load. The x-axis represents D subscript 1 from zero to 23.4 mil (zero to 600 microns), and the y-axis represents the acceptable probability from zero to 1. There are two data series on this plot: the cutoff value, shown as a dashed line, and the acceptable probability, shown as a solid line. The cutoff value is shown by a horizontal dashed line at a probability of 0.728. The solid line starts at a probability around 0.925 with a D subscript 1 value equal to zero mil (zero microns). It intersects with the cutoff line at a D subscript 1 value of about 8.03 mil (206 microns) and decreases almost linearly, reaching a probability of about 0.225 when D subscript 1 is about 20.59 mil (528 microns).
1 μm = 0.039 mil

Figure 78. Graph. Sensitivity of transverse cracking acceptable probability to deflection parameter D1 for rigid pavements (9,000 lb (4,086 kg)).
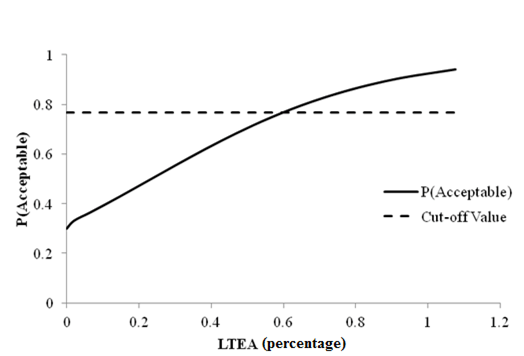
 

This graph shows a line plot of sensitivity of transverse cracking acceptable probability to deflection parameter load transfer efficiency approach (LTEA) for rigid pavements with 9,000-lb (4,086-kg) falling weight deflectometer load. The x-axis represents LTEA values from zero to 1.2 percent, and the y-axis represents the acceptable probability from zero to 1. There are two data series on this plot: the cutoff value, shown as a dashed line, and the acceptable probability, shown as a solid line. The cutoff value is shown by a horizontal dashed line at a probability of 0.766. The solid line starts at a probability around 0.3 with an LTEA value equal to zero percent. It intersects with the cutoff line at an LTEA value of about 0.6 percent and then starts flattening out as it gets closer to a probability of 1.

Figure 79. Graph. Sensitivity of transverse cracking acceptable probability to deflection parameter LTEA for rigid pavements (9,000 lb (4,086 kg)).


RIGID PAVEMENT STRUCTURAL ANALYSIS FOR 12,000-LB (5,488-KG) FWD LOAD

Models Based on Roughness Performance for Rigid Pavements (12,000 lb (5,445 kg))
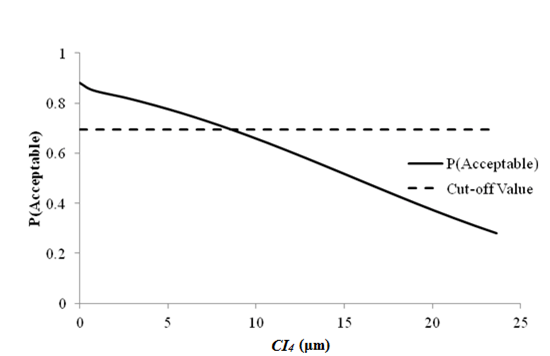
This graph shows a line plot of sensitivity of roughness acceptable probability to deflection parameter CI subscript 4 for rigid pavements with a 12,000-lb (5,445-kg) falling weight deflectometer load. The x-axis represents CI subscript 4 values from zero to 0.975 mil (zero to 25 microns), and the y-axis represents the acceptable probability from zero to 1. There are two data series on this plot: the cutoff value, shown as a dashed line, and the acceptable probability, shown as a solid line. The cutoff value is shown by a horizontal dashed line at a probability of 0.695. The solid line starts at a probability of 0.88 with a CI subscript 4 value equal to zero mil (zero microns). It intersects with the cutoff line at a CI
1 μm = 0.039 mil

Figure 80. Graph. Sensitivity of roughness acceptable probability to deflection parameter CI4 for rigid pavements (12,000 lb (5,445 kg)).
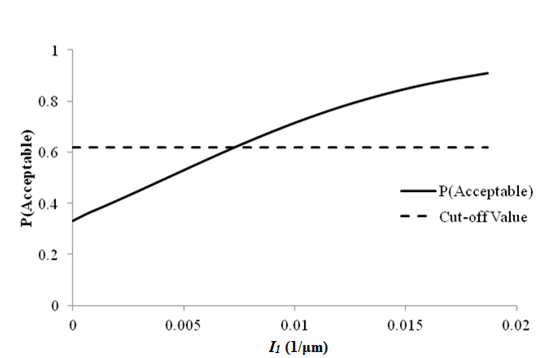
 

This graph shows a line plot of sensitivity of roughness acceptable probability to deflection parameter I subscript 1 for rigid pavements with a 12,000-lb (5,445-kg) falling weight deflectometer load. The x-axis represents I subscript 1 values from zero to 0.508 1/mil (zero to 0.02 1/microns), and the y-axis represents the acceptable probability from zero to 1. There are two data series on this plot: the cutoff value, shown as a dashed line, and the acceptable probability, shown as a solid line. The cutoff value is shown by a horizontal dashed line at a probability of 0.62. The solid line starts at a probability around 0.33 with an I subscript 1 value equal to zero 1/mil (zero 1/microns). It intersects with the cutoff line at an I subscript 1 value of 0.178 1/mil (0.007 1/microns) and increases until it flattens out as it gets closer to a probability of 1.
1 1/μm = 25.4 1/mil

Figure 81. Graph. Sensitivity of roughness acceptable probability to deflection parameter I1 for rigid pavements (12,000 lb (5,445 kg)).
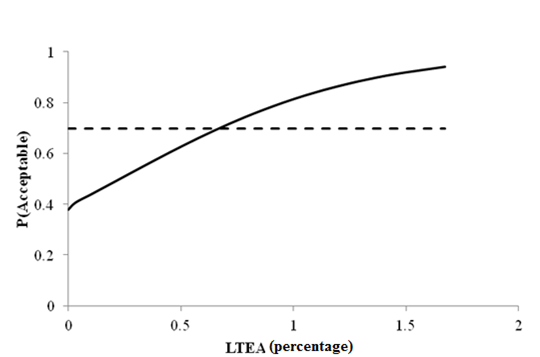
 

This graph shows a line plot of sensitivity of roughness acceptable probability to deflection parameter load transfer efficiency approach (LTEA) for rigid pavements with a 12,000-lb (5,445-kg) falling weight deflectometer load. The x-axis represents LTEA values from zero to 2 percent, and the y-axis represents the acceptable probability from zero to 1. There are two data series on this plot: the cutoff value, shown as a dashed line, and the acceptable probability, shown as a solid line. The cutoff value is shown by a horizontal dashed line at a probability of 0.697. The solid line starts at a probability of 0.38 with an LTEA value equal to zero percent. It intersects with the cutoff line at an LTEA value of about 0.64 percent and increases almost linearly until an LTEA value of 1 percent, which corresponds to a probability of 0.8.
Figure 82. Graph. Sensitivity of roughness acceptable probability to deflection parameter LTEA for rigid pavements (12,000 lb (5,445 kg)).


Models Based on Faulting at Joints Performance for Rigid Pavements (12,000 lb (5,445 kg))
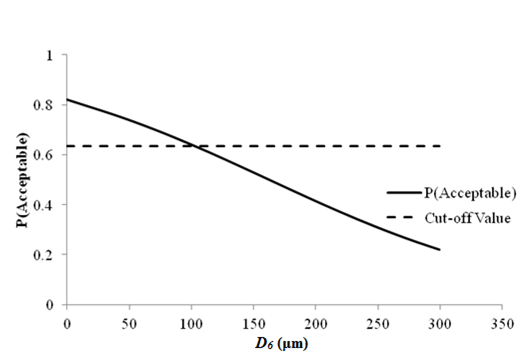
This graph shows a line plot of sensitivity of faulting at joints acceptable probability to deflection parameter D subscript 6 for rigid pavements with a 12,000-lb (5,445-kg) falling weight deflectometer load. The x-axis represents D subscript 6 values from zero to 13.65 mil (zero to 350 microns), and the y-axis represents the acceptable probability from zero to 1. There are two data series on this plot: the cutoff value, shown as a dashed line, and the acceptable probability, shown as a solid line. The cutoff value is shown by a horizontal dashed line at a probability of 0.651. The solid line starts at a probability around 0.85 with a D subscript 6 value equal to zero mil (zero microns). It intersects with the cutoff line at a D subscript 6 value of about 5.15 mil (132 microns) and decreases almost linearly, reaching a probability of about 0.25 when D subscript 6 is about 12.56 mil (322 microns).
1 μm = 0.039 mil

Figure 83. Graph. Sensitivity of faulting at joints acceptable probability to deflection parameter D6 for rigid pavements (12,000 lb (5,445 kg)).
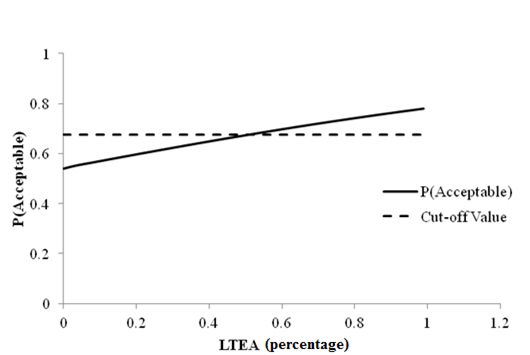
 

This graph shows a line plot of sensitivity of faulting at joints acceptable probability to deflection parameter load transfer efficiency approach (LTEA) for rigid pavements with a 12,000-lb (5,445-kg) falling weight deflectometer load. The x-axis represents LTEA values from zero to 1.2 percent, and the y-axis represents the acceptable probability from zero to 1. There are two data series on this plot: the cutoff value, shown as a dashed line, and the acceptable probability, shown as a solid line. The cutoff value is shown by a horizontal dashed line at a probability of 0.677. The solid line starts at probability around 0.54 with an LTEA value equal to zero percent. It intersects with the cutoff line with an LTEA value of about 0.5 percent and increases almost linearly until an LTEA value of 1 percent, which corresponds to a probability of 0.78.

Figure 84. Graph. Sensitivity of faulting at joints acceptable probability to deflection parameter LTEA for rigid pavements (12,000 lb (5,445 kg)).


Models Based on Transverse Cracking Performance for Rigid Pavements(12,000 lb (5,445 kg))
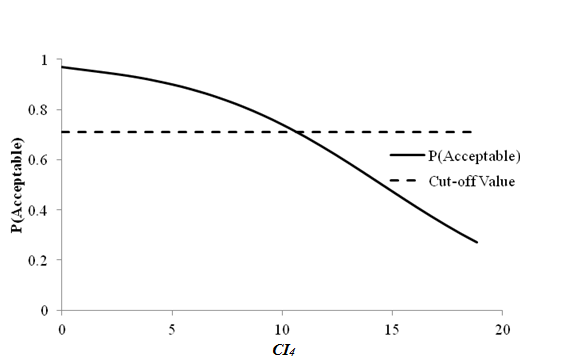
This graph shows a line plot of sensitivity of transverse cracking acceptable probability to deflection parameter CI subscript 4 for rigid pavements with a 12,000-lb (5,445-kg) falling weight deflectometer load. The x-axis represents CI subscript 4 values from zero to 0.78 mil (zero to 20 microns), and the y-axis represents the acceptable probability from zero to 1. There are two data series on this plot: the cutoff value, shown as a dashed line, and the acceptable probability, shown as a solid line. The cutoff value is shown by a horizontal dashed line at a probability of 0.71. The solid line starts at a probability of 0.97 for a CI subscript 4 value equal to zero mil (zero microns). It intersects with the cutoff line for a CI subscript 4 value around 0.429 mil (11 microns) and decreases almost linearly, reaching a probability of about 0.27 when CI subscript 4 is about 0.733 mil (18.8 microns).
1 μm = 0.039 mil

Figure 85. Graph. Sensitivity of transverse cracking acceptable probability to deflection parameter CI4 for rigid pavements (12,000 lb (5,445 kg)).
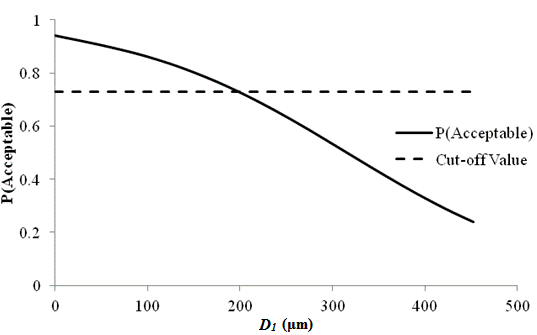
 

This graph shows a line plot of sensitivity of transverse cracking acceptable probability to deflection parameter D subscript 1 for rigid pavements with a 12,000-lb (5,445-kg) falling weight deflectometer load. The x-axis represents D subscript 1 values from zero to 19.5 mil (zero to 500 microns), and the y-axis represents the acceptable probability from zero to 1. There are two data series on this plot: the cutoff value, shown as a dashed line, and the acceptable probability, shown as a solid line. The cutoff value is shown by a horizontal dashed line at a probability of 0.73. The solid line starts at a probability of 0.94 with a D subscript 1 value equal to zero mil (zero microns). It intersects with the cutoff line with a D subscript 1 value around 7.72 mil (198 microns) and decreases to a probability of about 0.24 when D subscript 1 is about 17.63 mil (452 microns).
1 μm = 0.039 mil

Figure 86. Graph. Sensitivity of transverse cracking acceptable probability to deflection parameter D1 for rigid pavements (12,000 lb (5,445 kg)).
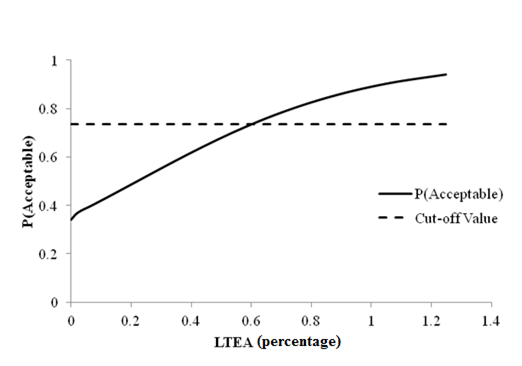
 

This graph shows a line plot of sensitivity of transverse cracking acceptable probability to deflection parameter load transfer efficiency approach (LTEA) for rigid pavements with a 12,000-lb (5,445-kg) falling weight deflectometer load. The x-axis represents LTEA values from zero to 1.2 percent, and the y-axis represents the acceptable probability from zero to 1. There are two data series on this plot: the cutoff value, shown as a dashed line, and the acceptable probability, shown as a solid line. The cutoff value is shown by a horizontal dashed line at a probability of 0.736. The solid line starts at a probability of 0.34 with an LTEA value equal to zero percent. It intersects with the cutoff line at an LTEA value of about 0.6 percent and starts flattening out as it reaches a probability of 1.

Figure 87. Graph. Sensitivity of transverse cracking acceptable probability to deflection parameter LTEA for rigid pavements (12,000 lb (5,445 kg)).


Federal Highway Administration | 1200 New Jersey Avenue, SE | Washington, DC 20590 | 202-366-4000
Turner-Fairbank Highway Research Center | 6300 Georgetown Pike | McLean, VA | 22101