U.S. Department of Transportation
Federal Highway Administration
1200 New Jersey Avenue, SE
Washington, DC 20590
202-366-4000
Federal Highway Administration Research and Technology
Coordinating, Developing, and Delivering Highway Transportation Innovations
| REPORT |
| This report is an archived publication and may contain dated technical, contact, and link information |
|
| Publication Number: FHWA-HRT-12-023 Date: December 2012 |
Publication Number: FHWA-HRT-12-023 Date: December 2012 |
Table 106. Information about the different States used in the analysis.
State |
Section ID |
AC Thickness (inches) |
Mean Deflection (mils) |
Standard Deviation |
Length (mi) |
Test Spacing (mi) |
|---|---|---|---|---|---|---|
New Mexico |
US70 EB |
6 |
7.54 |
1.89 |
2.3 |
0.1 |
6.8 |
7.06 |
2.17 |
37.6 |
0.1 |
||
7 |
6.3 |
2.117 |
19.8 |
0.1 |
||
US70 WB |
5.5 |
8.26 |
1.952 |
3.1 |
0.1 |
|
9.2 |
9.72 |
2.435 |
16.5 |
0.1 |
||
5 |
7.36 |
2.214 |
37.7 |
0.1 |
||
5.5 |
7.08 |
2.811 |
4.3 |
0.1 |
||
5.5 |
7.22 |
2.289 |
15.3 |
0.1 |
||
US550 NB |
9.71 |
7.87 |
1.268 |
6.8 |
0.1 |
|
9.94 |
7.64 |
3.449 |
15.8 |
0.1 |
||
9.43 |
5.5 |
1.835 |
10.3 |
0.1 |
||
9.95 |
4.68 |
1.047 |
6.3 |
0.1 |
||
9.15 |
7.2 |
2.657 |
21.4 |
0.1 |
||
9.46 |
11.34 |
4.379 |
14 |
0.1 |
||
9.35 |
4.33 |
1.381 |
9.7 |
0.1 |
||
9.77 |
4.49 |
1.294 |
16.1 |
0.1 |
||
9.49 |
5.75 |
0.76 |
16.4 |
0.1 |
||
US550 SB |
13.4 |
10.7 |
3.775 |
19.8 |
0.1 |
|
9.6 |
7.2 |
2.748 |
8.5 |
0.1 |
||
9.61 |
7 |
3.566 |
29.3 |
0.1 |
||
9.4 |
10.9 |
5.232 |
5.6 |
0.1 |
||
9.6 |
5.8 |
3.347 |
37.7 |
0.1 |
||
9.7 |
5.7 |
0.857 |
15.7 |
0.1 |
||
Oregon |
I-5 |
|
7.151 |
2.421 |
0.9 |
0.1 |
OR38 |
|
10.442 |
3.728 |
8.65 |
0.1 |
|
US101 |
|
13.794 |
4.466 |
3.35 |
0.1 |
|
|
16.869 |
6.663 |
8.65 |
0.1 |
||
OR18 |
|
7.386 |
2.713 |
37 |
0.1 |
|
OR221 |
|
22.482 |
6.691 |
16.7 |
0.1 |
|
OR99E |
|
6.948 |
2.272 |
2.2 |
0.1 |
|
|
7.192 |
2.553 |
2.2 |
0.1 |
||
|
9.402 |
4.075 |
9.85 |
0.1 |
||
US26 |
|
6.675 |
1.88 |
1.5 |
0.1 |
|
|
4.308 |
2.263 |
1.6 |
0.1 |
||
|
8.907 |
3.391 |
4.95 |
0.1 |
||
|
9.376 |
2.272 |
5.35 |
0.1 |
||
US97 |
|
8.9 |
2.945 |
4.25 |
0.1 |
|
Kansas |
4 |
8 |
13.87 |
4.114 |
6.3 |
0.1 |
8 |
14.06 |
3.837 |
5.2 |
0.1 |
||
8.7 |
10.6 |
2.336 |
3.9 |
0.1 |
||
7.3 |
12.93 |
3.305 |
2.9 |
0.1 |
||
5.7 |
11.14 |
3.447 |
2.1 |
0.1 |
||
56 |
13 |
8.37 |
3.212 |
5.9 |
0.1 |
|
14.5 |
5.17 |
1.254 |
8.4 |
0.1 |
||
11.5 |
9.76 |
2.591 |
12.9 |
0.1 |
||
99 |
10.2 |
11.85 |
2.539 |
8.1 |
0.1 |
|
7.7 |
15.26 |
4.628 |
5.1 |
0.1 |
||
7.1 |
14.42 |
3.886 |
2.8 |
0.1 |
||
7 |
16.98 |
3.669 |
7.3 |
0.1 |
||
7.8 |
15.86 |
3.523 |
7.6 |
0.1 |
||
9.2 |
10.88 |
3.387 |
2.3 |
0.1 |
||
170 |
13.1 |
6.24 |
2.879 |
1.9 |
0.1 |
|
7.1 |
15.2 |
4.851 |
10.5 |
0.1 |
||
8.2 |
15.9 |
3.338 |
7.2 |
0.1 |
||
56 |
9 |
9.06 |
2.257 |
5.7 |
0.1 |
|
31 |
6.4 |
13.97 |
3.135 |
9.7 |
0.1 |
|
7.7 |
14.91 |
5.287 |
4.3 |
0.1 |
||
56 |
7.5 |
11.43 |
3.539 |
3.7 |
0.1 |
|
8.8 |
8.26 |
2.3 |
8.8 |
0.1 |
||
59 |
7.4 |
9.66 |
3.702 |
7.3 |
0.1 |
|
12 |
5.32 |
1.642 |
6.2 |
0.1 |
||
12.1 |
9.28 |
4.273 |
2.9 |
0.1 |
||
12.9 |
7 |
2.59 |
3.9 |
0.1 |
||
13.8 |
5.36 |
2.473 |
7.9 |
0.1 |
||
10.5 |
6.54 |
1.886 |
6.1 |
0.1 |
||
39 |
4.9 |
16.78 |
4.818 |
6.7 |
0.1 |
|
5 |
18.2 |
3.728 |
1.8 |
0.1 |
||
6.3 |
14.97 |
7.157 |
4.7 |
0.1 |
||
75 |
5 |
14.07 |
3.855 |
2.9 |
0.1 |
|
8.9 |
10.4 |
2.338 |
7.5 |
0.1 |
||
54 |
9.2 |
7.34 |
2.399 |
5.3 |
0.1 |
|
58 |
8 |
10.65 |
3.659 |
9.4 |
0.1 |
|
6.9 |
11.64 |
3.354 |
11.6 |
0.1 |
||
75 |
7.2 |
4.27 |
0.782 |
3.9 |
0.1 |
|
17.5 |
8.35 |
2.14 |
4.2 |
0.1 |
||
15.7 |
7.3 |
1.732 |
3.9 |
0.1 |
||
10.8 |
5.51 |
1.754 |
4.1 |
0.1 |
||
11.2 |
7.32 |
2.975 |
11.9 |
0.1 |
||
11.2 |
5.18 |
1.377 |
2.2 |
0.1 |
||
14.4 |
6.16 |
1.423 |
1.9 |
0.1 |
||
10.8 |
6.29 |
1.589 |
4.9 |
0.1 |
||
|
Note: Blank cells indicate that no thickness was available. |
||||||
Probability |
Length (mi) |
Spacing (mi) |
||||||||
|---|---|---|---|---|---|---|---|---|---|---|
0.2 |
0.3 |
0.4 |
0.5 |
0.6 |
0.7 |
0.8 |
0.9 |
1 |
||
50 percent |
1 |
8.98 |
11.77 |
14.27 |
16.57 |
18.72 |
20.75 |
22.69 |
24.55 |
26.34 |
2 |
6.39 |
8.34 |
10.06 |
11.64 |
13.12 |
14.51 |
15.84 |
17.11 |
18.33 |
|
3 |
5.24 |
6.81 |
8.20 |
9.47 |
10.66 |
11.77 |
12.84 |
13.85 |
14.83 |
|
4 |
4.55 |
5.90 |
7.09 |
8.18 |
9.20 |
10.15 |
11.06 |
11.92 |
12.76 |
|
5 |
4.08 |
5.28 |
6.34 |
7.30 |
8.20 |
9.05 |
9.85 |
10.61 |
11.35 |
|
6 |
3.73 |
4.82 |
5.78 |
6.66 |
7.47 |
8.23 |
8.96 |
9.65 |
10.32 |
|
7 |
3.46 |
4.46 |
5.35 |
6.15 |
6.90 |
7.60 |
8.27 |
8.91 |
9.52 |
|
8 |
3.24 |
4.17 |
5.00 |
5.75 |
6.44 |
7.10 |
7.72 |
8.31 |
8.88 |
|
9 |
3.05 |
3.93 |
4.71 |
5.41 |
6.07 |
6.68 |
7.26 |
7.81 |
8.35 |
|
10 |
2.90 |
3.73 |
4.46 |
5.13 |
5.75 |
6.33 |
6.87 |
7.40 |
7.90 |
|
70 percent |
1 |
11.11 |
14.30 |
17.12 |
19.70 |
22.10 |
24.36 |
26.50 |
28.56 |
30.53 |
2 |
7.91 |
10.12 |
12.07 |
13.85 |
15.50 |
17.04 |
18.51 |
19.91 |
21.26 |
|
3 |
6.48 |
8.27 |
9.84 |
11.27 |
12.59 |
13.83 |
15.00 |
16.12 |
17.20 |
|
4 |
5.63 |
7.17 |
8.51 |
9.73 |
10.86 |
11.92 |
12.93 |
13.88 |
14.80 |
|
5 |
5.04 |
6.41 |
7.61 |
8.69 |
9.69 |
10.63 |
11.52 |
12.36 |
13.17 |
|
6 |
4.61 |
5.85 |
6.94 |
7.92 |
8.83 |
9.67 |
10.48 |
11.24 |
11.97 |
|
7 |
4.28 |
5.42 |
6.42 |
7.32 |
8.15 |
8.94 |
9.67 |
10.37 |
11.05 |
|
8 |
4.00 |
5.07 |
6.00 |
6.84 |
7.62 |
8.34 |
9.03 |
9.68 |
10.30 |
|
9 |
3.78 |
4.78 |
5.65 |
6.44 |
7.17 |
7.85 |
8.49 |
9.10 |
9.69 |
|
10 |
3.59 |
4.54 |
5.36 |
6.11 |
6.79 |
7.43 |
8.04 |
8.62 |
9.17 |
|
80 percent |
1 |
12.39 |
15.83 |
18.85 |
21.59 |
24.14 |
26.54 |
28.81 |
30.99 |
33.07 |
2 |
8.82 |
11.21 |
13.29 |
15.18 |
16.93 |
18.57 |
20.13 |
21.61 |
23.03 |
|
3 |
7.23 |
9.16 |
10.83 |
12.35 |
13.76 |
15.07 |
16.32 |
17.50 |
18.63 |
|
4 |
6.28 |
7.93 |
9.37 |
10.67 |
11.87 |
13.00 |
14.06 |
15.07 |
16.03 |
|
5 |
5.63 |
7.10 |
8.37 |
9.53 |
10.59 |
11.58 |
12.52 |
13.42 |
14.27 |
|
6 |
5.15 |
6.48 |
7.64 |
8.68 |
9.65 |
10.55 |
11.40 |
12.20 |
12.97 |
|
7 |
4.77 |
6.00 |
7.07 |
8.03 |
8.91 |
9.74 |
10.52 |
11.26 |
11.97 |
|
8 |
4.47 |
5.61 |
6.61 |
7.50 |
8.32 |
9.09 |
9.82 |
10.51 |
11.16 |
|
9 |
4.22 |
5.29 |
6.22 |
7.06 |
7.84 |
8.56 |
9.24 |
9.88 |
10.50 |
|
10 |
4.00 |
5.02 |
5.90 |
6.70 |
7.42 |
8.10 |
8.75 |
9.36 |
9.94 |
|
|
1 mi = 1.61 km |
||||||||||
Probability |
Length (mi) |
Spacing (mi) |
||||||||
|---|---|---|---|---|---|---|---|---|---|---|
0.2 |
0.3 |
0.4 |
0.5 |
0.6 |
0.7 |
0.8 |
0.9 |
1 |
||
90 percent |
1 |
14.18 |
17.94 |
21.24 |
24.22 |
26.98 |
29.57 |
32.02 |
34.35 |
36.59 |
2 |
10.10 |
12.71 |
14.98 |
17.03 |
18.93 |
20.70 |
22.37 |
23.96 |
25.48 |
|
3 |
8.28 |
10.38 |
12.21 |
13.86 |
15.38 |
16.80 |
18.13 |
19.41 |
20.62 |
|
4 |
7.19 |
9.00 |
10.56 |
11.97 |
13.27 |
14.48 |
15.63 |
16.71 |
17.75 |
|
5 |
6.44 |
8.05 |
9.44 |
10.69 |
11.84 |
12.91 |
13.92 |
14.88 |
15.80 |
|
6 |
5.89 |
7.35 |
8.61 |
9.74 |
10.78 |
11.75 |
12.67 |
13.54 |
14.36 |
|
7 |
5.46 |
6.80 |
7.97 |
9.01 |
9.97 |
10.86 |
11.70 |
12.49 |
13.25 |
|
8 |
5.11 |
6.36 |
7.45 |
8.42 |
9.31 |
10.14 |
10.92 |
11.66 |
12.36 |
|
9 |
4.82 |
6.00 |
7.02 |
7.93 |
8.76 |
9.54 |
10.27 |
10.96 |
11.62 |
|
10 |
4.58 |
5.69 |
6.65 |
7.51 |
8.30 |
9.03 |
9.72 |
10.38 |
11.00 |
|
95 percent |
1 |
15.65 |
19.69 |
23.21 |
26.39 |
29.32 |
32.07 |
34.66 |
37.13 |
39.50 |
2 |
11.15 |
13.95 |
16.37 |
18.56 |
20.57 |
22.45 |
24.22 |
25.90 |
27.51 |
|
3 |
9.14 |
11.40 |
13.35 |
15.10 |
16.72 |
18.22 |
19.64 |
20.98 |
22.27 |
|
4 |
7.93 |
9.87 |
11.55 |
13.05 |
14.43 |
15.71 |
16.92 |
18.07 |
19.16 |
|
5 |
7.11 |
8.83 |
10.32 |
11.65 |
12.87 |
14.01 |
15.08 |
16.09 |
17.06 |
|
6 |
6.50 |
8.07 |
9.41 |
10.62 |
11.72 |
12.75 |
13.72 |
14.64 |
15.51 |
|
7 |
6.03 |
7.47 |
8.71 |
9.82 |
10.83 |
11.78 |
12.67 |
13.51 |
14.31 |
|
8 |
5.64 |
6.99 |
8.14 |
9.17 |
10.12 |
11.00 |
11.82 |
12.60 |
13.35 |
|
9 |
5.33 |
6.59 |
7.67 |
8.64 |
9.53 |
10.35 |
11.12 |
11.86 |
12.55 |
|
10 |
5.06 |
6.25 |
7.27 |
8.19 |
9.03 |
9.80 |
10.53 |
11.22 |
11.88 |
|
99.5 percent |
1 |
19.43 |
24.17 |
28.27 |
31.95 |
35.33 |
38.48 |
41.44 |
44.26 |
46.94 |
2 |
13.84 |
17.12 |
19.95 |
22.47 |
24.79 |
26.94 |
28.96 |
30.88 |
32.71 |
|
3 |
11.34 |
13.99 |
16.26 |
18.29 |
20.15 |
21.87 |
23.49 |
25.02 |
26.48 |
|
4 |
9.85 |
12.12 |
14.07 |
15.80 |
17.39 |
18.86 |
20.24 |
21.55 |
22.79 |
|
5 |
8.83 |
10.85 |
12.57 |
14.11 |
15.51 |
16.82 |
18.04 |
19.19 |
20.29 |
|
6 |
8.07 |
9.90 |
11.47 |
12.86 |
14.13 |
15.31 |
16.41 |
17.46 |
18.45 |
|
7 |
7.48 |
9.17 |
10.61 |
11.89 |
13.06 |
14.14 |
15.16 |
16.11 |
17.02 |
|
8 |
7.01 |
8.58 |
9.92 |
11.11 |
12.20 |
13.20 |
14.14 |
15.03 |
15.88 |
|
9 |
6.61 |
8.09 |
9.35 |
10.47 |
11.48 |
12.43 |
13.31 |
14.14 |
14.93 |
|
10 |
6.28 |
7.67 |
8.86 |
9.92 |
10.88 |
11.77 |
12.60 |
13.39 |
14.14 |
|
|
1 mi = 1.61 km |
||||||||||
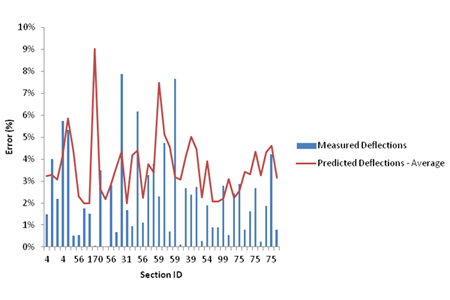
Figure 106. Graph. Comparison between measured error and predicted error for all Kansas sections at 0.2-mi (0.322-km) spacing.
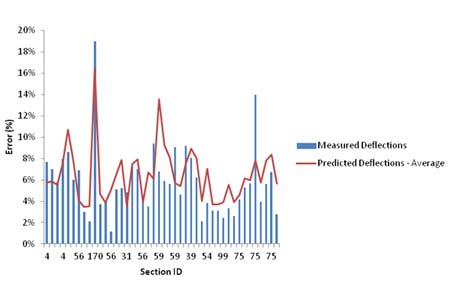
Figure 107. Graph. Comparison between measured error and predicted error for all Kansas sections at 0.5-mi (0.805-km) spacing.
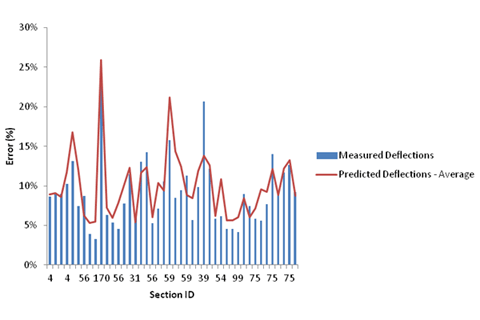
Figure 108. Graph. Comparison between measured error and predicted error for all Kansas sections at 1-mi (1.61-km) spacing.
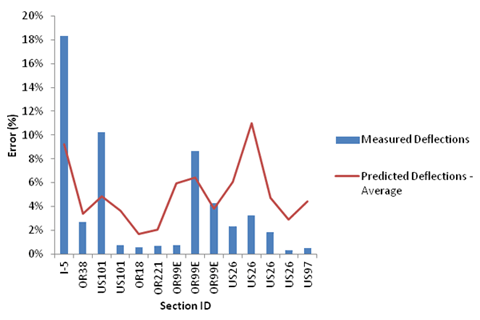
Figure 109. Graph. Comparison between measured error and predicted error for all Oregon sections at 0.2-mi (0.322-km) spacing.
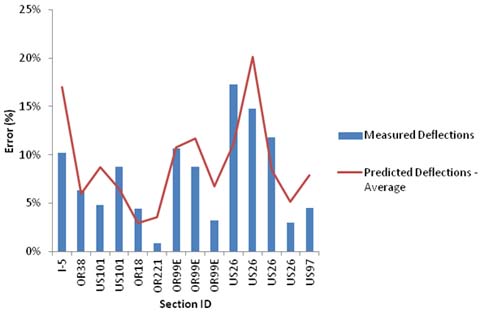
Figure 110. Graph. Comparison between measured error and predicted error for all Oregon sections at 0.5-mi (0.805-km) spacing.
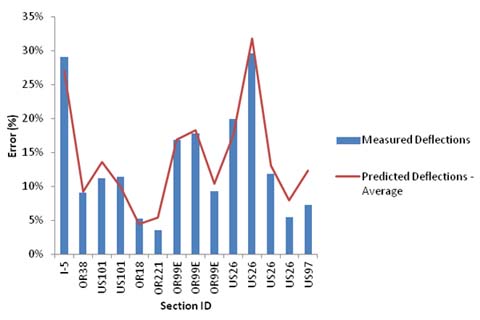
Figure 111. Graph. Comparison between measured error and predicted error for all Oregon sections at 1-mi (1.61-km) spacing.