U.S. Department of Transportation
Federal Highway Administration
1200 New Jersey Avenue, SE
Washington, DC 20590
202-366-4000


Skip to content
Facebook iconYouTube iconTwitter iconFlickr iconLinkedInInstagram

Federal Highway Administration Research and Technology
Coordinating, Developing, and Delivering Highway Transportation Innovations

 
REPORT
This report is an archived publication and may contain dated technical, contact, and link information
Back to Publication List        
Publication Number:  FHWA-HRT-12-023    Date:  December 2012
Publication Number: FHWA-HRT-12-023
Date: December 2012


Simplified Techniques for Evaluation and Interpretation of Pavement Deflections for Network-Level Analysis

APPENDIX D

The mechanistic validation was conducted using linear elastic models to predict the responses of the pavement (stresses, strains and deflections) to load. The software KENPAVE, developed by Huang, was used to model typical flexible and rigid pavement structures.(28) The mechanistic responses were then used to predict performance using the MEPDG.(27)

MECHANISTIC-EMPIRICAL ANALYSIS OF FLEXIBLE PAVEMENTS

Several pavement structures were simulated using the KENLAYER computer program, which is part of the KENPAVE software.(28) The intention was to evaluate different asphalt concrete and base layer thicknesses at different stiffnesses and different subgrade moduli. A factorial study was designed and is presented in table 18.

The combination of all parameters in the factorial experiment resulted in 1,296 sections. It was necessary to find a common variable for comparing the mechanistic responses among different combinations of the input parameters. The choice was the SN used in the 1993 AASHTO Guide for Design of Pavement Structures.(8)

The SN gives a quantitative description of the structural capacity of the different layers in a pavement section. It is a function of layer thicknesses, layer coefficients, and drainage coefficients. The layer coefficients are measures of the relative ability of a unit thickness of a given material to function as a structural component of the pavement. The SN and layer coefficients for a three-layer system can be computed using the following equations:

Figure 88. Equation. Computation of SN. SN equals a subscript 1 times D subscript 1 plus a subscript 2 times D subscript 2 times m subscript 2.
Figure 88. Equation. Computation of SN.


Figure 89. Equation. Computation of the layer coefficient a2 for base course. a subscript 2 equals 0.249 times open parenthesis the logarithm of E subscript 2 closed parenthesis minus 0.977.
Figure 89. Equation. Computation of the layer coefficient a2 for base course.

Where a1 and a2 are the layer coefficients of the asphalt concrete and base layers, respectively, D1 and D2 are the layer thicknesses in inches, and m2 is the base layer drainage coefficient, assumed as unity for simplicity. SN is a dimensionless variable. In figure 89, E2 refers to Mr of the base course in pounds per square inch. Figure 90 describes the trends between deflection parameter I2 and the SN. For simplicity, the data were grouped by subgrade modulus. I2 is the deflection parameter chosen for the final structural logistic model based on roughness performance. Figure 91 describes the trends between deflection parameter CI3 and the SN. CI3 is the deflection parameter chosen for the final structural logistic model based on rutting performance. Figure 92 describes the trends between I1 and SN. I1 is the deflection parameter chosen for the final structural logistic model based on fatigue cracking.
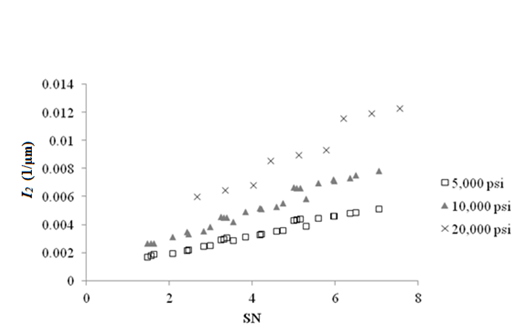
This graph shows a scatter plot of the deflection parameter I subscript 2 as a function of structural number (SN) for a flexible pavement with hot mix asphalt (HMA) modulus of 500,000 psi (3,445,000 kPa). The x-axis represents SN ranging from zero to 8, and the y-axis represents the I subscript 2 value ranging from zero to 0.356 1/mil (zero to 0.014 1/microns). There are three data series corresponding to different subgrade resilient moduli: 5,000, 10,000, and 20,000 psi (34,450, 68,900, and 137,800 kPa). The values for all three series increase with increasing SN. The data series for a subgrade modulus of 20,000 psi (137,800 kPa) have the highest values out of all three series. The first data point has an I subscript 2 value of 0.152 1/mil (0.006 1/microns) and an SN value of 2.67. The last data point has an I subscript 2 value of 0.305 1/mil (0.012 1/microns) and an SN value of 7.54. The 10,000-psi (68,900-kPa) subgrade modulus series is in the middle. The first data point of this series has an I subscript 2 value of 0.069 1/mil (0.0027 1/microns) and an SN value of 1.47. The last data point has an I subscript 2 value of 0.199 1/mil (0.0078 1/microns) and an SN value of 7.04. The series in the bottom part of the figure corresponds to a 5,000-psi(34,450-kPa) subgrade modulus. The first data point has an I subscript 2 value of 0.043 1/mil (0.0017 1/ microns) and an SN value of 1.47. The last data point has an I subscript 2 value of 0.129 1/mil (0.0051 1/ microns) and an SN value of 7.04.
1 1/μm = 25.4 1/mil
1 psi = 6.89 kPa

Figure 90. Graph. Deflection parameter I2 as a function of SN for a flexible pavement with HMA modulus of 500,000 psi (3,445,000 kPa).
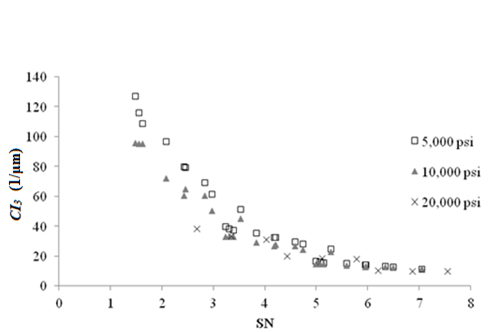
This graph shows a scatter plot of deflection parameter CI subscript 3 as a function of the structural number (SN) for a flexible pavement with hot mix asphalt (HMA) modulus of 500,000 psi (3,445,000 kPa). There are three trends shown in this figure corresponding to different subgrade resilient moduli. The x-axis represents SN from zero to 8, and the y-axis represents the CI subscript 3 from zero to 3,556 1/mil (zero to 140 1/microns). There are three data series shown in this figure corresponding to different subgrade resilient moduli: 5,000, 10,000, and 20,000 psi (34,450, 68,900, and 137,800 kPa). The values for all three series decrease exponentially with increasing SN. The 5,000-psi (34,450-kPa) subgrade has the highest CI subscript 3 values. For the 20,000-psi (137,800-kPa) subgrade, the first data point has an SN value of 2.67 and a CI subscript 3 value of 969.26 1/mil (38.16 1/microns). The last data point has an SN value of 7.54 and a CI subscript 3 of 246.38 1/mil (9.7 1/microns). The 10,000-psi (68,900-kPa) subgrade is the series in the middle. The first data point has an SN value of 1.47 and a CI subscript 3 value of 2,428.24 1/mil (95.6 1/microns). The last data point has an SN value of 7.04 and a CI subscript 3 value of 294.64 1/mil (11.6 1/microns). The 5,000-psi (34,450-kPa) subgrade is the series in the bottom of the graph. The first data point has an SN value of 1.47 and a CI subscript 3 value of 3,225.8 1/mil (127 1/microns). The last data point has an SN value of 7.04 and a CI subscript 3 value of (292.1 1/mil (11.5 1/microns).
1 1/μm = 25.4 1/mil
1 psi = 6.89 kPa

Figure 91. Graph. Deflection parameter CI3 as a function of SN for a flexible pavement with HMA modulus of 500,000 psi (3,445,000 kPa).
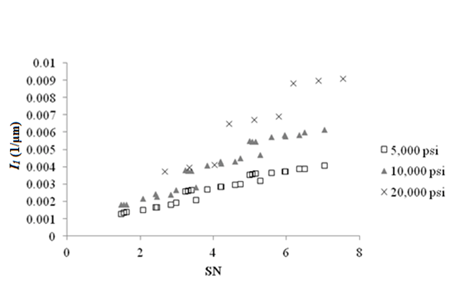
This graph shows a scatter plot of deflection parameter I subscript 1 as a function of the structural number (SN) for a flexible pavement with hot mix asphalt (HMA) modulus of 500,000 psi (3,445,000 kPa). There are three trends shown in this figure corresponding to different subgrade resilient moduli. The x-axis represents SN from zero to 8, and the y-axis represents the I subscript 1 value from zero to 0.254 1/mil (zero to 0.01 1/microns). There are three data series shown in this figure corresponding to different subgrade resilient moduli: 5,000, 10,000, and 20,000 psi (34,450, 68,900, and 137,800 kPa). The values for all three series increase with increasing SN. The 20,000-psi (137,800-kPa) subgrade has the highest values for I subscript 1 followed by the 10,000- and 5,000-psi (68,900- and 34,450-kPa) subgrades. For the 20,000-psi (137,800-kPa) subgrade, the first data point has an SN value of 2.67 and an I subscript 1 value of 0.094 1/mil (0.0037 1/microns). The last data point has an SN value of 7.54 and an I subscript 1 value of 0.231 1/mil (0.0091 1/microns). For the 10,000-psi (68,900-kPa) subgrade, the first data point has an SN value of 1.47 and an I subscript 1 value of 0.046 1/mil (0.0018 1/microns). The last data point has an SN value of 7.04 and an I subscript 1 value of 0.155 1/mil (0.0061 1/microns). For the 5,000-psi (34,450-kPa) subgrade, the first data point has an SN value of 1.47 and an I subscript 1 value of 0.033 1/mil (0.0013 1/microns). The last data point has an SN value of 7.04 and an I subscript 1 value of 0.104 1/mil (0.0041 1/microns).
1 1/μm = 25.4 1/mil
1 psi = 6.89 kPa


Figure 92. Graph. Deflection parameter I1 as a function of SN for a flexible pavement with HMA modulus of 500,000 psi (3,445,000 kPa).

Comparison with MEPDG Predicted Performance

The MEPDG performance prediction models were used to compare predicted distress performance at the end of the design life with the estimated structural condition obtained from the logistic structural model. This task was accomplished by applying the MEPDG models using the mechanistic responses calculated by KENPAVE.

Two models were considered-rutting and fatigue cracking. At first, the roughness model was also in the scope. However, this particular model requires additional site factors that often dominate the analysis. Therefore, comparison between the outcome of the structural logistic model based on roughness and predicted roughness performance was not included in this exercise. The calculations were performed in Microsoft Excel® and not within the MEPDG software due to computational time required to run all scenarios. Since the objective is the comparison and trend evaluation, this assumption had no impact on the outcome or conclusions.

The equation in figure 93 predicts the number of load repetitions to fatigue cracking failure, where is the tensile strain at the bottom of the asphalt surface layer and ει is the elastic modulus of the asphalt layer. k'1 and C are parameters calculated using equations in figure 94 through figure 96 where Va is the percentage of air voids and Vb is the percentage of binder content

N subscript f equals 0.00432 times k prime subscript 1 times C times open parenthesis 1 divided by epsilon subscript t closed parenthesis raised to the power of 3.9492 times open parenthesis 1 divided by E closed parenthesis raised to the power of 1.281.

Figure 93. Equation. Calculation of number of load repetitions to fatigue failure.

k prime subscript 1 equals 1 divided by the quantity 0.000398 plus 0.003602 divided by 1 plus constant e raised to the power of 11.02 minus 3.49 times h subscript ac.

Figure 94. Equation. Calculation of correction for different asphalt layer thickness effects.

C equals 10 raised to the power of M.

Figure 95. Equation. Calculation of laboratory to field adjustment factor.

Calculation of parameter M. M equals 4.84 times open parenthesis V subscript b divided by V subscript a plus V subscript b minus 0.69 closed parenthesis.

Figure 96. Equation. Calculation of parameter M.

The damage related to fatigue cracking, D, is computed using the Miner's law and bottom-up cracking in percentage of total lane area is obtained through the equation in figure 97 in which C1, C'1, C2 and, C'2 are constants.

FC subscript bottom equals open parenthesis 6,000 divided by 1 plus e raised to the power of open parenthesis C subscript 1 times C prime subscript 1 plus C subscript 2 times C prime subscript 2 times the logarithm with base 10 of open parenthesis D times 100 closed parenthesis closed parenthesis times open parenthesis 1 divided by 60 closed parenthesis.

Figure 97. Equation. Fatigue cracking prediction.

Figure 32 describes the sensitivity of I1 structural logistic model probability based on fatigue cracking to MEPDG predicted fatigue cracking performance for flexible pavements. The trends agree with expectations; high probabilities of good structural condition are associated with low levels of fatigue cracking. As the probability decreases, the predicted area of fatigue cracking increases.

The analysis using the rutting model was simplified, and only rutting at the asphalt concrete surface layer was used. The current MEPDG model for asphalt concrete rutting is provided in figure 98 where εp is the plastic strain, εr is the elastic strain, T is temperature (Fahrenheit), N is the number of load applications, and k1 is a constant that depends on depth at which the elastic strain is calculated and is given by equations in figure 99 and figure 100. The total rutting in the asphalt layer is calculated by integrating the calculated plastic strain over the thickness of the layer.

Epsilon subscript p divided by epsilon subscript r equals k subscript 1 times 10 raised to the power of -3.35412 times T raised to the power of 1.5606 times N raised to the power of 0.4791.

Figure 98. Equation. Calculation of permanent deformation.

k subscript 1 equals open parenthesis C subscript 1 plus C subscript 2 times depth closed parenthesis times 0.328196 raised to the power of depth.

Figure 99. Equation. Calculation of k1.

This figure shows two separate equations. The first equation is C subscript 1 equals -0.1039 times h squared subscript ac plus 2.4868 times h subscript ac minus 17.342. The second equation is C subscript 2 equals 0.0172 times h squared subscript ac minus 1.7331 times h subscript ac plus 27.428.
Figure 100. Equation. Calculation of C1 and C2.

Figure 101 describes the sensitivity of CI3 structural logistic model probability based on rutting to MEPDG predicted AC rutting performance for flexible pavements. In this plot, the trends agree with expectations; high probabilities of good structural condition are associated with small permanent deformation. As the probability decreases, predicted AC rutting increases.

This graph shows a scatter plot of sensitivity of CI subscript 3 structural logistic model probability based on rutting performance to Mechanistic-Empirical Pavement Design Guide (MEPDG) predicted rutting performance to Mechanistic-Empirical Pavement Design Guide (MEPDG) predicted rutting for flexible pavements. The x-axis represents the rutting depth from zero to 3 inches (zero to 76.2 mm), and the y-axis represents the acceptable probability from zero to 0.9. There are three data series shown in this figure corresponding to different subgrade resilient moduli: 5,000, 10,000, and 20,000 psi (34,450, 68,900, and 137,800 kPa). The probability values for all three series start at a probability of about 0.82 and decrease with increasing rutting depth. Some of the data points from the different series fall in the same place; however, the series corresponding to the highest subgrade modulus of 20,000 psi (137,800 kPa) has the highest values for the probability. For this series, the lowest probability at a rutting depth of 1.8 inches (45.72 mm) is 0.76. The 10,000-psi (68,900-kPa) subgrade modulus series is in the middle, with the lowest probability of 0.6 at about 2.5 inches (63.5 mm) of rutting depth. The lowest probability values match with the series having the lowest subgrade modulus of 5,000 psi (34,450 kPa). In this case, the lowest probability is 0.49 for about 2.5 inches (63.5 mm) of rutting depth.

1 inch = 25.4 mm
1 psi = 6.89 kPa

Figure 101. Graph. Sensitivity of CI3 structural logistic model probability based on rutting performance to MEPDG predicted rutting for flexible pavements.

MECHANISTIC-EMPIRICAL ANALYSIS OF RIGID PAVEMENTS

Several pavement structures were simulated using the KENSLAB computer program, which is part of the KENPAVE software. The intention was to evaluate different JPCP slab thicknesses and subgrade moduli and the consequences to the outcome of the structural logistic models. A factorial study was designed and is presented in table 19.

The deflection parameters of the best logistic models developed were computed for the structures simulated in the factorial experiment. Only the FWD test at the center of the slab was evaluated. The objective was to verify if trends would agree with expected outcomes from the models. At first, the deflection parameters were plotted against the slab thickness (i.e., considered as reference for the strength of the pavement section). Figure 31 shows the trends between deflection parameter I1 and slab thickness for three subgrade moduli. I1 was chosen for the final structural logistic model based on roughness performance. The results indicate that I1 increased as slab thickness increased, as expected.

Figure 102 shows the trends between deflection parameter D6 and slab thickness. D6 was chosen for the final structural logistic model based on faulting performance. D6 is decreased as slab thickness increased, as expected. However, the sensitivity reduced when the subgrade modulus was stiffer.

This graph shows a scatter plot of sensitivity of deflection parameter D subscript 6 to slab thickness. The x-axis represents the slab thickness from 7 to 13 inches (117.8 to 330.2 mm), and the y-axis represents the D subscript 6 values ranging from zero to 3,556 1/mil (zero to 140 1/microns). There are three data series corresponding to different subgrade resilient moduli: 5,000, 10,000, and 20,000 psi (34,450, 68,900, and 137,800 kPa). The values for all three series decrease following a power trend with increasing slab thickness. Each trend is composed of five data points. All series start at a slab thickness of 8 inches (203.2 mm) and end at 12 inches (304.8 mm). The data series for a subgrade modulus of 5,000 psi (34,450 kPa) have the highest values out of all three series. The 20,000-psi (137,800-kPa) subgrade modulus is in the bottom of the plot, and the first data point has a D subscript 6 value of 1,322.58 1/mil (52.07 1/microns). The last data point has a D subscript 6 value of 967.74 1/mil (38.1 1/microns). The 10,000-psi (68,900-kPa) subgrade modulus series is in the middle of the graph. The first and last data points have D subscript 6 values of 1,987.04 and 1,419.35 1/mil (78.23 and 55.88 1/microns), respectively. The 5,000-psi (34,450-kPa) subgrade modulus series has the highest values for D subscript 6, with the first and last data points having values of 2,922.52 and 1,993.65 1/mil (115.06 and 78.49 1/microns), respectively

1 1/μm = 25.4 1/mil
1 psi = 6.89 kPa

Figure 102. Graph. Sensitivity of deflection parameter D6 to slab thickness.

Figure 103 shows the trends between CI4 and slab thickness. CI4 was chosen for the final structural logistic model based on transverse slab cracking. CI4 is sensitive to slab thickness, and the trend indicates that the value decreased as slab thickness increased, as expected.

This graph shows a scatter plot that describes the sensitivity of deflection parameter CI subscript 4 to slab thickness. The x-axis represents the slab thickness from 7 to 13 inches (117.8 to 330.2 mm), and the y-axis represents the CI subscript 4 values ranging from zero to 304.8 1/mil (zero to 12 1/microns). There are three data series corresponding to different subgrade resilient moduli: 5,000, 10,000, and 20,000 psi (34,450, 68,900, and 137,800 kPa). The values for all three series decrease following a power trend with increasing slab thickness. Each trend is composed of five data points. All series start and end at a slab thickness of 8 and 12 inches (203.2 and 304.8 mm), respectively. The series with the 5,000-psi (34,450 kPa) subgrade modulus has the highest CI subscript 4 values. The 20,000-psi (137,800-kPa) subgrade modulus is the series in the bottom of the plot, with the first data point having a CI subscript 4 value of 212.85 1/mil (8.38 1/microns), and the last data point has a CI subscript 4 value of 83.82 1/mil (3.3 1/microns). The 10,000-psi (68,900-kPa) subgrade modulus is the middle series. The first and last data points have CI subscript 4 values of 245.11 and 103.12 1/mil (9.65 and 4.06 1/microns), respectively. For the 5,000-psi (34,450-kPa) subgrade modulus, the first and last data points have CI subscript 4 values of 299.72 and 117.45 1/mil (11.18 and 4.57 1/microns), respectively.

1 1/μm = 25.4 1/mil
1 psi = 6.89 kPa

Figure 103. Graph. Sensitivity of deflection parameter CI4 to slab thickness.

Comparison with MEPDG Predicted Performance

In the case of rigid pavements, the MEPDG was used to generate the performance predictions. There were only 15 scenarios to run, and the rigid pavement analysis was performed much faster than the flexible pavement analysis.

Figure 33 shows the sensitivity of I1 structural logistic model probability based on roughness to the MEPDG predicted roughness performance for rigid pavements. It can be seen that the trends agree with expectations; high probabilities of good structural condition are associated with low values of IRI. As the probability decreased, the predicted IRI increased. This plot confirms that the structural logistic model is capable of providing an assessment of structural condition that is tied to an expectation of performance.

Figure 104 shows the sensitivity of D6 structural logistic model probability based on faulting to MEPDG predicted faulting performance for rigid pavements. Again in this plot, the trends agree with expectations; high probabilities of good structural condition are associated with low faulting values. As the probability decreases, predicted joint faulting increases. It is important to note that in this particular model, although the trends agree with expectation, the variation in probability of acceptable structural condition is small when compared to previous models.

This graph shows a scatter plot that describes the sensitivity of D subscript 6 structural logistic model probability based on faulting to Mechanistic-Empirical Pavement Design Guide (MEPDG) predicted faulting performance for rigid pavements. The x-axis represents faulting from zero to 0.2 inches (zero to 5.08 mm), and the y-axis represents the D subscript 6 probability based on faulting ranging from zero to 0.8. There are three data series corresponding to different subgrade resilient moduli: 5,000, 10,000, and 20,000 psi (34,450, 68,900, and 137,800 kPa). The values for all three series decrease with increasing faulting. They all start at a faulting of about 0.07 inches (1.78 mm) and continue up to a faulting of about 0.16 inches (4.06 mm). For the 20,000-psi (137,800-kPa) subgrade, the probabilities for the first and last data points are 0.66 and 0.63, respectively. For the 10,000-psi (68,900-kPa) subgrade, the probabilities for the first and last data points are 0.62 and 0.57, respectively. For the 5,000-psi (34,450-kPa) subgrade, the probabilities for the first and last data points are 0.68 and 0.61, respectively.

1 psi= 6.89 kPa

Figure 104. Graph. Sensitivity of D6 structural logistic model probability based on faulting performance to MEPDG predicted faulting for rigid pavements.

Figure 105 shows the sensitivity of CI4 structural logistic model probability based on slab cracking to MEPDG predicted slab cracking performance for rigid pavements. The x-axis is presented in log scale to improve the visualization. The trends agree with expectations; high probabilities of good structural condition are associated with low to no slab cracking. As the probability decreases, predicted percentage of cracked slab increases.

This graph shows a scatter plot that describes the sensitivity of CI subscript 4 structural logistic model probability based on slab cracking to Mechanistic-Empirical Pavement Design Guide (MEPDG) predicted slab cracking performance for rigid pavements. The x-axis represents percentage of slabs cracked ranging from 0.01 to 100 percent, and the y-axis represents the CI subscript 4 probability based on slab cracking ranging from zero to 1. The x-axis is in logarithmic scale. There are three data series corresponding to different subgrade resilient moduli: 5,000, 10,000, and 20,000 psi (34,450, 68,900, and 137,800 kPa). The values for all three series decrease with increasing slab cracking. They all start at a percentage slab cracking of about zero percent and continue up to 100 percent. The stronger subgrade is connected to higher probability values for different stages of slab cracking. For the 20,000-psi (137,800-kPa) subgrade, the probabilities for the first and last data points are 0.89 and 0.68, respectively. For the 10,000-psi (68,900-kPa) subgrade, the probabilities for the first and last data points are 0.87 and 0.61, respectively. For the 5,000-psi (34,450-kPa) subgrade, the probabilities for the first and last data points are 0.81 and 0.51, respectively.

1 psi = 6.89 kPa

Figure 105. Graph. Sensitivity of CI4 structural logistic model probability based on slab cracking performance to MEPDG predicted slab cracking for rigid pavements.


Federal Highway Administration | 1200 New Jersey Avenue, SE | Washington, DC 20590 | 202-366-4000
Turner-Fairbank Highway Research Center | 6300 Georgetown Pike | McLean, VA | 22101